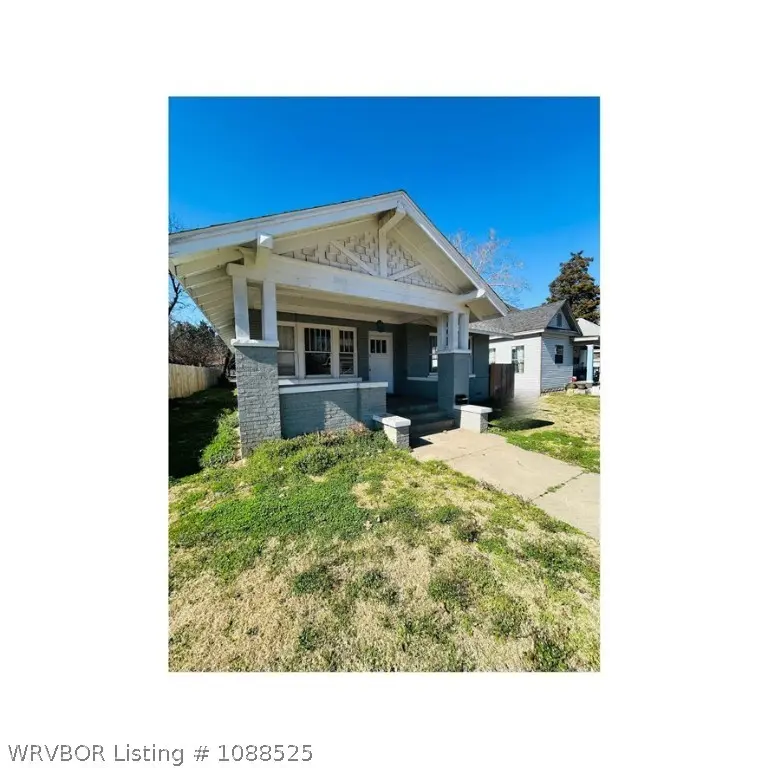
615 N 21st St · Fort Smith, AR
Flood risk 1/10 · Minimal
- FEMA flood zone
- X (unshaded)
- Chance of flooding over 30 yrs
- 0.0%
- Est. flood insurance / yr
- $507 – $1,088
Fire risk 2/10 · Minimal
- Est. fire insurance / yr
- $1,499 – $2,785
Heat risk 7/10 · Major
- Hot days now (above 111°F)
- 7 days/yr
- Hot days in 30 yrs
- 20 days/yr
Wind risk 2/10 · Minimal
- Chance of severe wind over 30 yrs
- 2.0%
Air-quality risk 2/10 · Minimal
- Unhealthy air days now
- 0 days/yr
- Unhealthy air days in 30 yrs
- 1 days/yr
Risk factors via First Street. Map © Google.
Why this score? — see what drove the B grade
The composite is a weighted blend of 9 inputs, each scored 0–100. Each bar is that input's sub-score; the figure is the points it added to the 100-point composite (weight × sub-score).
- Cash flow +28.7/30.0
- ARV discount +15.0/15.0
- DSCR +10.0/10.0
- 1% rule +7.2/10.0
- Rent growth +3.6/5.0
- Livability +3.2/5.0
- Schools +3.1/10.0
- Condition / age +2.5/5.0
- Appreciation +0.0/10.0
$85,000
🖨 Deal sheet 📄 Offer letter ✓ Due diligence
Listing remarks
Price Reduction! Investor special located within walking distance of Northside High School and Darby Middle School. Natural light floods the open living area. Original hardwood floors and modern crown molding add character and potential to this Northside fixer-upper. Home features a nice sized front "sitting" porch and a huge, privacy fenced back yard. The property is suited perfectly for investors or first time home-buyers wanting the make this space their own at an affordable price point! Call or text Joe today to schedule a showing.
Key facts
- 7,000 sq ft lot
- Listed 59 days
Tags
Property features AI
Exterior
- Parking: Concrete parking
- Utilities: Public water; Electricity available; Sewer available; Water available
- Home design: Single-family house; One story
- Construction: Brick construction
- Exterior features: Front porch; Back yard fence; Shingle roof; Public maintained road
Interior
- Kitchen: Range
- Flooring: Ceramic tile; Laminate; Simulated wood; Wood
- Bathrooms: 1 full bathroom
- Heating & cooling: Central heating; No secondary heating specified; Central air; Window unit(s)
- Interior features: Built-in features; Eat-in kitchen; Blinds; Fireplace in the living room
- Laundry & utility: Washer hookup; Electric dryer hookup; Electric water heater
Neighborhood map
What this means for you Summary
Snapshot
- This is a 3-bed/1.0-bath single-family listed at $85k.
Deal economics
- At list price, monthly cash flow is $283 ($3k/yr) — positive.
- The deal already cash-flows at list — no discount required.
- Meets the 1% rule at list price ($1k rent vs $85k).
- Recommended offer: $82k (3.0% below list) — sets the bar for market timing.
- Cap rate 10.3% vs local median 4.3% in Fort Smith — top-decile yield for the area; either an underpriced asset or a hidden risk that comps aren't pricing in. Stress-test before assuming the spread holds.
Location & tenants
- Location reads 65/100 on livability (#151 in AR) — a middle-class / working-renter tenant base. Strengths: cost of living A+, housing A+, health & safety A+; Watch: crime F, amenities F, commute F.
- Fort Smith School District (urban): math 35% / reading 39% proficiency, ranked #106 of 238 in AR (top 44%) — families likely to look elsewhere, expect single-tenant / working-renter base with shorter leases; 64% free/reduced lunch — lower-income household profile, screen leases tightly.
- Zoned schools: Tilles Elementary School (math 34% / reading 29%, grade F, #293 of 454 statewide, top 65%, 300 students, 92% FRL); William O. Darby Jr. High Sch. (math 20% / reading 30%, grade F, #164 of 201 statewide, top 82%, 700 students, 87% FRL); Northside High School (math 12% / reading 27%, grade F, #239 of 292 statewide, top 85%, 2,433 students, 74% FRL) — zoned schools average 84% FRL vs 64% district-wide (20 pts higher); higher-poverty schools than district average — tighter screening recommended.
- Market conditions: Rents rising fast (+4.4%/yr); 174 active listings in the ZIP; 18 comparable units currently listed for rent nearby; rentals at typical pace (median 21d on market — plan ~3-4 weeks tenant-placement turnaround); lower-income renter base — watch delinquency; 388 units permitted in Sebastian County in 2024 (16 in 5+ unit buildings).
Forward outlook
- Local home prices are declining (-3.0%/yr); year-one equity from $588 of loan paydown is wiped out by about $3k of value loss. Plan a longer hold.
- Sebastian County population projected at +7% by 2050 — modest demand growth; plan on rents tracking national, not racing it.
- At projected returns (-3.0% appreciation + 4.4% rent growth), your $24k cash investment doubles in ~8 years — after that, you're playing with house money.
Negotiation context
- It's been on market 60 days — a 3% lower offer ($82k) is reasonable based on typical stale-listing flexibility.
- Current owner paid $60k; 42% above their basis — modest negotiation headroom, anchor on the comps not their cost.
Risks & watch-outs
- Climate carrying-cost: extreme-heat days projected 7→20/yr by 2055 (HVAC capex compounding) — expect insurance premiums to compound above CPI over the hold.
Questions for the listing agent
- It's been on market 60 days. Have you received any prior offers? Is the seller open to a 3% concession, seller financing, or rate buy-down credit?
- Is there a deadline driving the sale (1031 exchange, divorce, estate, relocation)? That informs how much negotiation room exists.
- Schools are D-rated, which usually means shorter tenancies and higher turnover. Who's the typical renter profile here, and what's been the actual vacancy rate?
- Crime grade is F in this area — have there been break-ins, vandalism, or insurance claims at this property in the last 3 years? What carrier currently insures it and at what premium?
- What's the average days-on-market for RENTAL listings here right now (not sales)? A rising rental-DOM trend means longer vacancies and softer asking-rent achievability than the comps imply.
- What's the recent tenant-quality profile in this submarket — average credit score on applications, eviction rate, late-payment / NSF rate, and stable-employment percentage? A property-management company in the area should have these aggregated.
- How much new for-sale + rental construction is in the pipeline within 1–3 miles? Heavy new supply typically softens prices + rents 12–24 months out; constrained supply supports both.
Investment metrics
- 1% rule
- 1.22% ✓
- Cap rate
- 10.28%
- Cash-on-cash
- 14.25%
- DSCR
- 1.63
- GRM
- 6.8
CMA / ARV
- ARV (on-the-fly)
- $114,036
- Comps found
- 12
Show comp detail 12 sales within ~0.75 mi
| Address | Dist | Beds/Ba | Sqft | Sold | Price | $/sf | Match |
|---|---|---|---|---|---|---|---|
| 218 N 21st St | 0.26mi | 3/1.5 | 1,311 (-1%) | 7mo | $175,000 | $133 | 78 |
| 2808 Alabama Ave | 0.30mi | 3/2.0 | 1,316 (-1%) | 4mo | $138,400 | $105 | 77 |
| 1301 N Greenwood Ave | 0.44mi | 2/1.0 (-1) | 1,304 (-2%) | 2mo | $112,000 | $86 | 70 |
| 1716 N J St | 0.32mi | 3/1.5 | 1,196 (-10%) | 5mo | $60,000 | $50 | 63 |
| 606 S 18th St | 0.56mi | 2/1.5 (-1) | 1,298 (-2%) | 3mo | $40,000 | $31 | 61 |
| 2714 N J St | 0.39mi | 2/1.0 (-1) | 1,435 (+8%) | 4mo | $63,600 | $44 | 59 |
| 603 Lecta Ave | 0.34mi | 2/1.0 (-1) | 1,460 (+10%) | 5mo | $164,000 | $112 | 58 |
| 315 N 18th St | 0.28mi | 3/2.0 | 1,521 (+15%) | 6mo | $127,500 | $84 | 54 |
| 919 Clifton Ct | 0.59mi | 3/1.5 | 1,455 (+10%) | 4mo | $176,000 | $121 | 51 |
| 428 N 35th St | 0.75mi | 3/1.5 | 1,420 (+7%) | 2mo | $110,000 | $77 | 50 |
| 635 Clifton Ct | 0.57mi | 2/1.0 (-1) | 1,168 (-12%) | 0mo | $90,000 | $77 | 48 |
| 722 S 19th St | 0.60mi | 3/1.0 | 1,505 (+14%) | 3mo | $135,000 | $90 | 47 |
Match score weights: distance 35% · size 25% · config 20% · recency 20%. Top-matched comps best support the ARV.
Projected returns pro-forma
-3.0% appreciation · 4.37% rent growth · sell at horizon
- IRR
- 6.0%
- Equity multiple
- 1.24×
- Total profit
- $5,657
- Equity at exit
- $12,674
- IRR
- 16.5%
- Equity multiple
- 2.43×
- Total profit
- $34,149
- Equity at exit
- $7,349
Cash invested: $23,800 (down + closing). Projections, not guarantees.
Landlord ↔ Tenant lean methodology
- Overall (STATE)
- 92 Strongly Landlord-Friendly
- State Arkansas
- 92 Strongly Landlord-Friendly · R+14
- County
- — inherits STATE
- City
- — inherits STATE
ZIP-level market 72901
- Rents YoY
- 4.4%
- Active inventory
- 174
- Price-to-rent
- 6.8×
Monthly cashflow live
- Estimated rent
- $1,037 high interval (Pro) →
- Mortgage (P&I)
- −$446
- Tax from tax record
- −$55 /mo · $662/yr
- Insurance
- −$35
- HOA
- −$0
- Vacancy / Maint / Mgmt
- −$218
- Net cashflow
- $283
Break-even live
UW: 25.0% down · 7.5% · 30yr · 1.5% tax · 5.0% vac · 8.0% maint · 8.0% mgmt
Financing live
Cash to close
- Down payment
- $21,250
- Closing costs
- $2,550
- Reserves months
- —
- Total cash needed
- —
Loan-product check · same deal, 3 products live
Conventional
25% down · 7.5% · 30yr
- Down + closing
- —
- Monthly P&I
- —
- Monthly cashflow
- —
- DSCR
- —
- Eligible?
- —
Personal DTI + credit; lowest rate.
DSCR
20% down · 8.5% · 30yr
- Down + closing
- —
- Monthly P&I
- —
- Monthly cashflow
- —
- DSCR
- —
- Eligible?
- —
No personal income docs; deal must DSCR.
Hard money
10% down · 12.0% · 12mo
- Down + closing
- —
- Monthly P&I
- —
- Monthly cashflow
- —
- DSCR
- —
- Eligible?
- —
Short-term bridge; refi at stabilization.
Rent comps 18 comps
| Address | Beds | Baths | Sqft | Rent | $/sqft | DOM | Units | Dist |
|---|---|---|---|---|---|---|---|---|
| 501 N May Ave Fort Smith, AR | 2.0 | 1.0 | 1022 | $825 | $0.81 | 21d | 1 | 0.32mi |
| 3101 Park Ave Fort Smith, AR | 3.0 | 2.0 | 1634 | $1,650 | $1.01 | 13d | 1 | 0.54mi |
| 800 S 19th St Fort Smith, AR | 2.0 | 1.0 | 1286 | $1,095 | $0.85 | 3d | 1 | 0.59mi |
| 3014 Presley St Fort Smith, AR | 1.0–2.0 | 1.0–1.5 | 782 | $925 | $1.18 | 13d | 4 | 0.70mi |
| 3014 Presley St Unit FB44 Fort Smith, AR | 2.0 | 1.5 | 1040 | $925 | $0.89 | 21d | 1 | 0.70mi |
| 101 N 11th St Unit 112 Fort Smith, AR | 2.0 | 2.0 | 1040 | $1,240 | $1.19 | 21d | 1 | 0.75mi |
| 101 N 11th St Fort Smith, AR | 1.0–2.0 | 1.0–2.0 | 806 | $1,115 | $1.38 | 3d | 9 | 0.77mi |
| 1453 N 35th St Fort Smith, AR | 2.0 | 1.0 | 913 | $900 | $0.99 | 21d | 1 | 0.95mi |
| 1307 S 17th St Fort Smith, AR | 3.0 | 1.5 | 1161 | $1,150 | $0.99 | 21d | 1 | 0.95mi |
| 1907 S N St Fort Smith, AR | 2.0 | 1.0 | 1114 | $950 | $0.85 | 21d | 1 | 0.99mi |
| 2820 S O St Fort Smith, AR | 2.0 | 1.5 | 1024 | $875 | $0.85 | 21d | 1 | 1.10mi |
| 811 N 41st St Fort Smith, AR | 2.0 | 1.0 | 1306 | $900 | $0.69 | 13d | 1 | 1.11mi |
| 3500 S N St Fort Smith, AR | 1.0–2.0 | 1.0–1.5 | 834 | $935 | $1.12 | 21d | 1 | 1.23mi |
| 109 N 3rd St Fort Smith, AR | 1.0–2.0 | 1.0–2.5 | 1066 | $1,300 | $1.22 | 3d | 2 | 1.26mi |
| 3906 S N St Unit 3904 Fort Smith, AR | 2.0 | 1.5 | 1024 | $800 | $0.78 | 21d | 1 | 1.38mi |
| 1915 S U St Unit A Fort Smith, AR | 2.0 | 2.0 | 900 | $975 | $1.08 | 21d | 1 | 1.42mi |
| 2409 N 30th St Unit 1 Fort Smith, AR | 2.0 | 2.5 | 1258 | $950 | $0.76 | 21d | 1 | 1.48mi |
| 2200 S 17th St Unit D Fort Smith, AR | 3.0 | 2.0 | 1123 | $975 | $0.87 | 21d | 1 | 1.50mi |
Listing history 20 events
-
2026-06-19days on market $85,000 Active 60 DOM
-
2026-06-18days on market $85,000 Active 59 DOM
-
2026-06-17days on market $85,000 Active 58 DOM
-
2026-06-16days on market $85,000 Active 57 DOM
-
2026-06-15days on market $85,000 Active 56 DOM
-
2026-06-14days on market $85,000 Active 54 DOM
-
2026-06-13days on market $85,000 Active 53 DOM
-
2026-06-10days on market $85,000 Active 51 DOM
-
2026-06-09days on market $85,000 Active 50 DOM
-
2026-06-08days on market $85,000 Active 49 DOM
-
2026-06-07remarks 544-char remark
-
2026-06-07pricedays on market $85,000 Active 48 DOM
-
2026-06-03days on market $99,000 Active 44 DOM
-
2026-06-02days on market $99,000 Active 43 DOM
-
2026-06-01days on market $99,000 Active 42 DOM
-
2026-05-31days on market $99,000 Active 41 DOM
-
2026-05-30days on market $99,000 Active 40 DOM
-
2026-04-30price $99,000
-
2026-04-20$109,000 Active
-
2020-08-20soldstatus $60,000
ⓘ Source: listings_history table (triggers on properties + properties_extension) + one-shot
backfill from property_details.listing_events for pre-trigger history.
Tax reassessment forecast AR · Resets to sale price
- Current annual tax
- $662 · $55/mo
- Projected year-2 tax
- $662 · $55/mo
- Expected delta
- $0/yr ($0/mo · 0.0%)
ⓘ Screening estimate from a state-policy table — verify with the county assessor before closing.
Climate risk First Street
- Flood 1/10 Low FEMA zone X (unshaded) · 0% chance over 30 yrs
- Wildfire 2/10 Low
- Heat 7/10 Severe 7 d/yr ≥111°F today · 20 d/yr by 30 yrs out
- Wind 2/10 Low 2% chance of damaging wind over 30 yrs
- Air quality 2/10 Low 0 unhealthy d/yr today · 1 by 30 yrs out
Nearby sold comps map
Loading sold comps map…
Walkable amenities ~0.75 mi
Loading nearby amenities…
Taxation est. · year 1
- Rental income
- $12,439
- − Mortgage interest
- −$4,761
- − Property taxes
- −$662
- − Insurance
- −$425
- − Repairs & maintenance
- −$995
- − Management
- −$995
- − Depreciation
- −$2,473
- Taxable income
- $2,128
- Est. tax owed @ 24.0%
- −$511
- After-tax cash flow
- $2,880/yr
For passive investors: Depreciation is non-cash, so a rental often shows a tax loss while cash-flowing — sheltering income. Rental losses are passive: they offset passive income freely, and up to $25,000/yr can offset ordinary (W-2) income if you actively participate and your MAGI is under $100k (phasing out to $0 by $150k); unused losses carry forward. On sale, claimed depreciation is recaptured at up to 25%, and gains may owe capital-gains tax (a 1031 exchange can defer both). Figures are a year-1 estimate at your 24.0% rate — not tax advice; consult a CPA.
Schools (NCES district)
- District
- Fort Smith School District
- NCES district ID
- 0506330
- Math proficiency
- 35% ▼ -11.00%
- Reading proficiency
- 39% ▼ -7.00%
- Median HH income
- $36,066
- Composite
- 30.66/100
- National rank
- #6183
- State rank
- #106 of 238 in AR
Livability — Fort Smith
- Score
- 65/100
- State rank
- #151
- US rank
- #13185
Category grades
Schools grade is shown separately in the Schools card above.
Census & demographics
- Census place
- Fort Smith, AR
- County
- Sebastian County · 99,312 people
- City population
- 94,356
- Metro
- Fort Smith, AR-OK
- Population (ZIP)
- 19,819
- Household income
- $42,851
- Rent vs Own
- Severe rent burden
- 1117.0
Population outlook (Sebastian County) Hauer SSP2
- Today (2025)
- 133,992 people
- By 2030
- 136,620 · +2.0%
- By 2040
- 140,832 · +5.1%
- By 2050
- 143,301 · +6.9%
- By 2075
- 147,964 · +10.4%
- By 2100
- 145,848 · +8.8%
Race, ethnicity, and origin ACS 2023
- Neighborhood character
- Diverse neighborhood (Simpson 0.60)
- Race & ethnicity
- White 60% Hispanic / Latino 17% Two or more races 12% Black 10% Asian 2%
- Hispanic origin (detail)
- Mexican 11% Puerto Rican 1%
- Common ancestry
- Slovak 2% Lithuanian 2% Italian 1%
- Foreign-born
- 9% · Canada, Vietnam, Guatemala
- Languages at home
- 83% English-only · Spanish 14% Other Asian/Pacific 1% Vietnamese 1%
Political lean MEDSL · Sebastian
- 2024 margin
- Solid R (+37.5) · D 30.0% · R 67.6% · Other 2.4%
- 2008→2024 swing
- -2.9pp toward R · 2008: -34.6pp · 2024: -37.5pp
- All cycles
- 2024: R+37.5 2020: R+35.5 2016: R+38.1 2012: R+37.1 2008: R+34.6
Not yet ingested
- Civics
- —
Market trends
- HPI YoY
- ▼ -173.82%
- Current HPI
- 172.3777
- Rent YoY
- ▲ 4.37%
- Metro
- Fort Smith, AR-OK
- State GDP YoY
- ▲ 3.80%
- F500 in state
- 10
Industry mix (Fortune 500 HQ in AR)
| Industry | F500 HQs | Revenue |
|---|---|---|
| Retail | 1 | $681B |
|
||
| Food / Agriculture | 1 | $53B |
|
||
| Retail / Energy | 1 | $22B |
|
||
| Transportation / Logistics | 1 | $12B |
|
||
| Energy | 1 | $4B |
|
||
Price history
+65.0% since first listed3 events — show timeline
- 2026-04-30 Price Changed $99,000 WRVBOR
- 2026-04-20 Listed $109,000 WRVBOR
- 2020-08-20 Sold (Public Records) $60,000 Public Records
Property tax history
+3.6%/yrLatest (2025): $662 · +9.0% YoY. Source: county tax records.
Cash-flow waterfall
monthlySold comps — $/sqft
last 12 mo · ≤1 miLoading sold comps…