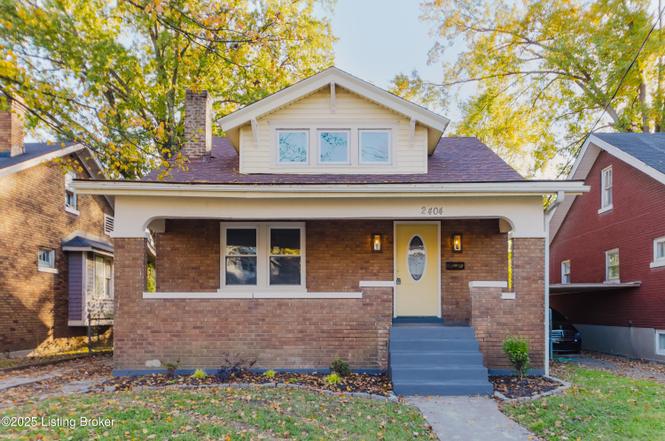
2404 Burwell Ave · Louisville, KY
Flood risk 1/10 · Minimal
- FEMA flood zone
- X (unshaded)
- Chance of flooding over 30 yrs
- 0.0%
- Est. flood insurance / yr
- $473 – $860
Fire risk 1/10 · Minimal
- Est. fire insurance / yr
- $839 – $1,559
Heat risk 5/10 · Moderate
- Hot days now (above 104°F)
- 7 days/yr
- Hot days in 30 yrs
- 19 days/yr
Wind risk 2/10 · Minimal
- Chance of severe wind over 30 yrs
- 1.0%
Air-quality risk 2/10 · Minimal
- Unhealthy air days now
- 1 days/yr
- Unhealthy air days in 30 yrs
- 3 days/yr
Risk factors via First Street. Map © Google.
Why this score? — see what drove the D- grade
The composite is a weighted blend of 9 inputs, each scored 0–100. Each bar is that input's sub-score; the figure is the points it added to the 100-point composite (weight × sub-score).
- Appreciation +10.0/10.0
- Cash flow +9.2/30.0
- Rent growth +4.5/5.0
- Livability +3.2/5.0
- DSCR +2.6/10.0
- Condition / age +2.5/5.0
- Schools +2.3/10.0
- ARV discount +1.9/15.0
- 1% rule +1.5/10.0
$199,999
🖨 Deal sheet (PDF) 📄 Offer letter ✓ Due diligence
Listing remarks MLS
Welcome to your next investment opportunity! This 3 bedroom , 1 bathroom home has been fully gutted and is ready for transformation. Sitting as a blank canvas, this property is ideal for investors, visionaries, or savvy homeowners looking to customize a space to their exact style and specifications. With ample square footage and flexible layout, there is great potential to add an additional bathroom and working spaces increasing both functionality and value. The bones are here , and the possibilities are endless-reimagine this space as a modern family home, a lucrative rental, or your next quick flip. Located in an emerging and commuter friendly neighborhood, this project is perfect for anyone seeking high return on investment.
Key facts
- Golden front door
- Brass fixtures
- Wood cabinetry
Tags
Neighborhood map
What this means for you Summary
Snapshot
- This is a 3-bed/2.0-bath single-family listed at $200k.
Deal economics
- At list price, monthly cash flow is $-150 ($-2k/yr) — negative.
- To cash-flow at today's rent, offer at most $174k (13.2% below list).
- To meet the 1% rule (rent ≥ 1% of price), the offer needs to be $131k (34.6% below list).
- Recommended offer: $131k (34.6% below list) — sets the bar for 1% rule.
Location & tenants
- Location reads 63/100 on livability (#333 in KY) — a middle-class / working-renter tenant base. Strengths: cost of living A+, housing A+; Watch: employment C-, health & safety D+, crime F.
- Jefferson County (urban): math 19% / reading 35% proficiency, ranked #121 of 165 in KY (top 73%) — low school quality limits family demand, transient renter base, plan for 1-2y turnover.
- Zoned schools: Mcferran Preparatory Academy (math 2% / reading 8%, grade F, #670 of 676 statewide, top 100%, 691 students, 83% FRL); Carrithers Middle (math 10% / reading 36%, grade F, #197 of 217 statewide, top 92%, 583 students, 60% FRL); Iroquois High (math 12% / reading 8%, grade F, #245 of 254 statewide, top 97%, 1,090 students, 74% FRL) — zoned schools average 72% FRL vs 56% district-wide (16 pts higher); higher-poverty schools than district average — tighter screening recommended.
- Zoned-school proficiency averages 13% at this address vs 27% district-wide (-14 pts) — the specific schools serving this property underperform the Jefferson County average; the district grade overstates school quality for this exact location.
- Market conditions: Rents rising fast (+8.1%/yr); 93 active listings in the ZIP; 34 comparable units currently listed for rent nearby; rentals at typical pace (median 26d on market — plan ~3-4 weeks tenant-placement turnaround); lower-income renter base — watch delinquency; 2,836 units permitted in Jefferson County in 2024 (1,558 in 5+ unit buildings).
Forward outlook
- In year one you build about $21k of equity ($1k loan paydown + $20k appreciation (10.0% local appreciation)).
- Jefferson County population projected at +13% by 2050 — modest demand growth; plan on rents tracking national, not racing it.
- By year 2, paydown + projected appreciation supports a ~$34k cash-out refi (75% LTV) — recoverable capital for the next deal without selling this one.
Negotiation context
- It's been on market 69 days — a 6% lower offer ($188k) is reasonable based on typical stale-listing flexibility.
- 3 sale attempts since 2y ago with the ask held roughly flat each time — persistent listings suggest the price (not the market) is what's stuck; bring a comps-based counter.
- Current owner paid $70k; list at $200k implies a 186% gain — meaningful room to come down on a strong offer.
Risks & watch-outs
- Watch-outs: built in 1929 — expect roof / HVAC / electrical / plumbing capex.
- Climate carrying-cost: extreme-heat days projected 7→19/yr by 2055 (HVAC capex compounding) — expect insurance premiums to compound above CPI over the hold.
Questions for the listing agent
- What do current leases actually rent for vs. the listed asking? Can we see a recent rent roll and the last 12 months of T-12 income?
- It's been on market 69 days. Have you received any prior offers? Is the seller open to a 35% concession, seller financing, or rate buy-down credit?
- Built in 1929 — when were the roof, HVAC, electrical panel, plumbing, and water heater last replaced?
- Why hasn't it sold? Are there any deal-killer items the seller is aware of (foundation, flood, title, zoning, code violations)?
- Is there a deadline driving the sale (1031 exchange, divorce, estate, relocation)? That informs how much negotiation room exists.
- Schools are D-rated, which usually means shorter tenancies and higher turnover. Who's the typical renter profile here, and what's been the actual vacancy rate?
- Crime grade is F in this area — have there been break-ins, vandalism, or insurance claims at this property in the last 3 years? What carrier currently insures it and at what premium?
- The area grade is low — what's the realistic commute time and amenity access for the typical tenant pool here? Any planned neighborhood developments (good or bad) we should know about?
- What's the average days-on-market for RENTAL listings here right now (not sales)? A rising rental-DOM trend means longer vacancies and softer asking-rent achievability than the comps imply.
- What's the recent tenant-quality profile in this submarket — average credit score on applications, eviction rate, late-payment / NSF rate, and stable-employment percentage? A property-management company in the area should have these aggregated.
- How much new for-sale + rental construction is in the pipeline within 1–3 miles? Heavy new supply typically softens prices + rents 12–24 months out; constrained supply supports both.
Investment metrics
- 1% rule
- 0.65% ✗
- Cap rate
- 5.39%
- Cash-on-cash
- -3.21%
- DSCR
- 0.86
- GRM
- 12.7
CMA / ARV
- ARV (on-the-fly)
- $177,828
- Comps found
- 12
Show comp detail 12 sales within ~0.75 mi
| Address | Dist | Beds/Ba | Sqft | Sold | Price | $/sf | Match |
|---|---|---|---|---|---|---|---|
| 2307 W Lee St | 0.11mi | 4/2.0 (+1) | 1,600 (+4%) | 4mo | $172,000 | $108 | 80 |
| 1458 Olive St | 0.33mi | 2/2.0 (-1) | 1,460 (-5%) | 2mo | $90,000 | $62 | 70 |
| 1544 Catalpa St | 0.34mi | 4/2.5 (+1) | 1,596 (+4%) | 1mo | $185,000 | $116 | 69 |
| 1448 Catalpa St | 0.45mi | 4/1.5 (+1) | 1,507 (-2%) | 1mo | $199,000 | $132 | 68 |
| 1334 Cypress St | 0.57mi | 3/2.0 | 1,491 (-3%) | 2mo | $195,000 | $131 | 67 |
| 1456 Beech St | 0.55mi | 3/1.5 | 1,498 (-2%) | 2mo | $130,000 | $87 | 67 |
| 1415 S 28th St | 0.47mi | 3/2.0 | 1,384 (-10%) | 2mo | $190,000 | $137 | 61 |
| 1624 Hemlock Ct | 0.36mi | 3/1.0 | 1,376 (-10%) | 2mo | $32,500 | $24 | 60 |
| 1752 Dixdale Ave | 0.59mi | 3/3.0 | 1,500 (-2%) | 5mo | $189,000 | $126 | 60 |
| 1533 Beech St | 0.46mi | 4/2.0 (+1) | 1,660 (+8%) | 2mo | $120,000 | $72 | 58 |
| 2107 Ratcliffe Ave | 0.51mi | 3/2.0 | 1,706 (+11%) | 5mo | $198,000 | $116 | 53 |
| 1736 W Gaulbert Ave | 0.59mi | 3/1.0 | 1,326 (-14%) | 4mo | $53,600 | $40 | 42 |
Match score weights: distance 35% · size 25% · config 20% · recency 20%. Top-matched comps best support the ARV.
Projected returns pro-forma
10.0% appreciation · 8.0% rent growth · sell at horizon
- IRR
- 23.3%
- Equity multiple
- 2.90×
- Total profit
- $106,198
- Equity at exit
- $180,175
- IRR
- 21.8%
- Equity multiple
- 7.02×
- Total profit
- $337,151
- Equity at exit
- $388,554
Cash invested: $56,000 (down + closing). Projections, not guarantees.
Landlord ↔ Tenant lean methodology
- Overall (STATE)
- 83 Strongly Landlord-Friendly
- State Kentucky
- 83 Strongly Landlord-Friendly · R+16
- County
- — inherits STATE
- City
- — inherits STATE
ZIP-level market 40210
- Home prices YoY
- 12.1%
- Rents YoY
- 8.1%
- Active inventory
- 93
- Price-to-rent
- 12.7×
Monthly cashflow live
- Estimated rent
- $1,308 high interval (Pro) →
- Mortgage (P&I)
- −$1,049
- Tax from tax record
- −$51 /mo · $608/yr
- Insurance
- −$83
- HOA
- −$0
- Vacancy / Maint / Mgmt
- −$275
- Net cashflow
- $-150
Break-even live
Sensitivity live
| Price | -10% $-36 | -5% $-93 | +0% $-150 | +5% $-206 | +10% $-263 |
|---|---|---|---|---|---|
| Rent | -10% $-253 | -5% $-201 | +0% $-150 | +5% $-98 | +10% $-46 |
| Rate | -1.0pp $-49 | -0.5pp $-99 | base $-150 | +0.5pp $-202 | +1.0pp $-254 |
UW: 25.0% down · 7.5% · 30yr · 1.5% tax · 5.0% vac · 8.0% maint · 8.0% mgmt
Financing live
Cash to close
- Down payment
- $50,000
- Closing costs
- $6,000
- Reserves months
- —
- Total cash needed
- —
Loan-product check · same deal, 3 products live
Conventional
25% down · 7.5% · 30yr
- Down + closing
- —
- Monthly P&I
- —
- Monthly cashflow
- —
- DSCR
- —
- Eligible?
- —
Personal DTI + credit; lowest rate.
DSCR
20% down · 8.5% · 30yr
- Down + closing
- —
- Monthly P&I
- —
- Monthly cashflow
- —
- DSCR
- —
- Eligible?
- —
No personal income docs; deal must DSCR.
Hard money
10% down · 12.0% · 12mo
- Down + closing
- —
- Monthly P&I
- —
- Monthly cashflow
- —
- DSCR
- —
- Eligible?
- —
Short-term bridge; refi at stabilization.
Rent comps 34 comps
| Address | Beds | Baths | Sqft | Rent | $/sqft | DOM | Units | Dist |
|---|---|---|---|---|---|---|---|---|
| 1545 Catalpa St Louisville, KY | 4.0 | 1.5 | 1760 | $1,545 | $0.88 | 5d | 1 | 0.31mi |
| 2629 Olive St Louisville, KY | 4.0 | 1.0 | 1120 | $1,500 | $1.34 | 25d | 1 | 0.41mi |
| 1410 Standard Village Cir Louisville, KY | 3.0 | 2.0 | 1200 | $900 | $0.75 | 25d | 1 | 0.44mi |
| 1622 Beech St Louisville, KY | 4.0 | 1.0 | 1108 | $1,445 | $1.30 | 17d | 1 | 0.45mi |
| 1618 S 30th St Louisville, KY | 3.0 | 1.0 | 1896 | $1,235 | $0.65 | 17d | 1 | 0.49mi |
| 1774 Bolling Ave Louisville, KY | 3.0 | 2.0 | 1611 | $1,300 | $0.81 | 12d | 1 | 0.54mi |
| 2223 Saint Louis Ave Louisville, KY | 3.0 | 1.5 | 1152 | $1,175 | $1.02 | 25d | 1 | 0.58mi |
| 1339 S 28th St Unit 3 Louisville, KY | 3.0 | 1.0 | 1125 | $1,175 | $1.04 | 22d | 1 | 0.59mi |
| 1714 W Hill St Louisville, KY | 3.0 | 1.0 | 1050 | $1,045 | $1.00 | 25d | 1 | 0.68mi |
| 1854 W Ormsby Ave Louisville, KY | 2.0 | 2.0 | 1094 | $800 | $0.73 | 17d | 1 | 0.72mi |
| 2913 Dumesnil St Apt 3 Louisville, KY | 3.0 | 1.0 | 1112 | $740 | $0.67 | 12d | 1 | 0.75mi |
| 3313 Penway Ave Louisville, KY | 4.0 | 2.0 | 1142 | $1,645 | $1.44 | 25d | 1 | 0.76mi |
| 2706 Hale Ave Unit 1 Louisville, KY | 3.0 | 1.0 | 1100 | $1,400 | $1.27 | 25d | 1 | 0.83mi |
| 2708 Greenwood Ave Apt 1 Louisville, KY | 3.0 | 1.0 | 1100 | $1,300 | $1.18 | 25d | 1 | 1.03mi |
| 1115 S 32nd St Louisville, KY | 3.0 | 1.0 | 1393 | $1,275 | $0.92 | 23d | 1 | 1.05mi |
| 1115 S 32nd St Louisville, KY | 3.0 | 1.0 | 1393 | $1,275 | $0.92 | 25d | 1 | 1.05mi |
| 2912 Greenwood Ave Louisville, KY | 3.0 | 2.0 | 1362 | $1,150 | $0.84 | 17d | 1 | 1.07mi |
| 1705 1/2 Hale Ave Louisville, KY | 3.0 | 2.0 | 1257 | $1,400 | $1.11 | 12d | 1 | 1.08mi |
| 2821 Greenwood Ave #1 Louisville, KY | 3.0 | 1.0 | 1113 | $1,300 | $1.17 | 25d | 1 | 1.08mi |
| 2825 Greenwood Ave #4 Louisville, KY | 3.0 | 1.0 | 1440 | $1,250 | $0.87 | 25d | 1 | 1.09mi |
| 2825 Greenwood Ave #2 Louisville, KY | 2.0 | 1.0 | 1300 | $995 | $0.77 | 25d | 1 | 1.09mi |
| 2711 W Kentucky St Louisville, KY | 3.0 | 1.0 | 1155 | $1,100 | $0.95 | 25d | 1 | 1.16mi |
| 1847 W Kentucky St Louisville, KY | 2.0 | 1.0 | 1368 | $895 | $0.65 | 5d | 1 | 1.19mi |
| 1616 Gallagher St Louisville, KY | 3.0 | 1.5 | 1056 | $1,400 | $1.33 | 25d | 1 | 1.20mi |
| 2634 Garland Ave Unit A Louisville, KY | 3.0 | 1.0 | 1152 | $940 | $0.82 | 25d | 1 | 1.21mi |
| 2634 Garland Ave Unit B Louisville, KY | 3.0 | 1.0 | 1152 | $895 | $0.78 | 22d | 1 | 1.21mi |
| 2416 Garland Ave Louisville, KY | 3.0 | 2.0 | 1172 | $1,600 | $1.37 | 25d | 1 | 1.21mi |
| 1244 Algonquin Pkwy Louisville, KY | 3.0 | 1.5 | 1136 | $1,400 | $1.23 | 25d | 1 | 1.25mi |
| 3514 Grand Ave Louisville, KY | 3.0 | 1.5 | 1450 | $1,295 | $0.89 | 23d | 1 | 1.27mi |
| 848 S 23rd St Louisville, KY | 3.0 | 1.5 | 1050 | $1,450 | $1.38 | 25d | 1 | 1.32mi |
| 1723 W Kentucky St Unit 3 Louisville, KY | 3.0 | 1.0 | 1200 | $1,300 | $1.08 | 25d | 1 | 1.32mi |
| 820 Hazel St Louisville, KY | 4.0 | 2.0 | 1872 | $1,395 | $0.75 | 4d | 1 | 1.40mi |
| 1161 Lincoln Ave Louisville, KY | 2.0 | 1.5 | 1358 | $1,150 | $0.85 | 17d | 1 | 1.49mi |
| 814 S 33rd St Louisville, KY | 3.0 | 1.0 | 1104 | $1,350 | $1.22 | 5d | 1 | 1.50mi |
Listing history 13 events
-
2026-01-12status Pending
-
2026-01-07historical Active Under Contract
-
2025-12-10price $199,999
-
2025-11-04$210,000 Active
-
2025-05-14soldstatus $70,000 Closed 737-char remark
Show marketing remark (737 chars)
Welcome to your next investment opportunity! This 3 bedroom , 1 bathroom home has been fully gutted and is ready for transformation. Sitting as a blank canvas, this property is ideal for investors, visionaries, or savvy homeowners looking to customize a space to their exact style and specifications. With ample square footage and flexible layout, there is great potential to add an additional bathroom and working spaces increasing both functionality and value. The bones are here , and the possibilities are endless-reimagine this space as a modern family home, a lucrative rental, or your next quick flip. Located in an emerging and commuter friendly neighborhood, this project is perfect for anyone seeking high return on investment.
-
2025-05-14soldstatus $70,000
Show marketing remark (737 chars)
Welcome to your next investment opportunity! This 3 bedroom , 1 bathroom home has been fully gutted and is ready for transformation. Sitting as a blank canvas, this property is ideal for investors, visionaries, or savvy homeowners looking to customize a space to their exact style and specifications. With ample square footage and flexible layout, there is great potential to add an additional bathroom and working spaces increasing both functionality and value. The bones are here , and the possibilities are endless-reimagine this space as a modern family home, a lucrative rental, or your next quick flip. Located in an emerging and commuter friendly neighborhood, this project is perfect for anyone seeking high return on investment.
-
2025-05-12status Pending 737-char remark
Show marketing remark (737 chars)
Welcome to your next investment opportunity! This 3 bedroom , 1 bathroom home has been fully gutted and is ready for transformation. Sitting as a blank canvas, this property is ideal for investors, visionaries, or savvy homeowners looking to customize a space to their exact style and specifications. With ample square footage and flexible layout, there is great potential to add an additional bathroom and working spaces increasing both functionality and value. The bones are here , and the possibilities are endless-reimagine this space as a modern family home, a lucrative rental, or your next quick flip. Located in an emerging and commuter friendly neighborhood, this project is perfect for anyone seeking high return on investment.
-
2025-05-12historical Active Under Contract 737-char remark
Show marketing remark (737 chars)
Welcome to your next investment opportunity! This 3 bedroom , 1 bathroom home has been fully gutted and is ready for transformation. Sitting as a blank canvas, this property is ideal for investors, visionaries, or savvy homeowners looking to customize a space to their exact style and specifications. With ample square footage and flexible layout, there is great potential to add an additional bathroom and working spaces increasing both functionality and value. The bones are here , and the possibilities are endless-reimagine this space as a modern family home, a lucrative rental, or your next quick flip. Located in an emerging and commuter friendly neighborhood, this project is perfect for anyone seeking high return on investment.
-
2025-05-12$80,500 Active 737-char remark
Show marketing remark (737 chars)
Welcome to your next investment opportunity! This 3 bedroom , 1 bathroom home has been fully gutted and is ready for transformation. Sitting as a blank canvas, this property is ideal for investors, visionaries, or savvy homeowners looking to customize a space to their exact style and specifications. With ample square footage and flexible layout, there is great potential to add an additional bathroom and working spaces increasing both functionality and value. The bones are here , and the possibilities are endless-reimagine this space as a modern family home, a lucrative rental, or your next quick flip. Located in an emerging and commuter friendly neighborhood, this project is perfect for anyone seeking high return on investment.
-
2025-05-11historical
-
2025-05-01historical Active Under Contract
-
2025-03-03price $85,500
-
2024-12-11$90,500 Active
ⓘ Source: listings_history table (triggers on properties + properties_extension) + one-shot
backfill from property_details.listing_events for pre-trigger history.
Tax reassessment forecast KY · Resets to sale price
- Current annual tax
- $608 · $51/mo
- Projected year-2 tax
- $1,720 · $143/mo
- Expected delta
- +$1,112/yr (+$93/mo · 182.7%)
ⓘ Screening estimate from a state-policy table — verify with the county assessor before closing.
Climate risk First Street
- Flood 1/10 Low FEMA zone X (unshaded) · 0% chance over 30 yrs
- Wildfire 1/10 Low
- Heat 5/10 Major 7 d/yr ≥104°F today · 19 d/yr by 30 yrs out
- Wind 2/10 Low 100% chance of damaging wind over 30 yrs
- Air quality 2/10 Low 1 unhealthy d/yr today · 3 by 30 yrs out
Nearby sold comps map
Loading sold comps map…
Walkable amenities ~0.75 mi
Loading nearby amenities…
Taxation est. · year 1
- Rental income
- $15,693
- − Mortgage interest
- −$11,203
- − Property taxes
- −$608
- − Insurance
- −$1,000
- − Repairs & maintenance
- −$1,255
- − Management
- −$1,255
- − Depreciation
- −$5,818
- Taxable loss
- −$5,447
- Est. tax savings @ 24.0%
- +$1,307
- After-tax cash flow
- $-489/yr
For passive investors: Depreciation is non-cash, so a rental often shows a tax loss while cash-flowing — sheltering income. Rental losses are passive: they offset passive income freely, and up to $25,000/yr can offset ordinary (W-2) income if you actively participate and your MAGI is under $100k (phasing out to $0 by $150k); unused losses carry forward. On sale, claimed depreciation is recaptured at up to 25%, and gains may owe capital-gains tax (a 1031 exchange can defer both). Figures are a year-1 estimate at your 24.0% rate — not tax advice; consult a CPA.
Schools (NCES district)
- District
- Jefferson County
- NCES district ID
- 2102990
- Math proficiency
- 19% ▼ -17.00%
- Reading proficiency
- 35% ▼ -11.00%
- Median HH income
- $47,885
- Composite
- 23.45/100
- National rank
- #7884
- State rank
- #121 of 165 in KY
Livability — Louisville
- Score
- 63/100
- State rank
- #333
- US rank
- #15887
Category grades
Schools grade is shown separately in the Schools card above.
Census & demographics
- Census place
- Louisville, KY
- County
- Jefferson County · 790,184 people
- City population
- 769,292
- Metro
- Louisville/Jefferson County, KY-IN
- Population (ZIP)
- 13,518
- Household income
- $35,347
- Rent vs Own
- Severe rent burden
- 815.0
Population outlook (Jefferson County) Hauer SSP2
- Today (2025)
- 823,112 people
- By 2030
- 849,343 · +3.2%
- By 2040
- 895,696 · +8.8%
- By 2050
- 933,630 · +13.4%
- By 2075
- 1,028,262 · +24.9%
- By 2100
- 1,072,675 · +30.3%
Race, ethnicity, and origin ACS 2023
- Neighborhood character
- Predominantly Black (84%)
- Race & ethnicity
- Black 84% White 8% Two or more races 5% Hispanic / Latino 3%
- Common ancestry
- Iranian 1%
- Foreign-born
- 4% · Canada
- Languages at home
- 93% English-only · Spanish 3%
Political lean MEDSL · Jefferson
- 2024 margin
- D (+16.6) · D 57.4% · R 40.9% · Other 1.7%
- 2008→2024 swing
- +4.5pp toward D · 2008: 12.0pp · 2024: 16.6pp
- All cycles
- 2024: D+16.6 2020: D+20.1 2016: D+13.3 2012: D+11.1 2008: D+12.0
Not yet ingested
- Civics
- —
Market trends
- HPI YoY
- ▲ 28.45%
- Current HPI
- 264.0146
- Rent YoY
- ▲ 8.05%
- Metro
- Louisville/Jefferson County, KY-IN
- State GDP YoY
- ▲ 1.81%
- F500 in state
- 4
Industry mix (Fortune 500 HQ in KY)
| Industry | F500 HQs | Revenue |
|---|---|---|
| Healthcare | 1 | $118B |
|
||
| Food / Beverage | 1 | $7B |
|
||
Price history
+121.0% since first listed13 events — show timeline
- 2026-01-12 Pending — Metro Search MLS
- 2026-01-07 Contingent — Metro Search MLS
- 2025-12-10 Price Changed $199,999 Metro Search MLS
- 2025-11-04 Listed $210,000 Metro Search MLS
- 2025-05-14 Sold (Public Records) $70,000 Public Records
- 2025-05-14 Sold (MLS) $70,000 Metro Search MLS
- 2025-05-12 Pending — Metro Search MLS
- 2025-05-12 Contingent — Metro Search MLS
- 2025-05-12 Listed $80,500 Metro Search MLS
- 2025-05-11 Listing Removed — Metro Search MLS
- 2025-05-01 Contingent — Metro Search MLS
- 2025-03-03 Price Changed $85,500 Metro Search MLS
- 2024-12-11 Listed $90,500 Metro Search MLS
Property tax history
-1.9%/yrLatest (2025): $608 · -1.9% YoY. Source: county tax records.
Cash-flow waterfall
monthlySold comps — $/sqft
last 12 mo · ≤1 miLoading sold comps…