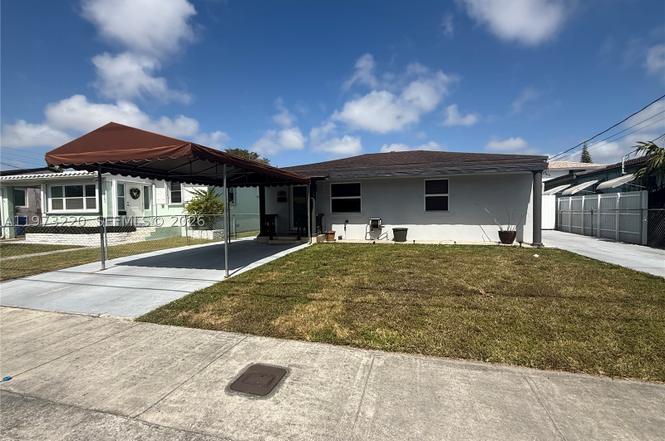
4255 SW 5th Ter · Miami, FL
Flood risk 1/10 · Minimal
- FEMA flood zone
- X (unshaded)
- Chance of flooding over 30 yrs
- 0.0%
- Est. flood insurance / yr
- $507 – $1,088
Fire risk 1/10 · Minimal
- Est. fire insurance / yr
- $947 – $1,759
Heat risk 10/10 · Severe
- Hot days now (above 104°F)
- 7 days/yr
- Hot days in 30 yrs
- 30 days/yr
Wind risk 10/10 · Severe
- Chance of severe wind over 30 yrs
- 99.0%
Air-quality risk 2/10 · Minimal
- Unhealthy air days now
- 1 days/yr
- Unhealthy air days in 30 yrs
- 1 days/yr
Risk factors via First Street. Map © Google.
Why this score? — see what drove the F grade
The composite is a weighted blend of 9 inputs, each scored 0–100. Each bar is that input's sub-score; the figure is the points it added to the 100-point composite (weight × sub-score).
- Cash flow +8.6/30.0
- ARV discount +6.7/15.0
- Schools +4.2/10.0
- Livability +3.9/5.0
- Rent growth +2.7/5.0
- Condition / age +2.5/5.0
- DSCR +2.4/10.0
- 1% rule +1.5/10.0
- Appreciation +0.0/10.0
$629,000
🖨 Deal sheet 📄 Offer letter ✓ Due diligence
Listing remarks
Beautiful 3/2 home in a desirable neighborhood! This home features a recently remodeled kitchen with modern finishes and an electrical panel for added peace of mind. Relax in the main bathroom complete with a jacuzzi tub. Enjoy a fully fenced yard- perfect for pets, entertaining or added privacy. Conveniently located near major highways, with easy access to the airport, Miami Beach, Downtown Miami, and all the major highways. Move-in ready and centrally located. Oner motivated and sill help with $3000 towards closing costs.
Key facts
- Remodeled kitchen
- Fully fenced yard
- Jacuzzi tub
Tags
Property features AI
Finance
- Other: Insulation (energy efficient feature); Lot is less than a quarter acre and located on a city street
- Financial info: No pet restrictions (pets allowed)
Exterior
- Parking: Covered parking (1 space); Carport (1 space); Driveway; Parking pad; On-street parking
- Security: Security/high impact doors; Storm/security shutters
- Utilities: Public water; Septic tank
- Home design: Single-story; South-facing; Updated/remodeled
- Construction: Block construction; Shingle roof; Resale property
- Exterior features: Awning(s); Deck; Patio; Fence; Shed; Outdoor lighting; Storm/security shutters; Security/high impact doors
Interior
- Kitchen: Electric range; Self-cleaning oven; Refrigerator; Disposal
- Flooring: Ceramic tile
- Bathrooms: Two full bathrooms
- Heating & cooling: Central heating; Central air conditioning; Ceiling fans
- Interior features: Impact glass windows; Bedroom on main level; Dining area and separate/formal dining room; First-floor entry; Jetted tub; Tub/shower combination; Kitchen/dining combo; Family room; Storage room
- Laundry & utility: Washer; Dryer; Electric water heater
Neighborhood map
What this means for you Summary
Snapshot
- This is a 2-bed/1.0-bath single-family listed at $629k.
Deal economics
- At list price, monthly cash flow is $-538 ($-6k/yr) — negative.
- To cash-flow at today's rent, offer at most $534k (15.1% below list).
- To meet the 1% rule (rent ≥ 1% of price), the offer needs to be $408k (35.2% below list).
- Recommended offer: $408k (35.2% below list) — sets the bar for 1% rule.
- Cap rate 5.3% vs local median 1.9% in Miami — top-decile yield for the area; either an underpriced asset or a hidden risk that comps aren't pricing in. Stress-test before assuming the spread holds.
Location & tenants
- Location reads 78/100 on livability (#177 in FL, #2,724 nationally) — a middle-class / working-renter tenant base. Strengths: amenities A+, commute A+, health & safety A+; Watch: employment C-, crime F, cost of living F.
- Miami-Dade (suburban): math 45% / reading 54% proficiency, ranked #40 of 73 in FL (top 55%) — families likely to look elsewhere, expect single-tenant / working-renter base with shorter leases; 64% free/reduced lunch — lower-income household profile, screen leases tightly.
- Market conditions: Rents flat; 304 active listings in the ZIP; 1 comparable units currently listed for rent nearby; solid renter incomes; 10,051 units permitted in Miami-Dade County in 2024 (7,758 in 5+ unit buildings).
- At $4,077/mo this rent would consume 49% of the median local household income ($100k/yr) (locally 1812% of renters already pay >50% of income on rent) — very limited rent-growth headroom before tenants either downsize or default.
Forward outlook
- Local home prices are declining (-3.0%/yr); year-one equity from $4k of loan paydown is wiped out by about $19k of value loss. Plan a longer hold.
- Miami-Dade County population projected at +28% by 2050 — long-run rental-demand tailwind backs the buy-and-hold thesis.
Negotiation context
- It's been on market 74 days — a 6% lower offer ($591k) is reasonable based on typical stale-listing flexibility.
- Current owner paid $25k; list at $629k implies a 2416% gain — meaningful room to come down on a strong offer.
Risks & watch-outs
- Watch-outs: built in 1947 — expect roof / HVAC / electrical / plumbing capex.
- Climate carrying-cost: severe wind risk, 99% chance of damaging wind over 30y; extreme-heat days projected 7→30/yr by 2055 (HVAC capex compounding) — expect insurance premiums to compound above CPI over the hold.
Questions for the listing agent
- What do current leases actually rent for vs. the listed asking? Can we see a recent rent roll and the last 12 months of T-12 income?
- It's been on market 74 days. Have you received any prior offers? Is the seller open to a 35% concession, seller financing, or rate buy-down credit?
- Built in 1947 — when were the roof, HVAC, electrical panel, plumbing, and water heater last replaced?
- Why hasn't it sold? Are there any deal-killer items the seller is aware of (foundation, flood, title, zoning, code violations)?
- Is there a deadline driving the sale (1031 exchange, divorce, estate, relocation)? That informs how much negotiation room exists.
- Schools are B-rated — typically a magnet for longer-tenancy family renters. What's the average tenant stay here, and is there a school-zone premium baked into asking?
- Crime grade is F in this area — have there been break-ins, vandalism, or insurance claims at this property in the last 3 years? What carrier currently insures it and at what premium?
- The area grade is low — what's the realistic commute time and amenity access for the typical tenant pool here? Any planned neighborhood developments (good or bad) we should know about?
- What's the average days-on-market for RENTAL listings here right now (not sales)? A rising rental-DOM trend means longer vacancies and softer asking-rent achievability than the comps imply.
- What's the recent tenant-quality profile in this submarket — average credit score on applications, eviction rate, late-payment / NSF rate, and stable-employment percentage? A property-management company in the area should have these aggregated.
- How much new for-sale + rental construction is in the pipeline within 1–3 miles? Heavy new supply typically softens prices + rents 12–24 months out; constrained supply supports both.
Investment metrics
- 1% rule
- 0.65% ✗
- Cap rate
- 5.27%
- Cash-on-cash
- -3.66%
- DSCR
- 0.84
- GRM
- 12.9
CMA / ARV
- ARV (on-the-fly)
- $618,025
- Comps found
- 3
Show comp detail 3 sales within ~0.75 mi
| Address | Dist | Beds/Ba | Sqft | Sold | Price | $/sf | Match |
|---|---|---|---|---|---|---|---|
| 561 SW 48th Ave | 0.55mi | 3/2.5 (+1) | 1,504 (+2%) | 20mo | $630,000 | $419 | 43 |
| 3610 SW 5th St | 0.69mi | 2/1.0 | 1,318 (-11%) | 15mo | $530,000 | $402 | 38 |
| 3921 SW 4th St | 0.31mi | 3/2.0 (+1) | 1,657 (+12%) | 23mo | $699,900 | $422 | 37 |
Match score weights: distance 35% · size 25% · config 20% · recency 20%. Top-matched comps best support the ARV.
Projected returns pro-forma
-3.0% appreciation · 0.92% rent growth · sell at horizon
- IRR
- -24.5%
- Equity multiple
- 0.18×
- Total profit
- $-144,831
- Equity at exit
- $93,786
- IRR
- -26.2%
- Equity multiple
- -0.16×
- Total profit
- $-204,332
- Equity at exit
- $54,384
Cash invested: $176,120 (down + closing). Projections, not guarantees.
Landlord ↔ Tenant lean methodology
- Overall (STATE)
- 87 Strongly Landlord-Friendly
- State Florida
- 87 Strongly Landlord-Friendly · R+3
- County
- — inherits STATE
- City
- — inherits STATE
ZIP-level market 33134
- Rents YoY
- 0.9%
- Active inventory
- 304
- Price-to-rent
- 12.9×
Monthly cashflow live
- Estimated rent
- $4,077 medium interval (Pro) →
- Mortgage (P&I)
- −$3,299
- Tax from tax record
- −$198 /mo · $2,374/yr
- Insurance
- −$262
- HOA
- −$0
- Vacancy / Maint / Mgmt
- −$856
- Net cashflow
- $-538
Break-even live
UW: 25.0% down · 7.5% · 30yr · 1.5% tax · 5.0% vac · 8.0% maint · 8.0% mgmt
Financing live
Cash to close
- Down payment
- $157,250
- Closing costs
- $18,870
- Reserves months
- —
- Total cash needed
- —
Loan-product check · same deal, 3 products live
Conventional
25% down · 7.5% · 30yr
- Down + closing
- —
- Monthly P&I
- —
- Monthly cashflow
- —
- DSCR
- —
- Eligible?
- —
Personal DTI + credit; lowest rate.
DSCR
20% down · 8.5% · 30yr
- Down + closing
- —
- Monthly P&I
- —
- Monthly cashflow
- —
- DSCR
- —
- Eligible?
- —
No personal income docs; deal must DSCR.
Hard money
10% down · 12.0% · 12mo
- Down + closing
- —
- Monthly P&I
- —
- Monthly cashflow
- —
- DSCR
- —
- Eligible?
- —
Short-term bridge; refi at stabilization.
Rent comps 1 comps
| Address | Beds | Baths | Sqft | Rent | $/sqft | DOM | Units | Dist |
|---|---|---|---|---|---|---|---|---|
| 2601 Salzedo St Coral Gables, FL | 2.0–3.0 | 2.5–4.5 | 2236 | $8,200 | $3.67 | 2d | 78 | 1.40mi |
Listing history 6 events
-
2026-05-12status Pending
-
2026-05-04historical Active Under Contract
-
2026-04-06price $629,000
-
2026-03-16price $669,000
-
2026-02-25$698,000 Active
-
1973-05-01soldstatus $25,000
ⓘ Source: listings_history table (triggers on properties + properties_extension) + one-shot
backfill from property_details.listing_events for pre-trigger history.
Tax reassessment forecast FL · Resets to sale price
- Current annual tax
- $2,374 · $198/mo
- Projected year-2 tax
- $5,221 · $435/mo
- Expected delta
- +$2,846/yr (+$237/mo · 119.9%)
ⓘ Screening estimate from a state-policy table — verify with the county assessor before closing.
Climate risk First Street
- Flood 1/10 Low FEMA zone X (unshaded) · 0% chance over 30 yrs
- Wildfire 1/10 Low
- Heat 10/10 Extreme 7 d/yr ≥104°F today · 30 d/yr by 30 yrs out
- Wind 10/10 Extreme 99% chance of damaging wind over 30 yrs
- Air quality 2/10 Low 1 unhealthy d/yr today · 1 by 30 yrs out
Nearby sold comps map
Loading sold comps map…
Walkable amenities ~0.75 mi
Loading nearby amenities…
Taxation est. · year 1
- Rental income
- $48,923
- − Mortgage interest
- −$35,234
- − Property taxes
- −$2,374
- − Insurance
- −$3,145
- − Repairs & maintenance
- −$3,914
- − Management
- −$3,914
- − Depreciation
- −$18,298
- Taxable loss
- −$17,956
- Est. tax savings @ 24.0%
- +$4,309
- After-tax cash flow
- $-2,143/yr
For passive investors: Depreciation is non-cash, so a rental often shows a tax loss while cash-flowing — sheltering income. Rental losses are passive: they offset passive income freely, and up to $25,000/yr can offset ordinary (W-2) income if you actively participate and your MAGI is under $100k (phasing out to $0 by $150k); unused losses carry forward. On sale, claimed depreciation is recaptured at up to 25%, and gains may owe capital-gains tax (a 1031 exchange can defer both). Figures are a year-1 estimate at your 24.0% rate — not tax advice; consult a CPA.
Schools (NCES district)
- District
- Miami-Dade
- NCES district ID
- 1200390
- Math proficiency
- 45% ▼ -16.00%
- Reading proficiency
- 54% ▼ -5.00%
- Median HH income
- $43,928
- Composite
- 41.76/100
- National rank
- #3397
- State rank
- #40 of 73 in FL
Livability — Miami
- Score
- 78/100
- State rank
- #177
- US rank
- #2724
Category grades
Schools grade is shown separately in the Schools card above.
Census & demographics
- Census place
- Miami, FL
- County
- Miami-Dade County · 2,697,751 people
- City population
- 827,308
- Metro
- Miami-Fort Lauderdale-Pompano Beach, FL
- Population (ZIP)
- 38,174
- Household income
- $99,766
- Rent vs Own
- Severe rent burden
- 1812.0
Population outlook (Miami-Dade County) Hauer SSP2
- Today (2025)
- 3,126,439 people
- By 2030
- 3,325,765 · +6.4%
- By 2040
- 3,697,561 · +18.3%
- By 2050
- 4,012,134 · +28.3%
- By 2075
- 4,605,612 · +47.3%
- By 2100
- 4,866,598 · +55.7%
Race, ethnicity, and origin ACS 2023
- Neighborhood character
- Predominantly Hispanic (75%)
- Race & ethnicity
- Hispanic / Latino 75% Two or more races 45% White 21% Asian 1%
- Hispanic origin (detail)
- Mexican 3% Puerto Rican 2% Cuban 41% Dominican 1% Salvadoran 2%
- Common ancestry
- Lithuanian 2% Russian 2% Romanian 1%
- Foreign-born
- 55% · Canada, Jamaica, Dominican Republic
- Languages at home
- 22% English-only · Spanish 71% Other Indo-European 4% French/Haitian/Cajun 1%
Political lean MEDSL · Miami-Dade
- 2024 margin
- R (+11.4) · D 43.9% · R 55.4%
- 2008→2024 swing
- -27.6pp toward R · 2008: 16.1pp · 2024: -11.4pp
- All cycles
- 2024: R+11.4 2020: D+7.3 2016: D+29.6 2012: D+23.7 2008: D+16.1
Not yet ingested
- Civics
- —
Market trends
- HPI YoY
- ▼ -1014.50%
- Current HPI
- 402.6405
- Rent YoY
- ▲ 0.92%
- Metro
- Miami-Fort Lauderdale-Pompano Beach, FL
- State GDP YoY
- ▲ 3.28%
- F500 in state
- 36
Industry mix (Fortune 500 HQ in FL)
| Industry | F500 HQs | Revenue |
|---|---|---|
| Industrial Technology | 2 | $29B |
|
||
| Insurance | 2 | $17B |
|
||
| Retail | 1 | $60B |
|
||
| Technology Distribution | 1 | $58B |
|
||
| Homebuilding | 1 | $35B |
|
||
| Technology Manufacturing | 1 | $35B |
|
||
Price history
+2416.0% since first listed6 events — show timeline
- 2026-05-12 Pending — MARMLS
- 2026-05-04 Contingent — MARMLS
- 2026-04-06 Price Changed $629,000 MARMLS
- 2026-03-16 Price Changed $669,000 MARMLS
- 2026-02-25 Listed $698,000 MARMLS
- 1973-05-01 Sold (Public Records) $25,000 Public Records
Property tax history
+2.0%/yrLatest (2025): $2,374 · +2.9% YoY. Source: county tax records.
Cash-flow waterfall
monthlySold comps — $/sqft
last 12 mo · ≤1 miLoading sold comps…