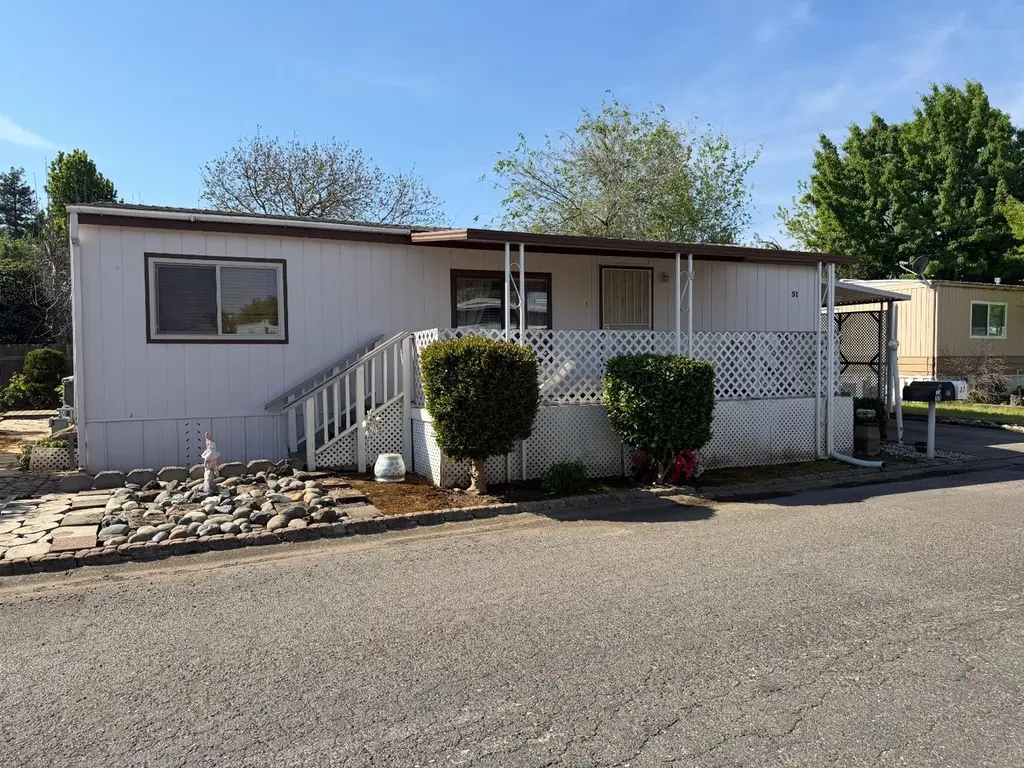
2160 Live Oak Blvd #31 · Yuba City, CA
Flood risk 1/10 · Minimal
- FEMA flood zone
- X
- Chance of flooding over 30 yrs
- 0.0%
- Est. flood insurance / yr
- $507 – $1,088
Fire risk 7/10 · Major
- Est. fire insurance / yr
- $659 – $1,223
Heat risk 7/10 · Major
- Hot days now (above 105°F)
- 7 days/yr
- Hot days in 30 yrs
- 16 days/yr
Wind risk 1/10 · Minimal
- Chance of severe wind over 30 yrs
- —
Air-quality risk 10/10 · Severe
- Unhealthy air days now
- 28 days/yr
- Unhealthy air days in 30 yrs
- 32 days/yr
Risk factors via First Street. Map © Google.
Why this score? — see what drove the B+ grade
The composite is a weighted blend of 9 inputs, each scored 0–100. Each bar is that input's sub-score; the figure is the points it added to the 100-point composite (weight × sub-score).
- Cash flow +30.0/30.0
- ARV discount +15.0/15.0
- 1% rule +10.0/10.0
- DSCR +10.0/10.0
- Livability +3.8/5.0
- Schools +3.2/10.0
- Rent growth +2.9/5.0
- Condition / age +2.5/5.0
- Appreciation +0.0/10.0
$85,000
🖨 Deal sheet 📄 Offer letter ✓ Due diligence
Listing remarks
Situated at 2160 Live Oak Blvd #31 in Yuba City, this inviting mobile home is perfect for those who love to personalize and elevate their living space. The kitchen is a standout featurebright and functional with a distinctive wood accent wall that adds warmth and character, a convenient peninsula for additional workspace and seating, and a stylish backsplash that ties it all together beautifully. The master bedroom offers a cozy and welcoming retreat, designed with unique touches that create a comfortable and relaxing atmosphere. Step outside and enjoy multiple outdoor living spaces, including a charming front porch, a spacious deck, and a private balcony ideal for relaxing, entertaining, o
Key facts
- Private balcony
- Front porch
- Spacious deck
Tags
Neighborhood map
What this means for you Summary
Snapshot
- This is a 3-bed/2.0-bath manufactured listed at $85k.
Deal economics
- At list price, monthly cash flow is $974 ($12k/yr) — positive.
- The deal already cash-flows at list — no discount required.
- Meets the 1% rule at list price ($2k rent vs $85k).
- Recommended offer: $80k (6.0% below list) — sets the bar for market timing.
- Cap rate 20.0% vs local median 3.6% in Yuba City — top-decile yield for the area; either an underpriced asset or a hidden risk that comps aren't pricing in. Stress-test before assuming the spread holds.
Location & tenants
- Location reads 75/100 on livability (#111 in CA, #3,863 nationally) — a middle-class / working-renter tenant base. Strengths: commute A+, housing A+, health & safety A+; Watch: crime D+, schools D, cost of living F.
- Yuba City Unified (urban): math 20% / reading 53% proficiency, ranked #263 of 517 in CA (top 51%) — families likely to look elsewhere, expect single-tenant / working-renter base with shorter leases.
- Market conditions: Rents rising (+1.8%/yr); 149 active listings in the ZIP; 22 comparable units currently listed for rent nearby; rentals at typical pace (median 21d on market — plan ~3-4 weeks tenant-placement turnaround); 73 units permitted in Sutter County in 2024 (0 in 5+ unit buildings).
- This rent runs 32% of the median local income ($71k/yr) — at the standard rent-burdened threshold; future hikes will face affordability resistance.
Forward outlook
- Local home prices are declining (-3.0%/yr); year-one equity from $588 of loan paydown is wiped out by about $3k of value loss. Plan a longer hold.
- Sutter County population projected to shrink 4% by 2050 — rents likely to lag national; underwrite the cash flow, not the appreciation.
- At projected returns (-3.0% appreciation + 1.8% rent growth), your $24k cash investment doubles in ~3 years — after that, you're playing with house money.
Negotiation context
- It's been on market 69 days — a 6% lower offer ($80k) is reasonable based on typical stale-listing flexibility.
Risks & watch-outs
- Climate carrying-cost: major wildfire risk; extreme-heat days projected 7→16/yr by 2055 (HVAC capex compounding) — expect insurance premiums to compound above CPI over the hold.
Questions for the listing agent
- It's been on market 69 days. Have you received any prior offers? Is the seller open to a 6% concession, seller financing, or rate buy-down credit?
- Why hasn't it sold? Are there any deal-killer items the seller is aware of (foundation, flood, title, zoning, code violations)?
- Is there a deadline driving the sale (1031 exchange, divorce, estate, relocation)? That informs how much negotiation room exists.
- Schools are D-rated, which usually means shorter tenancies and higher turnover. Who's the typical renter profile here, and what's been the actual vacancy rate?
- Crime grade is D in this area — have there been break-ins, vandalism, or insurance claims at this property in the last 3 years? What carrier currently insures it and at what premium?
- What's the average days-on-market for RENTAL listings here right now (not sales)? A rising rental-DOM trend means longer vacancies and softer asking-rent achievability than the comps imply.
- What's the recent tenant-quality profile in this submarket — average credit score on applications, eviction rate, late-payment / NSF rate, and stable-employment percentage? A property-management company in the area should have these aggregated.
- How much new for-sale + rental construction is in the pipeline within 1–3 miles? Heavy new supply typically softens prices + rents 12–24 months out; constrained supply supports both.
Investment metrics
- 1% rule
- 2.21% ✓
- Cap rate
- 20.05%
- Cash-on-cash
- 49.12%
- DSCR
- 3.19
- GRM
- 3.8
CMA / ARV
- ARV (median comp)
- $108,503
- List price
- $85,000
- Delta
- -21.66%
- Verdict
- UNDERPRICED
- Comps
- 16 within 2.0 mi
Show comp detail 1 sale within ~0.75 mi
| Address | Dist | Beds/Ba | Sqft | Sold | Price | $/sf | Match |
|---|---|---|---|---|---|---|---|
| 2160 Live Oak Blvd #60 | 0.00mi | 2/1.5 (-1) | 924 (-14%) | 10mo | $57,500 | $62 | 60 |
Match score weights: distance 35% · size 25% · config 20% · recency 20%. Top-matched comps best support the ARV.
Projected returns pro-forma
-3.0% appreciation · 1.79% rent growth · sell at horizon
- IRR
- 45.4%
- Equity multiple
- 2.93×
- Total profit
- $45,996
- Equity at exit
- $12,674
- IRR
- 50.7%
- Equity multiple
- 5.66×
- Total profit
- $110,818
- Equity at exit
- $7,349
Cash invested: $23,800 (down + closing). Projections, not guarantees.
Landlord ↔ Tenant lean methodology
- Overall (STATE)
- 18 Strongly Tenant-Friendly
- State California
- 18 Strongly Tenant-Friendly · D+13
- County
- — inherits STATE
- City
- — inherits STATE
ZIP-level market 95991
- Rents YoY
- 1.8%
- Active inventory
- 149
- Price-to-rent
- 3.8×
Monthly cashflow live
- Estimated rent
- $1,880 high interval (Pro) →
- Mortgage (P&I)
- −$446
- Tax from tax record
- −$30 /mo · $355/yr
- Insurance
- −$35
- HOA
- −$0
- Vacancy / Maint / Mgmt
- −$395
- Net cashflow
- $974
Break-even live
UW: 25.0% down · 7.5% · 30yr · 1.5% tax · 5.0% vac · 8.0% maint · 8.0% mgmt
Financing live
Cash to close
- Down payment
- $21,250
- Closing costs
- $2,550
- Reserves months
- —
- Total cash needed
- —
Loan-product check · same deal, 3 products live
Conventional
25% down · 7.5% · 30yr
- Down + closing
- —
- Monthly P&I
- —
- Monthly cashflow
- —
- DSCR
- —
- Eligible?
- —
Personal DTI + credit; lowest rate.
DSCR
20% down · 8.5% · 30yr
- Down + closing
- —
- Monthly P&I
- —
- Monthly cashflow
- —
- DSCR
- —
- Eligible?
- —
No personal income docs; deal must DSCR.
Hard money
10% down · 12.0% · 12mo
- Down + closing
- —
- Monthly P&I
- —
- Monthly cashflow
- —
- DSCR
- —
- Eligible?
- —
Short-term bridge; refi at stabilization.
Rent comps 22 comps
| Address | Beds | Baths | Sqft | Rent | $/sqft | DOM | Units | Dist |
|---|---|---|---|---|---|---|---|---|
| 1722 Clark Ave Yuba City, CA | 3.0 | 2.0 | 1479 | $2,500 | $1.69 | 20d | 1 | 0.24mi |
| 1518 Upland Dr Unit 1518 Yuba City, CA | 2.0 | 1.0 | 1084 | $1,900 | $1.75 | 43d | 1 | 0.41mi |
| 1475 Knights Row Yuba City, CA | 4.0 | 2.0 | 1171 | $2,279 | $1.95 | 20d | 1 | 0.48mi |
| 345 Grant Way Unit 22 Yuba City, CA | 2.0 | 1.0 | 900 | $1,395 | $1.55 | 13d | 1 | 0.49mi |
| 1138 Forestwood Dr Yuba City, CA | 2.0 | 2.0 | 964 | $2,025 | $2.10 | 20d | 1 | 0.51mi |
| 1199 Casita Dr #1 Yuba City, CA | 2.0 | 1.0 | 896 | $1,500 | $1.67 | 20d | 1 | 0.59mi |
| 1188 Casita Dr Yuba City, CA | 2.0 | 1.0 | 840 | $1,399 | $1.67 | 43d | 1 | 0.59mi |
| 1171 Kenny Dr Yuba City, CA | 2.0 | 1.0 | 900 | $1,500 | $1.67 | 43d | 1 | 0.60mi |
| 1171 Kenny Dr Unit 10 Yuba City, CA | 2.0 | 1.0 | 900 | $1,375 | $1.53 | 43d | 1 | 0.60mi |
| 1250 Melton Dr Yuba City, CA | 1.0–2.0 | 1.0 | 646 | $1,300 | $2.01 | 13d | 2 | 0.64mi |
| 1290 Northgate Dr Unit 81 Yuba City, CA | 2.0 | 2.0 | 941 | $1,500 | $1.59 | 43d | 1 | 0.66mi |
| 1290 Northgate Dr Unit 28 Yuba City, CA | 2.0 | 1.0 | 872 | $1,450 | $1.66 | 20d | 1 | 0.68mi |
| 515 Ohlson St Yuba City, CA | 3.0 | 2.0 | 1337 | $2,300 | $1.72 | 13d | 1 | 0.76mi |
| 330 Bird St Yuba City, CA | 2.0 | 1.0 | 806 | $1,495 | $1.85 | 13d | 1 | 0.89mi |
| 401 Ainsley Ave Yuba City, CA | 2.0 | 1.0 | 1080 | $1,900 | $1.76 | 43d | 1 | 0.91mi |
| 1431 Mirada Cir Yuba City, CA | 3.0 | 2.0 | 1370 | $2,400 | $1.75 | 20d | 1 | 1.14mi |
| 1351 Dustin Dr Unit 45 Yuba City, CA | 2.0 | 1.0 | 750 | $1,400 | $1.87 | 43d | 1 | 1.15mi |
| 1341 Dustin Dr Yuba City, CA | 2.0 | 1.0 | 750 | $1,650 | $2.20 | 13d | 4 | 1.21mi |
| 1574 Heather Dr Unit 206 Yuba City, CA | 2.0 | 1.0 | 1005 | $1,650 | $1.64 | 20d | 1 | 1.21mi |
| 1575 Heather Dr Unit 1445 Yuba City, CA | 2.0 | 1.0 | 800 | $1,600 | $2.00 | 20d | 1 | 1.24mi |
| 725 Kiley Ave Yuba City, CA | 2.0 | 2.0 | 1124 | $1,950 | $1.73 | 20d | 1 | 1.36mi |
| 1311 Lemon St Marysville, CA | 2.0 | 1.0 | 738 | $1,550 | $2.10 | 20d | 1 | 1.47mi |
Listing history 17 events
-
2026-06-19days on market $85,000 Active 69 DOM
-
2026-06-18days on market $85,000 Active 68 DOM
-
2026-06-17days on market $85,000 Active 67 DOM
-
2026-06-16days on market $85,000 Active 66 DOM
-
2026-06-15days on market $85,000 Active 65 DOM
-
2026-06-14days on market $85,000 Active 63 DOM
-
2026-06-13days on market $85,000 Active 62 DOM
-
2026-06-10days on market $85,000 Active 60 DOM
-
2026-06-09days on market $85,000 Active 59 DOM
-
2026-06-08days on market $85,000 Active 58 DOM
-
2026-06-07days on market $85,000 Active 57 DOM
-
2026-06-05days on market $85,000 Active 54 DOM
-
2026-06-03days on market $85,000 Active 53 DOM
-
2026-06-02days on market $85,000 Active 52 DOM
-
2026-06-01days on market $85,000 Active 51 DOM
-
2026-05-31days on market $85,000 Active 50 DOM
-
2026-05-30days on market $85,000 Active 49 DOM
ⓘ Source: listings_history table (triggers on properties + properties_extension) + one-shot
backfill from property_details.listing_events for pre-trigger history.
Tax reassessment forecast CA · Resets to sale price
- Current annual tax
- $355 · $30/mo
- Projected year-2 tax
- $646 · $54/mo
- Expected delta
- +$291/yr (+$24/mo · 81.7%)
ⓘ Screening estimate from a state-policy table — verify with the county assessor before closing.
Climate risk First Street
- Flood 1/10 Low FEMA zone X · 0% chance over 30 yrs
- Wildfire 7/10 Severe
- Heat 7/10 Severe 7 d/yr ≥105°F today · 16 d/yr by 30 yrs out
- Wind 1/10 Low
- Air quality 10/10 Extreme 28 unhealthy d/yr today · 32 by 30 yrs out
Nearby sold comps map
Loading sold comps map…
Walkable amenities ~0.75 mi
Loading nearby amenities…
Taxation est. · year 1
- Rental income
- $22,557
- − Mortgage interest
- −$4,761
- − Property taxes
- −$355
- − Insurance
- −$425
- − Repairs & maintenance
- −$1,805
- − Management
- −$1,805
- − Depreciation
- −$2,473
- Taxable income
- $10,934
- Est. tax owed @ 24.0%
- −$2,624
- After-tax cash flow
- $9,067/yr
For passive investors: Depreciation is non-cash, so a rental often shows a tax loss while cash-flowing — sheltering income. Rental losses are passive: they offset passive income freely, and up to $25,000/yr can offset ordinary (W-2) income if you actively participate and your MAGI is under $100k (phasing out to $0 by $150k); unused losses carry forward. On sale, claimed depreciation is recaptured at up to 25%, and gains may owe capital-gains tax (a 1031 exchange can defer both). Figures are a year-1 estimate at your 24.0% rate — not tax advice; consult a CPA.
Schools (NCES district)
- District
- Yuba City Unified
- NCES district ID
- 0643470
- Math proficiency
- 20% ▼ -10.00%
- Reading proficiency
- 53% ▲ 5.00%
- Median HH income
- $50,923
- Composite
- 31.55/100
- National rank
- #5956
- State rank
- #263 of 517 in CA
Livability — Yuba City
- Score
- 75/100
- State rank
- #111
- US rank
- #3863
Category grades
Schools grade is shown separately in the Schools card above.
Census & demographics
- Census place
- Yuba City, CA
- County
- Sutter County · 81,625 people
- City population
- 81,625
- Metro
- Yuba City, CA
- Population (ZIP)
- 42,579
- Household income
- $70,590
- Rent vs Own
- Severe rent burden
- 1674.0
Population outlook (Sutter County) Hauer SSP2
- Today (2025)
- 97,244 people
- By 2030
- 97,170 · -0.1%
- By 2040
- 96,137 · -1.1%
- By 2050
- 93,604 · -3.7%
- By 2075
- 85,008 · -12.6%
- By 2100
- 71,584 · -26.4%
Race, ethnicity, and origin ACS 2023
- Neighborhood character
- Diverse neighborhood (Simpson 0.68)
- Race & ethnicity
- Hispanic / Latino 41% White 37% Two or more races 19% Asian 12% Black 2% Native American 2%
- Hispanic origin (detail)
- Mexican 36% Puerto Rican 2%
- Common ancestry
- Slovak 2% Russian 1% Portuguese 1%
- Foreign-born
- 24% · Canada, Jamaica
- Languages at home
- 60% English-only · Spanish 28% Other Indo-European 10% Other Asian/Pacific 1%
Political lean MEDSL · Sutter
- 2024 margin
- Solid R (+31.4) · D 33.1% · R 64.5% · Other 2.4%
- 2008→2024 swing
- -14.7pp toward R · 2008: -16.7pp · 2024: -31.4pp
- All cycles
- 2024: R+31.4 2020: R+16.4 2016: R+16.3 2012: R+21.8 2008: R+16.7
Not yet ingested
- Civics
- —
Market trends
- HPI YoY
- ▼ -343.11%
- Current HPI
- 240.3835
- Rent YoY
- ▲ 1.79%
- Metro
- Yuba City, CA
- State GDP YoY
- ▲ 3.21%
- F500 in state
- 116
Industry mix (Fortune 500 HQ in CA)
| Industry | F500 HQs | Revenue |
|---|---|---|
| Technology | 27 | $1,492B |
|
||
| Financial Services | 3 | $174B |
|
||
| Retail | 3 | $44B |
|
||
| Insurance | 3 | $26B |
|
||
| Media / Entertainment | 2 | $115B |
|
||
| Pharmaceuticals / Biotech | 2 | $62B |
|
||
Property tax history
+7.8%/yrLatest (2025): $355 · +4.5% YoY. Source: county tax records.
Cash-flow waterfall
monthlySold comps — $/sqft
last 12 mo · ≤1 miLoading sold comps…