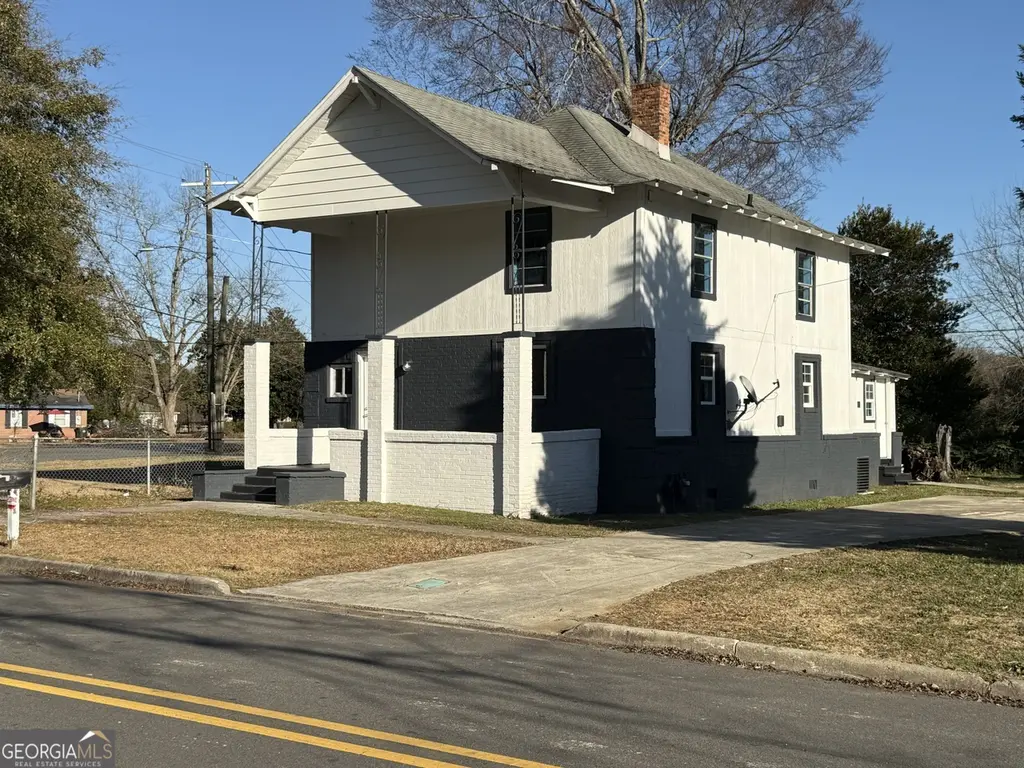
803 Pine St · Fort Valley, GA
Flood risk 1/10 · Minimal
- FEMA flood zone
- X (unshaded)
- Chance of flooding over 30 yrs
- 0.0%
- Est. flood insurance / yr
- $507 – $1,088
Fire risk 4/10 · Minor
- Est. fire insurance / yr
- $963 – $1,789
Heat risk 7/10 · Major
- Hot days now (above 107°F)
- 7 days/yr
- Hot days in 30 yrs
- 18 days/yr
Wind risk 8/10 · Major
- Chance of severe wind over 30 yrs
- 80.0%
Air-quality risk 2/10 · Minimal
- Unhealthy air days now
- 2 days/yr
- Unhealthy air days in 30 yrs
- 2 days/yr
Risk factors via First Street. Map © Google.
Why this score? — see what drove the B grade
The composite is a weighted blend of 9 inputs, each scored 0–100. Each bar is that input's sub-score; the figure is the points it added to the 100-point composite (weight × sub-score).
- Cash flow +28.7/30.0
- ARV discount +15.0/15.0
- DSCR +10.0/10.0
- 1% rule +7.6/10.0
- Livability +3.2/5.0
- Rent growth +2.5/5.0
- Condition / age +2.5/5.0
- Schools +1.8/10.0
- Appreciation +0.0/10.0
$107,500
🖨 Deal sheet 📄 Offer letter ✓ Due diligence
Listing remarks MLS
Come to Georgia's very own Peach Capital City in the seat of Peach County, before prices grow too big. Centrally located in town, with easy access to Bluebird and Fort Valley State University. Updated and ready to move in. All kinds of possibilities with its covered 2-story front porch, 4 large bedrooms and 3 bathrooms. Expansive main level foyer / hallway and upstairs landing area. Excellent space separation, including a laundry room with an exterior driveway access door and plenty of parking. New HVAC, duct work, bathrooms, paint, flooring and fixtures. Stop paying crazy rent or just add it to your rental portfolio.--
Key facts
- New hvac
- New duct work
- Centrally located
Tags
Neighborhood map
What this means for you Summary
Snapshot
- This is a 3-bed/2.0-bath single-family listed at $108k.
Deal economics
- At list price, monthly cash flow is $360 ($4k/yr) — positive.
- The deal already cash-flows at list — no discount required.
- Meets the 1% rule at list price ($1k rent vs $108k).
- Recommended offer: $95k (12.0% below list) — sets the bar for market timing.
- Cap rate 10.3% vs local median 5.7% in Fort Valley — top-decile yield for the area; either an underpriced asset or a hidden risk that comps aren't pricing in. Stress-test before assuming the spread holds.
Location & tenants
- Location reads 65/100 on livability (#220 in GA) — a middle-class / working-renter tenant base. Strengths: cost of living A+, health & safety A+, housing A-; Watch: crime D+, schools F, amenities F.
- Peach County (rural): math 17% / reading 25% proficiency, ranked #141 of 174 in GA (top 81%) — low school quality limits family demand, transient renter base, plan for 1-2y turnover; 65% free/reduced lunch — lower-income household profile, screen leases tightly.
- Market conditions: 116 active listings in the ZIP; 5 comparable units currently listed for rent nearby; rentals leasing fast (median 13d on market — plan ~1-2 weeks tenant-placement turnaround); 149 units permitted in Peach County in 2024 (0 in 5+ unit buildings).
Forward outlook
- Local home prices are declining (-3.0%/yr); year-one equity from $743 of loan paydown is wiped out by about $3k of value loss. Plan a longer hold.
- Peach County population projected at -18% by 2050 — secular population decline; favor cash flow + early exit over multi-decade hold.
- At projected returns (-3.0% appreciation + 3.0% rent growth), your $30k cash investment doubles in ~9 years — after that, you're playing with house money.
Negotiation context
- It's been on market 127 days — a 12% lower offer ($95k) is reasonable based on typical stale-listing flexibility.
- 2 sale attempts; this cycle's ask has dropped $12k (10%) from the opening price — seller is motivated, your offer sets the floor, not the list.
Risks & watch-outs
- Watch-outs: built in 1945 — expect roof / HVAC / electrical / plumbing capex.
- Climate carrying-cost: severe wind risk, 80% chance of damaging wind over 30y; extreme-heat days projected 7→18/yr by 2055 (HVAC capex compounding) — expect insurance premiums to compound above CPI over the hold.
Questions for the listing agent
- It's been on market 127 days. Have you received any prior offers? Is the seller open to a 12% concession, seller financing, or rate buy-down credit?
- Built in 1945 — when were the roof, HVAC, electrical panel, plumbing, and water heater last replaced?
- Why hasn't it sold? Are there any deal-killer items the seller is aware of (foundation, flood, title, zoning, code violations)?
- Is there a deadline driving the sale (1031 exchange, divorce, estate, relocation)? That informs how much negotiation room exists.
- Schools are F-rated, which usually means shorter tenancies and higher turnover. Who's the typical renter profile here, and what's been the actual vacancy rate?
- Crime grade is D in this area — have there been break-ins, vandalism, or insurance claims at this property in the last 3 years? What carrier currently insures it and at what premium?
- What's the average days-on-market for RENTAL listings here right now (not sales)? A rising rental-DOM trend means longer vacancies and softer asking-rent achievability than the comps imply.
- What's the recent tenant-quality profile in this submarket — average credit score on applications, eviction rate, late-payment / NSF rate, and stable-employment percentage? A property-management company in the area should have these aggregated.
- How much new for-sale + rental construction is in the pipeline within 1–3 miles? Heavy new supply typically softens prices + rents 12–24 months out; constrained supply supports both.
Investment metrics
- 1% rule
- 1.26% ✓
- Cap rate
- 10.31%
- Cash-on-cash
- 14.33%
- DSCR
- 1.64
- GRM
- 6.6
CMA / ARV
- ARV (median comp)
- $146,126
- List price
- $107,500
- Delta
- -26.43%
- Verdict
- UNDERPRICED
- Comps
- 20 within 1.0 mi
Show comp detail 5 sales within ~0.75 mi
| Address | Dist | Beds/Ba | Sqft | Sold | Price | $/sf | Match |
|---|---|---|---|---|---|---|---|
| 113 Kathleen St | 0.35mi | 4/1.5 (+1) | 2,070 (+13%) | 2mo | $55,000 | $27 | 53 |
| 206 Peachtree St | 0.67mi | 3/2.0 | 1,681 (-8%) | 3mo | $179,140 | $107 | 53 |
| 204 S Montrose St | 0.53mi | 3/2.0 | 1,692 (-7%) | 17mo | $157,000 | $93 | 49 |
| 310 Persons St | 0.73mi | 4/2.0 (+1) | 1,720 (-6%) | 10mo | $50,000 | $29 | 43 |
| 400 W Church St | 0.60mi | 3/2.0 | 2,038 (+12%) | 23mo | $215,000 | $105 | 34 |
Match score weights: distance 35% · size 25% · config 20% · recency 20%. Top-matched comps best support the ARV.
Projected returns pro-forma
-3.0% appreciation · 3.0% rent growth · sell at horizon
- IRR
- 4.7%
- Equity multiple
- 1.18×
- Total profit
- $5,477
- Equity at exit
- $16,029
- IRR
- 14.2%
- Equity multiple
- 2.14×
- Total profit
- $34,248
- Equity at exit
- $9,295
Cash invested: $30,100 (down + closing). Projections, not guarantees.
Landlord ↔ Tenant lean methodology
- Overall (STATE)
- 90 Strongly Landlord-Friendly
- State Georgia
- 90 Strongly Landlord-Friendly · R+3
- County
- — inherits STATE
- City
- — inherits STATE
ZIP-level market 31030
- Home prices YoY
- -14.7%
- Active inventory
- 116
- Price-to-rent
- 6.6×
Monthly cashflow live
- Estimated rent
- $1,350 high interval (Pro) →
- Mortgage (P&I)
- −$564
- Tax from tax record
- −$99 /mo · $1,183/yr
- Insurance
- −$45
- HOA
- −$0
- Vacancy / Maint / Mgmt
- −$284
- Net cashflow
- $360
Break-even live
UW: 25.0% down · 7.5% · 30yr · 1.5% tax · 5.0% vac · 8.0% maint · 8.0% mgmt
Financing live
Cash to close
- Down payment
- $26,875
- Closing costs
- $3,225
- Reserves months
- —
- Total cash needed
- —
Loan-product check · same deal, 3 products live
Conventional
25% down · 7.5% · 30yr
- Down + closing
- —
- Monthly P&I
- —
- Monthly cashflow
- —
- DSCR
- —
- Eligible?
- —
Personal DTI + credit; lowest rate.
DSCR
20% down · 8.5% · 30yr
- Down + closing
- —
- Monthly P&I
- —
- Monthly cashflow
- —
- DSCR
- —
- Eligible?
- —
No personal income docs; deal must DSCR.
Hard money
10% down · 12.0% · 12mo
- Down + closing
- —
- Monthly P&I
- —
- Monthly cashflow
- —
- DSCR
- —
- Eligible?
- —
Short-term bridge; refi at stabilization.
Rent comps 5 comps
| Address | Beds | Baths | Sqft | Rent | $/sqft | DOM | Units | Dist |
|---|---|---|---|---|---|---|---|---|
| 310 Central Ave Fort Valley, GA | 3.0 | 2.0 | 2063 | $1,300 | $0.63 | 21d | 1 | 0.48mi |
| 310 Central Ave Fort Valley, GA | 3.0 | 2.0 | 2063 | $1,300 | $0.63 | 43d | 1 | 0.48mi |
| 412 Vienna Cir Fort Valley, GA | 4.0 | 2.0 | 1501 | $1,400 | $0.93 | 13d | 1 | 0.87mi |
| 14 Flint Dr Fort Valley, GA | 3.0 | 1.5 | 1404 | $1,400 | $1.00 | 13d | 1 | 1.24mi |
| 307 Christopher Cir Fort Valley, GA | 4.0 | 1.0 | 1272 | $1,550 | $1.22 | 13d | 1 | 1.31mi |
Listing history 21 events
-
2026-06-19days on market $107,500 Active 127 DOM
-
2026-06-18days on market $107,500 Active 126 DOM
-
2026-06-17days on market $107,500 Active 125 DOM
-
2026-06-16days on market $107,500 Active 124 DOM
-
2026-06-15days on market $107,500 Active 123 DOM
-
2026-06-14days on market $107,500 Active 121 DOM
-
2026-06-13days on market $107,500 Active 120 DOM
-
2026-06-10days on market $107,500 Active 118 DOM
-
2026-06-09days on market $107,500 Active 117 DOM
-
2026-06-08days on market $107,500 Active 116 DOM
-
2026-06-07days on market $107,500 Active 115 DOM
-
2026-06-05days on market $107,500 Active 112 DOM
-
2026-06-03days on market $107,500 Active 111 DOM
-
2026-06-02days on market $107,500 Active 110 DOM
-
2026-06-01days on market $107,500 Active 109 DOM
-
2026-05-31days on market $107,500 Active 108 DOM
-
2026-05-30days on market $107,500 Active 107 DOM
-
2026-05-02price $107,500 635-char remark
Show marketing remark (635 chars)
Come to Georgia's very own Peach Capital City in the seat of Peach County, before prices grow too big. Centrally located in town, with easy access to Bluebird and Fort Valley State University. Updated and ready to move in. All kinds of possibilities with its covered 2-story front porch, 4 large bedrooms and 3 bathrooms. Expansive main level foyer / hallway and upstairs landing area. Excellent space separation, including a laundry room with an exterior driveway access door and plenty of parking. New HVAC, duct work, bathrooms, paint, flooring and fixtures. Stop paying crazy rent or just add it to your rental portfolio.--
-
2026-02-12historical
-
2026-02-11$120,000 New 635-char remark
Show marketing remark (635 chars)
Come to Georgia's very own Peach Capital City in the seat of Peach County, before prices grow too big. Centrally located in town, with easy access to Bluebird and Fort Valley State University. Updated and ready to move in. All kinds of possibilities with its covered 2-story front porch, 4 large bedrooms and 3 bathrooms. Expansive main level foyer / hallway and upstairs landing area. Excellent space separation, including a laundry room with an exterior driveway access door and plenty of parking. New HVAC, duct work, bathrooms, paint, flooring and fixtures. Stop paying crazy rent or just add it to your rental portfolio.--
-
2026-01-01$140,000 New
ⓘ Source: listings_history table (triggers on properties + properties_extension) + one-shot
backfill from property_details.listing_events for pre-trigger history.
Tax reassessment forecast GA · Resets to sale price
- Current annual tax
- $1,183 · $99/mo
- Projected year-2 tax
- $1,183 · $99/mo
- Expected delta
- $0/yr ($0/mo · 0.0%)
ⓘ Screening estimate from a state-policy table — verify with the county assessor before closing.
Climate risk First Street
- Flood 1/10 Low FEMA zone X (unshaded) · 0% chance over 30 yrs
- Wildfire 4/10 Moderate
- Heat 7/10 Severe 7 d/yr ≥107°F today · 18 d/yr by 30 yrs out
- Wind 8/10 Severe 80% chance of damaging wind over 30 yrs
- Air quality 2/10 Low 2 unhealthy d/yr today · 2 by 30 yrs out
Nearby sold comps map
Loading sold comps map…
Walkable amenities ~0.75 mi
Loading nearby amenities…
Taxation est. · year 1
- Rental income
- $16,202
- − Mortgage interest
- −$6,022
- − Property taxes
- −$1,183
- − Insurance
- −$538
- − Repairs & maintenance
- −$1,296
- − Management
- −$1,296
- − Depreciation
- −$3,127
- Taxable income
- $2,740
- Est. tax owed @ 24.0%
- −$658
- After-tax cash flow
- $3,657/yr
For passive investors: Depreciation is non-cash, so a rental often shows a tax loss while cash-flowing — sheltering income. Rental losses are passive: they offset passive income freely, and up to $25,000/yr can offset ordinary (W-2) income if you actively participate and your MAGI is under $100k (phasing out to $0 by $150k); unused losses carry forward. On sale, claimed depreciation is recaptured at up to 25%, and gains may owe capital-gains tax (a 1031 exchange can defer both). Figures are a year-1 estimate at your 24.0% rate — not tax advice; consult a CPA.
Schools (NCES district)
- District
- Peach County
- NCES district ID
- 1304050
- Math proficiency
- 17% ▼ -15.00%
- Reading proficiency
- 25% ▼ -5.00%
- Median HH income
- $41,348
- Composite
- 17.89/100
- National rank
- #9000
- State rank
- #141 of 174 in GA
Livability — Fort Valley
- Score
- 65/100
- State rank
- #220
- US rank
- #12957
Category grades
Schools grade is shown separately in the Schools card above.
Census & demographics
- Census place
- Fort Valley, GA
- City population
- 17,987
- Population (ZIP)
- 17,987
Population outlook (Peach County) Hauer SSP2
- Today (2025)
- 26,481 people
- By 2030
- 25,723 · -2.9%
- By 2040
- 23,812 · -10.1%
- By 2050
- 21,724 · -18.0%
- By 2075
- 17,513 · -33.9%
- By 2100
- 14,235 · -46.2%
Race, ethnicity, and origin ACS 2023
- Neighborhood character
- Diverse neighborhood (Simpson 0.62)
- Race & ethnicity
- Black 49% White 35% Hispanic / Latino 12% Two or more races 5% Native American 1%
- Hispanic origin (detail)
- Mexican 9% Cuban 2%
- Common ancestry
- Romanian 1% Italian 1% Serbian 1%
- Foreign-born
- 7% · Canada
- Languages at home
- 90% English-only · Spanish 8%
Political lean MEDSL · Peach
- 2024 margin
- Lean R (+6.0) · D 46.8% · R 52.8%
- 2008→2024 swing
- -12.8pp toward R · 2008: 6.8pp · 2024: -6.0pp
- All cycles
- 2024: R+6.0 2020: R+4.7 2016: R+3.0 2012: D+7.5 2008: D+6.8
Not yet ingested
- Civics
- —
Market trends
- HPI YoY
- ▼ -34.82%
- Current HPI
- 202.0025
- Rent YoY
- —
- Metro
- —
- State GDP YoY
- ▲ 2.66%
- F500 in state
- 28
Industry mix (Fortune 500 HQ in GA)
| Industry | F500 HQs | Revenue |
|---|---|---|
| Paper / Packaging | 2 | $29B |
|
||
| Retail | 1 | $160B |
|
||
| Transportation / Logistics | 1 | $91B |
|
||
| Airlines | 1 | $62B |
|
||
| Consumer Goods | 1 | $47B |
|
||
| Utilities | 1 | $25B |
|
||
Price history
-23.2% since first listed4 events — show timeline
- 2026-05-02 Price Changed $107,500 GAMLS
- 2026-02-12 Listing Removed — GAMLS
- 2026-02-11 Listed $120,000 GAMLS
- 2026-01-01 Listed $140,000 GAMLS
Property tax history
+9.7%/yrLatest (2025): $1,183 · -1.6% YoY. Source: county tax records.
Cash-flow waterfall
monthlySold comps — $/sqft
last 12 mo · ≤1 miLoading sold comps…