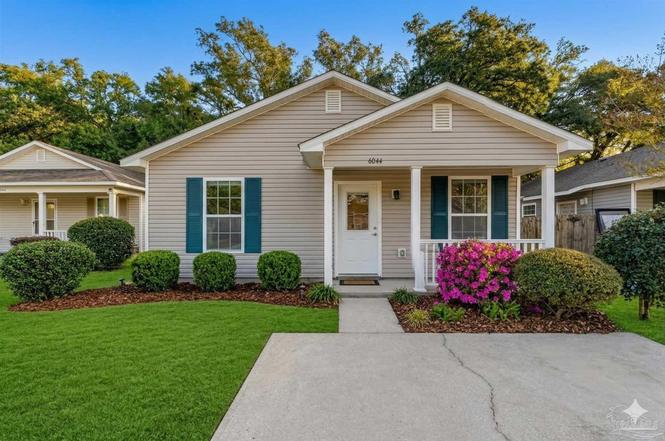
6044 Champion Oaks Dr · Bellview, FL
Flood risk 1/10 · Minimal
- FEMA flood zone
- X (unshaded)
- Chance of flooding over 30 yrs
- 0.0%
- Est. flood insurance / yr
- $507 – $1,088
Fire risk 1/10 · Minimal
- Est. fire insurance / yr
- $947 – $1,759
Heat risk 10/10 · Severe
- Hot days now (above 105°F)
- 7 days/yr
- Hot days in 30 yrs
- 23 days/yr
Wind risk 9/10 · Severe
- Chance of severe wind over 30 yrs
- 99.0%
Air-quality risk 1/10 · Minimal
- Unhealthy air days now
- 0 days/yr
- Unhealthy air days in 30 yrs
- 0 days/yr
Risk factors via First Street. Map © Google.
Why this score? — see what drove the B grade
The composite is a weighted blend of 9 inputs, each scored 0–100. Each bar is that input's sub-score; the figure is the points it added to the 100-point composite (weight × sub-score).
- Cash flow +28.7/30.0
- ARV discount +15.0/15.0
- DSCR +10.0/10.0
- 1% rule +7.0/10.0
- Rent growth +3.6/5.0
- Schools +3.6/10.0
- Livability +3.4/5.0
- Condition / age +2.5/5.0
- Appreciation +0.0/10.0
$210,000
🖨 Deal sheet 📄 Offer letter ✓ Due diligence
Listing remarks
Welcome to a spacious five-bedroom, two-bath home offering comfort, functionality, and a convenient central location. With plenty of room for family, guests, or a home office setup, this property provides the flexibility many buyers are searching for. Inside, you’ll immediately notice the beautiful wood-look flooring that runs throughout the home, creating a cohesive and modern feel while also being durable and easy to maintain. The layout makes it ideal for those who need extra space to spread out. Natural light flows through the home, enhancing the warm and inviting atmosphere. The kitchen is centrally located and designed for everyday living, providing ample cabinetry and workspace
Key facts
- Wood look flooring
- Ample cabinetry
- Open flow
Tags
Property features AI
Finance
- Other: Insulated walls (energy efficiency feature); Resale property, not new construction
- HOA & community: Homeowners association with an annual fee of $150
Exterior
- Parking: Driveway with open parking
- Utilities: Public water; Public sewer; Copper electrical wiring; County-maintained road
- Home design: Single-story (one level); Detached property; Frame construction
- Construction: Frame construction; Slab foundation
- Exterior features: Shingle roof; Central access lot
Interior
- Kitchen: Updated kitchen (renovated within the last 1–5 years); Electric water heater
- Bedrooms: Three bedrooms on the first floor (each approximately 12 x 12)
- Flooring: Simulated wood
- Bathrooms: Two full bathrooms (recently updated within the last 1–5 years)
- Heating & cooling: Central heating; Central air conditioning; Ceiling fans
- Interior features: Simulated wood flooring; Updated bathrooms; Updated kitchen; Eat-in kitchen and living/dining combo
- Laundry & utility: Electric water heater
Neighborhood map
What this means for you Summary
Snapshot
- This is a 5-bed/2.0-bath single-family listed at $210k.
Deal economics
- At list price, monthly cash flow is $700 ($8k/yr) — positive.
- The deal already cash-flows at list — no discount required.
- Meets the 1% rule at list price ($3k rent vs $210k).
- Recommended offer: $197k (6.0% below list) — sets the bar for market timing.
- Cap rate 10.3% vs local median 5.2% in Bellview — top-decile yield for the area; either an underpriced asset or a hidden risk that comps aren't pricing in. Stress-test before assuming the spread holds.
Location & tenants
- Location reads 67/100 on livability (#561 in FL) — a middle-class / working-renter tenant base. Strengths: cost of living A+, housing A+; Watch: schools D+, amenities F, commute F.
- Escambia (suburban): math 40% / reading 45% proficiency, ranked #56 of 73 in FL (top 77%) — families likely to look elsewhere, expect single-tenant / working-renter base with shorter leases.
- Market conditions: Rents rising fast (+4.4%/yr); 417 active listings in the ZIP; 2 comparable units currently listed for rent nearby; solid renter incomes; 1,479 units permitted in Escambia County in 2024 (0 in 5+ unit buildings).
- This rent runs 40% of the median local income ($75k/yr) — at the standard rent-burdened threshold; future hikes will face affordability resistance.
Forward outlook
- Local home prices are declining (-3.0%/yr); year-one equity from $1k of loan paydown is wiped out by about $6k of value loss. Plan a longer hold.
- Escambia County population projected at +13% by 2050 — modest demand growth; plan on rents tracking national, not racing it.
- At projected returns (-3.0% appreciation + 4.4% rent growth), your $59k cash investment doubles in ~8 years — after that, you're playing with house money.
Negotiation context
- It's been on market 72 days — a 6% lower offer ($197k) is reasonable based on typical stale-listing flexibility.
- Current owner paid $140k; list at $210k implies a 50% gain — meaningful room to come down on a strong offer.
Risks & watch-outs
- Climate carrying-cost: severe wind risk, 99% chance of damaging wind over 30y; extreme-heat days projected 7→23/yr by 2055 (HVAC capex compounding) — expect insurance premiums to compound above CPI over the hold.
Questions for the listing agent
- It's been on market 72 days. Have you received any prior offers? Is the seller open to a 6% concession, seller financing, or rate buy-down credit?
- What does the HOA fee cover, when was the last increase, and are there any pending special assessments or reserve-fund shortfalls?
- Why hasn't it sold? Are there any deal-killer items the seller is aware of (foundation, flood, title, zoning, code violations)?
- Is there a deadline driving the sale (1031 exchange, divorce, estate, relocation)? That informs how much negotiation room exists.
- Schools are D-rated, which usually means shorter tenancies and higher turnover. Who's the typical renter profile here, and what's been the actual vacancy rate?
- What's the average days-on-market for RENTAL listings here right now (not sales)? A rising rental-DOM trend means longer vacancies and softer asking-rent achievability than the comps imply.
- What's the recent tenant-quality profile in this submarket — average credit score on applications, eviction rate, late-payment / NSF rate, and stable-employment percentage? A property-management company in the area should have these aggregated.
- How much new for-sale + rental construction is in the pipeline within 1–3 miles? Heavy new supply typically softens prices + rents 12–24 months out; constrained supply supports both.
Investment metrics
- 1% rule
- 1.20% ✓
- Cap rate
- 10.30%
- Cash-on-cash
- 14.29%
- DSCR
- 1.64
- GRM
- 6.9
CMA / ARV
- ARV (on-the-fly)
- $279,720
- Comps found
- 12
Show comp detail 12 sales within ~0.75 mi
| Address | Dist | Beds/Ba | Sqft | Sold | Price | $/sf | Match |
|---|---|---|---|---|---|---|---|
| 6044 Champion Oaks Dr | 0.00mi | 5/2.0 | 1,512 (0%) | 1mo | $200,000 | $132 | 99 |
| 4680 Geneva Dr | 0.53mi | 4/2.0 (-1) | 1,526 (+1%) | 13mo | $225,000 | $147 | 58 |
| 4993 Muldoon Pointe Rd Unit 2B | 0.66mi | 6/2.0 (+1) | 1,515 (+0%) | 12mo | $270,825 | $179 | 54 |
| 5989 Pursley Ave | 0.22mi | 4/1.5 (-1) | 1,698 (+12%) | 11mo | $230,000 | $135 | 53 |
| 4976 Muldoon Pointe Rd Unit 7A | 0.60mi | 6/2.0 (+1) | 1,515 (+0%) | 17mo | $281,400 | $186 | 52 |
| 4988 Muldoon Pointe Rd Unit 4A | 0.61mi | 6/2.0 (+1) | 1,515 (+0%) | 19mo | $282,190 | $186 | 50 |
| 5719 Ventura Ln | 0.66mi | 4/2.0 (-1) | 1,400 (-7%) | 3mo | $185,000 | $132 | 50 |
| 4945 Muldoon Pointe Rd Unit 14B | 0.66mi | 6/2.0 (+1) | 1,515 (+0%) | 18mo | $285,615 | $189 | 49 |
| 4985 Muldoon Pointe Rd Unit 4B | 0.65mi | 6/2.0 (+1) | 1,454 (-4%) | 14mo | $268,560 | $185 | 46 |
| 5800 Avondale Rd | 0.62mi | 4/2.0 (-1) | 1,700 (+12%) | 1mo | $110,000 | $65 | 44 |
| 4980 Muldoon Pointe Rd Unit 6A | 0.60mi | 6/2.0 (+1) | 1,317 (-13%) | 20mo | $277,725 | $211 | 29 |
| 4949 Muldoon Pointe Rd Unit 13B | 0.66mi | 6/2.0 (+1) | 1,317 (-13%) | 22mo | $286,500 | $218 | 25 |
Match score weights: distance 35% · size 25% · config 20% · recency 20%. Top-matched comps best support the ARV.
Projected returns pro-forma
-3.0% appreciation · 4.42% rent growth · sell at horizon
- IRR
- 6.1%
- Equity multiple
- 1.24×
- Total profit
- $14,171
- Equity at exit
- $31,312
- IRR
- 16.6%
- Equity multiple
- 2.44×
- Total profit
- $84,952
- Equity at exit
- $18,157
Cash invested: $58,800 (down + closing). Projections, not guarantees.
Landlord ↔ Tenant lean methodology
- Overall (STATE)
- 87 Strongly Landlord-Friendly
- State Florida
- 87 Strongly Landlord-Friendly · R+3
- County
- — inherits STATE
- City
- — inherits STATE
ZIP-level market 32526
- Home prices YoY
- -28.3%
- Rents YoY
- 4.4%
- Active inventory
- 417
- Price-to-rent
- 6.9×
Monthly cashflow live
- Estimated rent
- $2,519 medium interval (Pro) →
- Mortgage (P&I)
- −$1,101
- Tax from tax record
- −$88 /mo · $1,054/yr
- Insurance
- −$88
- HOA
- −$13
- Vacancy / Maint / Mgmt
- −$529
- Net cashflow
- $700
Break-even live
UW: 25.0% down · 7.5% · 30yr · 1.5% tax · 5.0% vac · 8.0% maint · 8.0% mgmt
Financing live
Cash to close
- Down payment
- $52,500
- Closing costs
- $6,300
- Reserves months
- —
- Total cash needed
- —
Loan-product check · same deal, 3 products live
Conventional
25% down · 7.5% · 30yr
- Down + closing
- —
- Monthly P&I
- —
- Monthly cashflow
- —
- DSCR
- —
- Eligible?
- —
Personal DTI + credit; lowest rate.
DSCR
20% down · 8.5% · 30yr
- Down + closing
- —
- Monthly P&I
- —
- Monthly cashflow
- —
- DSCR
- —
- Eligible?
- —
No personal income docs; deal must DSCR.
Hard money
10% down · 12.0% · 12mo
- Down + closing
- —
- Monthly P&I
- —
- Monthly cashflow
- —
- DSCR
- —
- Eligible?
- —
Short-term bridge; refi at stabilization.
Rent comps 2 comps
| Address | Beds | Baths | Sqft | Rent | $/sqft | DOM | Units | Dist |
|---|---|---|---|---|---|---|---|---|
| 5217 Saufley Field Rd Pensacola, FL | 4.0 | 2.5 | 1817 | $1,895 | $1.04 | 23d | 1 | 0.54mi |
| 5877 Tryton Cir Pensacola, FL | 4.0 | 2.0 | 1419 | $1,825 | $1.29 | 23d | 1 | 1.49mi |
HOA detail
- Monthly dues
- $13 · $156/yr
Listing history 6 events
-
2026-05-21status Pending
-
2026-04-22historical Contingent
-
2026-04-07price $210,000
-
2026-03-10$225,000 Active
-
2025-05-01soldstatus $140,000
-
2011-12-09soldstatus $337,500
ⓘ Source: listings_history table (triggers on properties + properties_extension) + one-shot
backfill from property_details.listing_events for pre-trigger history.
Tax reassessment forecast FL · Resets to sale price
- Current annual tax
- $1,054 · $88/mo
- Projected year-2 tax
- $1,743 · $145/mo
- Expected delta
- +$689/yr (+$57/mo · 65.4%)
ⓘ Screening estimate from a state-policy table — verify with the county assessor before closing.
Climate risk First Street
- Flood 1/10 Low FEMA zone X (unshaded) · 0% chance over 30 yrs
- Wildfire 1/10 Low
- Heat 10/10 Extreme 7 d/yr ≥105°F today · 23 d/yr by 30 yrs out
- Wind 9/10 Extreme 99% chance of damaging wind over 30 yrs
- Air quality 1/10 Low 0 unhealthy d/yr today · 0 by 30 yrs out
Nearby sold comps map
Loading sold comps map…
Walkable amenities ~0.75 mi
Loading nearby amenities…
Taxation est. · year 1
- Rental income
- $30,228
- − Mortgage interest
- −$11,763
- − Property taxes
- −$1,054
- − Insurance
- −$1,050
- − Repairs & maintenance
- −$2,418
- − Management
- −$2,418
- − HOA
- −$156
- − Depreciation
- −$6,109
- Taxable income
- $5,259
- Est. tax owed @ 24.0%
- −$1,262
- After-tax cash flow
- $7,143/yr
For passive investors: Depreciation is non-cash, so a rental often shows a tax loss while cash-flowing — sheltering income. Rental losses are passive: they offset passive income freely, and up to $25,000/yr can offset ordinary (W-2) income if you actively participate and your MAGI is under $100k (phasing out to $0 by $150k); unused losses carry forward. On sale, claimed depreciation is recaptured at up to 25%, and gains may owe capital-gains tax (a 1031 exchange can defer both). Figures are a year-1 estimate at your 24.0% rate — not tax advice; consult a CPA.
Schools (NCES district)
- District
- Escambia
- NCES district ID
- 1200510
- Math proficiency
- 40% ▼ -9.00%
- Reading proficiency
- 45% ▼ -4.00%
- Median HH income
- $44,649
- Composite
- 36.04/100
- National rank
- #4773
- State rank
- #56 of 73 in FL
Livability — Bellview
- Score
- 67/100
- State rank
- #561
- US rank
- #10731
Category grades
Schools grade is shown separately in the Schools card above.
Census & demographics
- Census place
- Bellview, FL
- County
- Escambia County · 301,722 people
- Metro
- Pensacola-Ferry Pass-Brent, FL
- Population (ZIP)
- 44,680
- Household income
- $75,098
- Rent vs Own
- Severe rent burden
- 1166.0
Population outlook (Escambia County) Hauer SSP2
- Today (2025)
- 334,637 people
- By 2030
- 345,779 · +3.3%
- By 2040
- 364,828 · +9.0%
- By 2050
- 378,514 · +13.1%
- By 2075
- 403,220 · +20.5%
- By 2100
- 386,125 · +15.4%
Race, ethnicity, and origin ACS 2023
- Neighborhood character
- Predominantly White (66%)
- Race & ethnicity
- White 66% Black 19% Two or more races 8% Hispanic / Latino 5% Asian 3%
- Common ancestry
- Lithuanian 2% Slovak 2% Serbian 2%
- Foreign-born
- 5% · Canada, China
- Languages at home
- 94% English-only · Spanish 2% Tagalog/Filipino 1% Other Indo-European 1%
Political lean MEDSL · Escambia
- 2024 margin
- R (+19.5) · D 39.7% · R 59.2% · Other 1.1%
- 2008→2024 swing
- -0.2pp no change · 2008: -19.3pp · 2024: -19.5pp
- All cycles
- 2024: R+19.5 2020: R+15.1 2016: R+20.6 2012: R+20.6 2008: R+19.3
Not yet ingested
- Civics
- —
Market trends
- HPI YoY
- ▼ -99.68%
- Current HPI
- 252.6406
- Rent YoY
- ▲ 4.42%
- Metro
- Pensacola-Ferry Pass-Brent, FL
- State GDP YoY
- ▲ 3.28%
- F500 in state
- 36
Industry mix (Fortune 500 HQ in FL)
| Industry | F500 HQs | Revenue |
|---|---|---|
| Industrial Technology | 2 | $29B |
|
||
| Insurance | 2 | $17B |
|
||
| Retail | 1 | $60B |
|
||
| Technology Distribution | 1 | $58B |
|
||
| Homebuilding | 1 | $35B |
|
||
| Technology Manufacturing | 1 | $35B |
|
||
Price history
-37.8% since first listed6 events — show timeline
- 2026-05-21 Pending — PARMLS
- 2026-04-22 Contingent — PARMLS
- 2026-04-07 Price Changed $210,000 PARMLS
- 2026-03-10 Listed $225,000 PARMLS
- 2025-05-01 Sold (Public Records) $140,000 Public Records
- 2011-12-09 Sold (Public Records) $337,500 Public Records
Property tax history
+3.7%/yrLatest (2025): $1,054 · +19.0% YoY. Source: county tax records.
Cash-flow waterfall
monthlySold comps — $/sqft
last 12 mo · ≤1 miLoading sold comps…