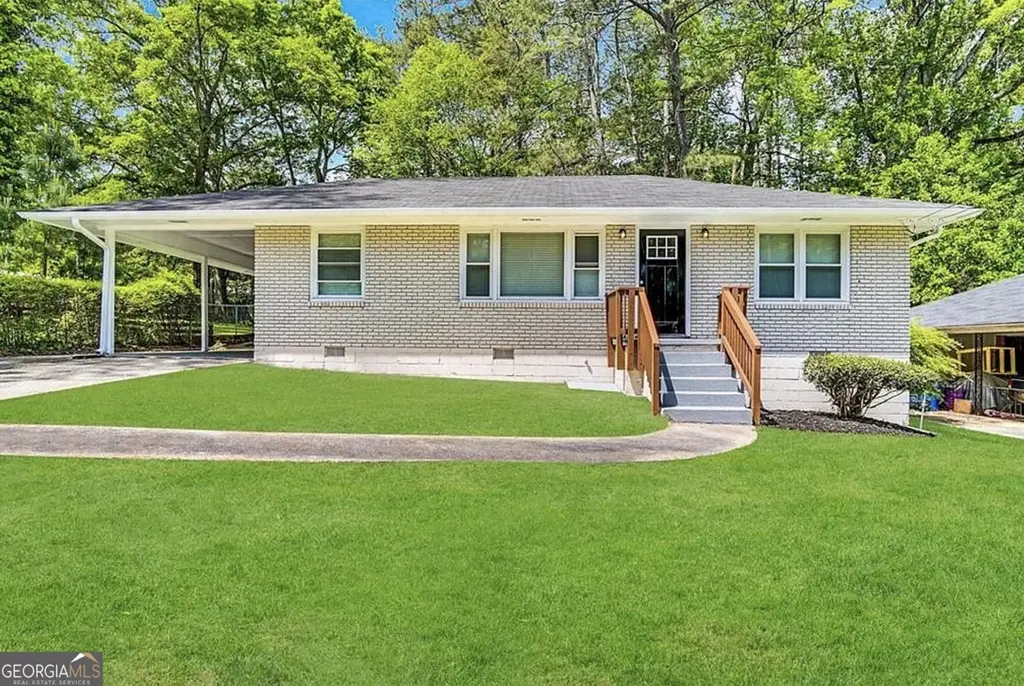
2469 Baywood Dr SE · Atlanta, GA
Flood risk 1/10 · Minimal
- FEMA flood zone
- X (unshaded)
- Chance of flooding over 30 yrs
- 0.0%
- Est. flood insurance / yr
- $473 – $860
Fire risk 1/10 · Minimal
- Est. fire insurance / yr
- $963 – $1,789
Heat risk 5/10 · Moderate
- Hot days now (above 104°F)
- 7 days/yr
- Hot days in 30 yrs
- 18 days/yr
Wind risk 5/10 · Moderate
- Chance of severe wind over 30 yrs
- 26.0%
Air-quality risk 4/10 · Minor
- Unhealthy air days now
- 4 days/yr
- Unhealthy air days in 30 yrs
- 6 days/yr
Risk factors via First Street. Map © Google.
Why this score? — see what drove the D grade
The composite is a weighted blend of 9 inputs, each scored 0–100. Each bar is that input's sub-score; the figure is the points it added to the 100-point composite (weight × sub-score).
- Cash flow +13.9/30.0
- ARV discount +8.5/15.0
- 1% rule +4.2/10.0
- DSCR +4.2/10.0
- Livability +4.2/5.0
- Rent growth +3.3/5.0
- Schools +2.7/10.0
- Condition / age +2.5/5.0
- Appreciation +0.0/10.0
$200,000
🖨 Deal sheet (PDF) 📄 Offer letter ✓ Due diligence
Listing remarks MLS
**100% FINANCING AVAILABLE ON THIS HOME FOR QUALIFIED BUYERS** A beautifully renovated 4-bedroom, 2.5-bathroom home. This home features stylish updates including stainless steel kitchen appliances, granite countertops, and updated flooring throughout. Conveniently located near shopping, dining, and more! Do not miss this opportunity! Contact SouthState Bank (Amy Buynoski NMLS#545254) at 678-249-7457 for more information on 100% financing options. Advertised product assumes the purchase of a single-family primary residence, 600 minimum FICO, down payment of 0%, and loan amount up to the conforming loan amount limit. Buyer is free to shop financing offers from any lender to choose the best services and best rate.
Key facts
- Updated flooring
- Granite countertops
- 0.31 acre lot
Tags
Neighborhood map
What this means for you Summary
Snapshot
- This is a 3-bed/1.0-bath single-family listed at $200k.
Deal economics
- At list price, monthly cash flow is $23 ($273/yr) — positive.
- The deal already cash-flows at list — no discount required.
- To meet the 1% rule (rent ≥ 1% of price), the offer needs to be $184k (7.9% below list).
- Recommended offer: $176k (12.0% below list) — sets the bar for market timing.
- Cap rate 6.4% vs local median 3.1% in Atlanta — top-decile yield for the area; either an underpriced asset or a hidden risk that comps aren't pricing in. Stress-test before assuming the spread holds.
Location & tenants
- Location reads 83/100 on livability (#6 in GA, #919 nationally) — a professional / high-income tenant draw. Strengths: amenities A+, commute A+, housing A+; Watch: cost of living C-.
- Atlanta Public Schools (urban): math 28% / reading 35% proficiency, ranked #80 of 174 in GA (top 46%) — families likely to look elsewhere, expect single-tenant / working-renter base with shorter leases; 71% free/reduced lunch — lower-income household profile, screen leases tightly.
- Zoned schools: Kipp Ways Primary Charter School (math 5% / reading 5%, grade F, #1,160 of 1,228 statewide, top 98%, 477 students, 100% FRL, charter); Crawford Long Middle School (math 2% / reading 8%, grade F, #462 of 470 statewide, top 99%, 705 students, 100% FRL) — zoned schools average 100% FRL vs 71% district-wide (29 pts higher); higher-poverty schools than district average — tighter screening recommended.
- Zoned-school proficiency averages 5% at this address vs 32% district-wide (-26 pts) — the specific schools serving this property underperform the Atlanta Public Schools average; the district grade overstates school quality for this exact location.
- Market conditions: Rents rising (+3.2%/yr); 391 active listings in the ZIP; 40 comparable units currently listed for rent nearby; rentals at typical pace (median 22d on market — plan ~3-4 weeks tenant-placement turnaround); 11,565 units permitted in Fulton County in 2024 (8,159 in 5+ unit buildings).
Forward outlook
- Local home prices are declining (-3.0%/yr); year-one equity from $1k of loan paydown is wiped out by about $6k of value loss. Plan a longer hold.
- Fulton County population projected at +38% by 2050 — long-run rental-demand tailwind backs the buy-and-hold thesis.
Negotiation context
- It's been on market 387 days — a 12% lower offer ($176k) is reasonable based on typical stale-listing flexibility.
- 3 sale attempts since 14y ago with the ask held roughly flat each time — persistent listings suggest the price (not the market) is what's stuck; bring a comps-based counter.
- Current owner paid $90k; list at $200k implies a 122% gain — meaningful room to come down on a strong offer.
Risks & watch-outs
- Watch-outs: built in 1955 — expect roof / HVAC / electrical / plumbing capex.
- Climate carrying-cost: moderate wind risk, 26% chance of damaging wind over 30y; extreme-heat days projected 7→18/yr by 2055 (HVAC capex compounding) — expect insurance premiums to compound above CPI over the hold.
Questions for the listing agent
- It's been on market 387 days. Have you received any prior offers? Is the seller open to a 12% concession, seller financing, or rate buy-down credit?
- Built in 1955 — when were the roof, HVAC, electrical panel, plumbing, and water heater last replaced?
- Why hasn't it sold? Are there any deal-killer items the seller is aware of (foundation, flood, title, zoning, code violations)?
- Is there a deadline driving the sale (1031 exchange, divorce, estate, relocation)? That informs how much negotiation room exists.
- The area grade is low — what's the realistic commute time and amenity access for the typical tenant pool here? Any planned neighborhood developments (good or bad) we should know about?
- What's the average days-on-market for RENTAL listings here right now (not sales)? A rising rental-DOM trend means longer vacancies and softer asking-rent achievability than the comps imply.
- What's the recent tenant-quality profile in this submarket — average credit score on applications, eviction rate, late-payment / NSF rate, and stable-employment percentage? A property-management company in the area should have these aggregated.
- How much new for-sale + rental construction is in the pipeline within 1–3 miles? Heavy new supply typically softens prices + rents 12–24 months out; constrained supply supports both.
Investment metrics
- 1% rule
- 0.92% ✗
- Cap rate
- 6.43%
- Cash-on-cash
- 0.49%
- DSCR
- 1.02
- GRM
- 9.1
CMA / ARV
- ARV (median comp)
- $204,688
- List price
- $200,000
- Delta
- -2.29%
- Verdict
- FAIR
- Comps
- 20 within 1.0 mi
Show comp detail 12 sales within ~0.75 mi
| Address | Dist | Beds/Ba | Sqft | Sold | Price | $/sf | Match |
|---|---|---|---|---|---|---|---|
| 190 Judy Ln SW | 0.36mi | 3/2.0 | 1,176 (+2%) | 6mo | $217,000 | $185 | 70 |
| 233 Banberry Dr SE | 0.36mi | 3/2.0 | 1,025 (-11%) | 5mo | $185,000 | $180 | 57 |
| 2288 Polar Rock Ave SW | 0.54mi | 3/1.0 | 1,044 (-9%) | 5mo | $120,000 | $115 | 55 |
| 287 Banberry Dr | 0.49mi | 3/2.0 | 1,025 (-11%) | 0mo | $225,000 | $220 | 55 |
| 2185 Lang Dr SW | 0.57mi | 3/2.5 | 1,230 (+7%) | 4mo | $320,000 | $260 | 52 |
| 305 Banberry Dr SE | 0.52mi | 3/1.0 | 1,000 (-13%) | 3mo | $135,000 | $135 | 52 |
| 2361 Swallow Cir SE | 0.61mi | 3/2.0 | 1,025 (-11%) | 1mo | $199,900 | $195 | 49 |
| 2245 Polar Rock Ave SW | 0.61mi | 3/1.0 | 1,000 (-13%) | 2mo | $167,500 | $168 | 48 |
| 97 Harper Rd SE | 0.67mi | 3/1.5 | 1,025 (-11%) | 1mo | $154,680 | $151 | 48 |
| 276 Lydia Dr SE | 0.44mi | 3/2.5 | 1,311 (+14%) | 7mo | $245,000 | $187 | 44 |
| 322 E Rhinehill Rd | 0.67mi | 3/2.0 | 1,290 (+12%) | 5mo | $190,000 | $147 | 40 |
| 2780 Fairlane Dr SE | 0.74mi | 3/2.0 | 1,318 (+15%) | 2mo | $295,000 | $224 | 35 |
Match score weights: distance 35% · size 25% · config 20% · recency 20%. Top-matched comps best support the ARV.
Projected returns pro-forma
-3.0% appreciation · 3.23% rent growth · sell at horizon
- IRR
- -15.2%
- Equity multiple
- 0.46×
- Total profit
- $-30,477
- Equity at exit
- $29,821
- IRR
- -6.2%
- Equity multiple
- 0.60×
- Total profit
- $-22,677
- Equity at exit
- $17,292
Cash invested: $56,000 (down + closing). Projections, not guarantees.
Landlord ↔ Tenant lean methodology
- Overall (STATE)
- 90 Strongly Landlord-Friendly
- State Georgia
- 90 Strongly Landlord-Friendly · R+3
- County
- — inherits STATE
- City
- — inherits STATE
ZIP-level market 30315
- Rents YoY
- 3.2%
- Active inventory
- 391
- Price-to-rent
- 9.1×
Monthly cashflow live
- Estimated rent
- $1,842 high interval (Pro) →
- Mortgage (P&I)
- −$1,049
- Tax from tax record
- −$300 /mo · $3,600/yr
- Insurance
- −$83
- HOA
- −$0
- Vacancy / Maint / Mgmt
- −$387
- Net cashflow
- $23
Break-even live
Sensitivity live
| Price | -10% $136 | -5% $79 | +0% $23 | +5% $-34 | +10% $-91 |
|---|---|---|---|---|---|
| Rent | -10% $-123 | -5% $-50 | +0% $23 | +5% $95 | +10% $168 |
| Rate | -1.0pp $123 | -0.5pp $74 | base $23 | +0.5pp $-29 | +1.0pp $-82 |
UW: 25.0% down · 7.5% · 30yr · 1.5% tax · 5.0% vac · 8.0% maint · 8.0% mgmt
Financing live
Cash to close
- Down payment
- $50,000
- Closing costs
- $6,000
- Reserves months
- —
- Total cash needed
- —
Loan-product check · same deal, 3 products live
Conventional
25% down · 7.5% · 30yr
- Down + closing
- —
- Monthly P&I
- —
- Monthly cashflow
- —
- DSCR
- —
- Eligible?
- —
Personal DTI + credit; lowest rate.
DSCR
20% down · 8.5% · 30yr
- Down + closing
- —
- Monthly P&I
- —
- Monthly cashflow
- —
- DSCR
- —
- Eligible?
- —
No personal income docs; deal must DSCR.
Hard money
10% down · 12.0% · 12mo
- Down + closing
- —
- Monthly P&I
- —
- Monthly cashflow
- —
- DSCR
- —
- Eligible?
- —
Short-term bridge; refi at stabilization.
Rent comps 40 comps
| Address | Beds | Baths | Sqft | Rent | $/sqft | DOM | Units | Dist |
|---|---|---|---|---|---|---|---|---|
| 136 Hillsdale Dr SE Atlanta, GA | 3.0 | 2.0 | 1075 | $1,995 | $1.86 | 26d | 1 | 0.14mi |
| 2332 Baywood Dr SE Atlanta, GA | 3.0 | 2.0 | 1100 | $1,400 | $1.27 | 20d | 1 | 0.31mi |
| 305 Banberry Dr SE Atlanta, GA | 3.0 | 1.0 | 1000 | $1,550 | $1.55 | 1d | 1 | 0.50mi |
| 2268 Polar Rock Pl SW Atlanta, GA | 3.0 | 1.0 | 925 | $1,575 | $1.70 | 26d | 1 | 0.50mi |
| 2745 Old Hapeville Rd SW Atlanta, GA | 2.0–3.0 | 2.0 | 1007 | $1,375 | $1.36 | 17d | 1 | 0.58mi |
| 2694 Fairlane Dr SE Atlanta, GA | 4.0 | 2.0 | 1372 | $2,800 | $2.04 | 26d | 1 | 0.60mi |
| 2197 Polar Rock Pl SW Atlanta, GA | 3.0 | 2.5 | 1000 | $2,700 | $2.70 | 22d | 1 | 0.61mi |
| 2145 Macon Dr SW Atlanta, GA | 3.0 | 1.0 | 1059 | $1,450 | $1.37 | 26d | 1 | 0.61mi |
| 2786 Old Hapeville Rd SW Atlanta, GA | 2.0 | 1.5 | 1050 | $1,150 | $1.10 | 26d | 1 | 0.62mi |
| 73 Polar Rock Rd SW Atlanta, GA | 3.0 | 1.0 | 1098 | $1,850 | $1.68 | 12d | 1 | 0.68mi |
| 76 Schell Rd SE Atlanta, GA | 3.0 | 1.0 | 1080 | $1,623 | $1.50 | 26d | 1 | 0.70mi |
| 45 Baker Dr SW Atlanta, GA | 3.0 | 2.0 | 1056 | $1,600 | $1.52 | 26d | 1 | 0.83mi |
| 172 Meador Way SE Atlanta, GA | 3.0 | 2.0 | 1100 | $1,950 | $1.77 | 26d | 1 | 0.83mi |
| 445 Cleveland Ave SE Atlanta, GA | 2.0–3.0 | 1.0–2.0 | 1014 | $1,591 | $1.57 | 3d | 13 | 0.84mi |
| 386 Lindsey Dr SE Atlanta, GA | 3.0 | 1.0 | 1040 | $1,793 | $1.72 | 1d | 1 | 0.86mi |
| 2800 Grand Ave SW Atlanta, GA | 3.0 | 1.0 | 1052 | $1,600 | $1.52 | 1d | 1 | 0.90mi |
| 488 Pomona Cir SW Atlanta, GA | 3.0 | 1.0 | 1000 | $1,800 | $1.80 | 26d | 1 | 0.99mi |
| 2019 Pryor Rd SW Atlanta, GA | 2.0 | 2.5 | 1449 | $2,600 | $1.79 | 26d | 1 | 1.05mi |
| 167 Alyson Ct SE Atlanta, GA | 4.0 | 2.0 | 1344 | $1,825 | $1.36 | 26d | 1 | 1.07mi |
| 585 McWilliams Rd SE #104 Atlanta, GA | 2.0 | 3.0 | 1500 | $2,078 | $1.39 | 22d | 1 | 1.07mi |
| 2087 Lakewood Trl SE Atlanta, GA | 3.0 | 2.5 | 1056 | $2,256 | $2.14 | 26d | 1 | 1.08mi |
| 2959 Forrest Hills Dr SW Atlanta, GA | 1.0–2.0 | 1.0–1.5 | 925 | $1,250 | $1.35 | 15d | 1 | 1.12mi |
| 2959 Forrest Hills Dr SW Atlanta, GA | 1.0–2.0 | 1.0–1.5 | 925 | $1,250 | $1.35 | 18d | 2 | 1.12mi |
| 340 Adelle St SE Atlanta, GA | 3.0 | 1.0 | 1122 | $1,500 | $1.34 | 5d | 1 | 1.13mi |
| 532 Cleveland Ave SW Atlanta, GA | 2.0 | 1.0 | 836 | $950 | $1.14 | 17d | 1 | 1.14mi |
| 532 Cleveland Ave SW Atlanta, GA | 2.0 | 1.0 | 836 | $925 | $1.11 | 24d | 1 | 1.14mi |
| 1875 Conrad Ave SE Atlanta, GA | 3.0 | 2.0 | 1088 | $1,768 | $1.62 | 1d | 1 | 1.16mi |
| 2875 3rd Ave SW Unit A Atlanta, GA | 2.0 | 1.0 | 900 | $1,245 | $1.38 | 4d | 1 | 1.17mi |
| 3054 Waters Rd SW Atlanta, GA | 3.0 | 1.0 | 891 | $1,800 | $2.02 | 9d | 1 | 1.20mi |
| 3066 Waters Rd SW Atlanta, GA | 3.0 | 1.0 | 1144 | $1,395 | $1.22 | 22d | 1 | 1.22mi |
| 52 Claire Dr SE Atlanta, GA | 2.0 | 2.0 | 800 | $1,750 | $2.19 | 20d | 1 | 1.26mi |
| 210 Oak Dr SE Atlanta, GA | 3.0 | 2.0 | 1330 | $1,400 | $1.05 | 26d | 1 | 1.26mi |
| 3188 Ward Dr SW Atlanta, GA | 3.0 | 1.5 | 1025 | $1,800 | $1.76 | 14d | 1 | 1.31mi |
| 231 Maple St Atlanta, GA | 3.0 | 2.0 | 1068 | $1,645 | $1.54 | 45d | 1 | 1.34mi |
| 278 Moreland Way Atlanta, GA | 3.0 | 2.0 | 1000 | $1,945 | $1.95 | 26d | 1 | 1.36mi |
| 250 Amal Dr SW #7009 Atlanta, GA | 3.0 | 2.5 | 1440 | $1,850 | $1.28 | 9d | 1 | 1.36mi |
| 643 Langston Dr SW Atlanta, GA | 3.0 | 2.0 | 1180 | $2,000 | $1.69 | 26d | 1 | 1.37mi |
| 2000 Rambling Ln Atlanta, GA | 1.0–3.0 | 1.0–2.0 | 1082 | $1,514 | $1.40 | 1d | 9 | 1.39mi |
| 245 Amal Dr SW #3004 Atlanta, GA | 2.0 | 2.0 | 1402 | $1,800 | $1.28 | 24d | 1 | 1.41mi |
| 500 Hutchens Rd SE Atlanta, GA | 4.0 | 2.0 | 1248 | $2,400 | $1.92 | 18d | 1 | 1.42mi |
Listing history 29 events
-
2026-06-21days on market $200,000 Active 387 DOM
-
2026-06-18days on market $200,000 Active 384 DOM
-
2026-06-17days on market $200,000 Active 383 DOM
-
2026-06-16days on market $200,000 Active 382 DOM
-
2026-06-15days on market $200,000 Active 381 DOM
-
2026-06-13days on market $200,000 Active 379 DOM
-
2026-06-13days on market $200,000 Active 378 DOM
-
2026-06-09days on market $200,000 Active 375 DOM
-
2026-06-08days on market $200,000 Active 374 DOM
-
2026-06-07days on market $200,000 Active 373 DOM
-
2026-06-04days on market $200,000 Active 370 DOM
-
2026-06-03days on market $200,000 Active 369 DOM
-
2026-06-02days on market $200,000 Active 368 DOM
-
2026-06-01days on market $200,000 Active 367 DOM
-
2026-05-31days on market $200,000 Active 366 DOM
-
2026-04-10price $200,000 722-char remark
Show marketing remark (722 chars)
**100% FINANCING AVAILABLE ON THIS HOME FOR QUALIFIED BUYERS** A beautifully renovated 4-bedroom, 2.5-bathroom home. This home features stylish updates including stainless steel kitchen appliances, granite countertops, and updated flooring throughout. Conveniently located near shopping, dining, and more! Do not miss this opportunity! Contact SouthState Bank (Amy Buynoski NMLS#545254) at 678-249-7457 for more information on 100% financing options. Advertised product assumes the purchase of a single-family primary residence, 600 minimum FICO, down payment of 0%, and loan amount up to the conforming loan amount limit. Buyer is free to shop financing offers from any lender to choose the best services and best rate.
-
2025-05-30$210,000 New 722-char remark
Show marketing remark (722 chars)
**100% FINANCING AVAILABLE ON THIS HOME FOR QUALIFIED BUYERS** A beautifully renovated 4-bedroom, 2.5-bathroom home. This home features stylish updates including stainless steel kitchen appliances, granite countertops, and updated flooring throughout. Conveniently located near shopping, dining, and more! Do not miss this opportunity! Contact SouthState Bank (Amy Buynoski NMLS#545254) at 678-249-7457 for more information on 100% financing options. Advertised product assumes the purchase of a single-family primary residence, 600 minimum FICO, down payment of 0%, and loan amount up to the conforming loan amount limit. Buyer is free to shop financing offers from any lender to choose the best services and best rate.
-
2019-12-24soldstatus $90,000
-
2016-02-10price $13,000 154-char remark
Show marketing remark (154 chars)
HUD Case # 105-292370. *HUD HOME SOLD AS-IS* Uninsured (UI). Spacious brick ranch home with a large backyard on a quiet street. Equal Housing Opportunity.
-
2015-06-04price $17,100 154-char remark
Show marketing remark (154 chars)
HUD Case # 105-292370. *HUD HOME SOLD AS-IS* Uninsured (UI). Spacious brick ranch home with a large backyard on a quiet street. Equal Housing Opportunity.
-
2014-10-21price $13,000
-
2012-10-02historical 154-char remark
Show marketing remark (154 chars)
HUD Case # 105-292370. *HUD HOME SOLD AS-IS* Uninsured (UI). Spacious brick ranch home with a large backyard on a quiet street. Equal Housing Opportunity.
-
2012-09-14soldstatus $17,100 Sold
Show marketing remark (154 chars)
HUD Case # 105-292370. *HUD HOME SOLD AS-IS* Uninsured (UI). Spacious brick ranch home with a large backyard on a quiet street. Equal Housing Opportunity.
-
2012-09-14soldstatus $17,100 Sold 154-char remark
Show marketing remark (154 chars)
HUD Case # 105-292370. *HUD HOME SOLD AS-IS* Uninsured (UI). Spacious brick ranch home with a large backyard on a quiet street. Equal Housing Opportunity.
-
2012-09-05status Pending 154-char remark
Show marketing remark (154 chars)
HUD Case # 105-292370. *HUD HOME SOLD AS-IS* Uninsured (UI). Spacious brick ranch home with a large backyard on a quiet street. Equal Housing Opportunity.
-
2012-09-05historical
Show marketing remark (154 chars)
HUD Case # 105-292370. *HUD HOME SOLD AS-IS* Uninsured (UI). Spacious brick ranch home with a large backyard on a quiet street. Equal Housing Opportunity.
-
2012-08-28price $17,100
-
2012-08-09$13,000 New
Show marketing remark (154 chars)
HUD Case # 105-292370. *HUD HOME SOLD AS-IS* Uninsured (UI). Spacious brick ranch home with a large backyard on a quiet street. Equal Housing Opportunity.
-
2012-08-09$13,000 Active 154-char remark
Show marketing remark (154 chars)
HUD Case # 105-292370. *HUD HOME SOLD AS-IS* Uninsured (UI). Spacious brick ranch home with a large backyard on a quiet street. Equal Housing Opportunity.
ⓘ Source: listings_history table (triggers on properties + properties_extension) + one-shot
backfill from property_details.listing_events for pre-trigger history.
Tax reassessment forecast GA · Resets to sale price
- Current annual tax
- $3,600 · $300/mo
- Projected year-2 tax
- $3,600 · $300/mo
- Expected delta
- $0/yr ($0/mo · -0.0%)
ⓘ Screening estimate from a state-policy table — verify with the county assessor before closing.
Climate risk First Street
- Flood 1/10 Low FEMA zone X (unshaded) · 0% chance over 30 yrs
- Wildfire 1/10 Low
- Heat 5/10 Major 7 d/yr ≥104°F today · 18 d/yr by 30 yrs out
- Wind 5/10 Major 26% chance of damaging wind over 30 yrs
- Air quality 4/10 Moderate 4 unhealthy d/yr today · 6 by 30 yrs out
Nearby sold comps map
Loading sold comps map…
Walkable amenities ~0.75 mi
Loading nearby amenities…
Taxation est. · year 1
- Rental income
- $22,099
- − Mortgage interest
- −$11,203
- − Property taxes
- −$3,600
- − Insurance
- −$1,000
- − Repairs & maintenance
- −$1,768
- − Management
- −$1,768
- − Depreciation
- −$5,818
- Taxable loss
- −$3,058
- Est. tax savings @ 24.0%
- +$734
- After-tax cash flow
- $1,006/yr
For passive investors: Depreciation is non-cash, so a rental often shows a tax loss while cash-flowing — sheltering income. Rental losses are passive: they offset passive income freely, and up to $25,000/yr can offset ordinary (W-2) income if you actively participate and your MAGI is under $100k (phasing out to $0 by $150k); unused losses carry forward. On sale, claimed depreciation is recaptured at up to 25%, and gains may owe capital-gains tax (a 1031 exchange can defer both). Figures are a year-1 estimate at your 24.0% rate — not tax advice; consult a CPA.
Schools (NCES district)
- District
- Atlanta Public Schools
- NCES district ID
- 1300120
- Math proficiency
- 28% ▼ -6.00%
- Reading proficiency
- 35% ▼ -2.00%
- Median HH income
- $48,306
- Composite
- 27.27/100
- National rank
- #7006
- State rank
- #80 of 174 in GA
Livability — Atlanta
- Score
- 83/100
- State rank
- #6
- US rank
- #919
Category grades
Schools grade is shown separately in the Schools card above.
Census & demographics
- Census place
- Atlanta, GA
- County
- Fulton County · 1,094,430 people
- City population
- 629,525
- Metro
- Atlanta-Sandy Springs-Alpharetta, GA
- Population (ZIP)
- 34,264
- Household income
- $50,822
- Rent vs Own
- Severe rent burden
- 2962.0
Population outlook (Fulton County) Hauer SSP2
- Today (2025)
- 1,203,707 people
- By 2030
- 1,299,706 · +8.0%
- By 2040
- 1,488,256 · +23.6%
- By 2050
- 1,664,580 · +38.3%
- By 2075
- 2,036,072 · +69.2%
- By 2100
- 2,222,402 · +84.6%
Race, ethnicity, and origin ACS 2023
- Neighborhood character
- Predominantly Black (72%)
- Race & ethnicity
- Black 72% White 14% Hispanic / Latino 10% Two or more races 4%
- Hispanic origin (detail)
- Mexican 4%
- Common ancestry
- Romanian 1% Italian 1% Lithuanian 1%
- Foreign-born
- 5% · Canada
- Languages at home
- 90% English-only · Spanish 9% French/Haitian/Cajun 1%
Political lean MEDSL · Fulton
- 2024 margin
- Solid D (+44.9) · D 71.9% · R 27.0% · Other 1.1%
- 2008→2024 swing
- +9.8pp toward D · 2008: 35.0pp · 2024: 44.9pp
- All cycles
- 2024: D+44.9 2020: D+46.4 2016: D+42.1 2012: D+29.6 2008: D+35.0
Not yet ingested
- Civics
- —
Market trends
- HPI YoY
- ▼ -281.87%
- Current HPI
- 176.673
- Rent YoY
- ▲ 3.23%
- Metro
- Atlanta-Sandy Springs-Alpharetta, GA
- State GDP YoY
- ▲ 2.66%
- F500 in state
- 28
Industry mix (Fortune 500 HQ in GA)
| Industry | F500 HQs | Revenue |
|---|---|---|
| Paper / Packaging | 2 | $29B |
|
||
| Retail | 1 | $160B |
|
||
| Transportation / Logistics | 1 | $91B |
|
||
| Airlines | 1 | $62B |
|
||
| Consumer Goods | 1 | $47B |
|
||
| Utilities | 1 | $25B |
|
||
Price history
+1438.5% since first listed14 events — show timeline
- 2026-04-10 Price Changed $200,000 GAMLS
- 2025-05-30 Listed $210,000 GAMLS
- 2019-12-24 Sold (Public Records) $90,000 Public Records
- 2016-02-10 Price Changed $13,000 FMLS
- 2015-06-04 Price Changed $17,100 FMLS
- 2014-10-21 Price Changed $13,000 GAMLS
- 2012-10-02 Listing Removed — FMLS
- 2012-09-14 Sold (MLS) $17,100 GAMLS
- 2012-09-14 Sold (MLS) $17,100 FMLS
- 2012-09-05 Pending — FMLS
- 2012-09-05 Listing Removed — GAMLS
- 2012-08-28 Price Changed $17,100 GAMLS
- 2012-08-09 Listed $13,000 GAMLS
- 2012-08-09 Listed $13,000 FMLS
Property tax history
+25.1%/yrLatest (2025): $3,600 · -0.1% YoY. Source: county tax records.
Cash-flow waterfall
monthlySold comps — $/sqft
last 12 mo · ≤1 miLoading sold comps…