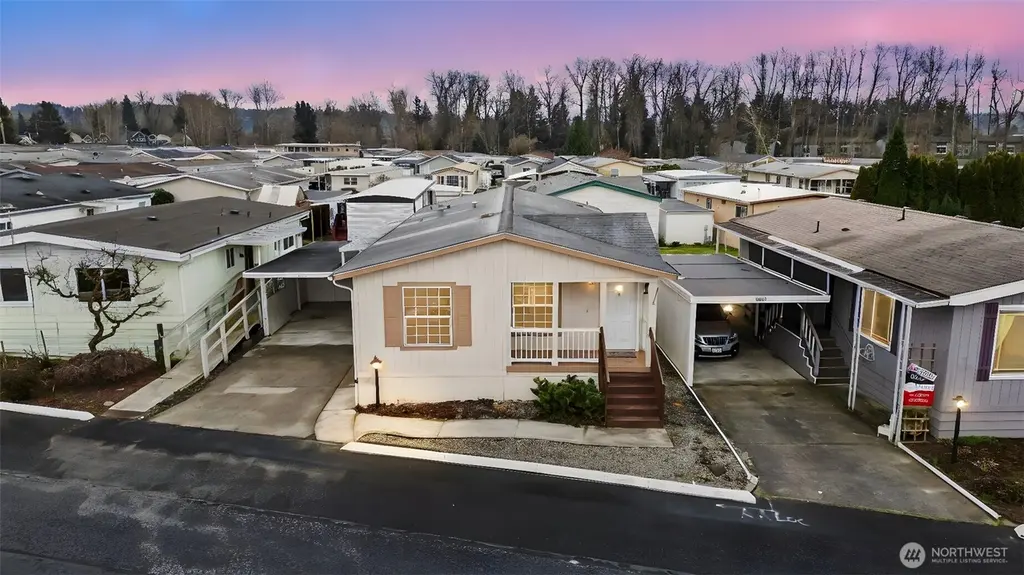
10526 60th Street Ct E #133 · North Puyallup, WA
Flood risk 9/10 · Severe
- FEMA flood zone
- X (unshaded)
- Chance of flooding over 30 yrs
- 0.99%
- Est. flood insurance / yr
- $507 – $1,088
Fire risk 1/10 · Minimal
- Est. fire insurance / yr
- $604 – $1,122
Heat risk 3/10 · Minor
- Hot days now (above 89°F)
- 7 days/yr
- Hot days in 30 yrs
- 16 days/yr
Wind risk 1/10 · Minimal
- Chance of severe wind over 30 yrs
- —
Air-quality risk 7/10 · Major
- Unhealthy air days now
- 11 days/yr
- Unhealthy air days in 30 yrs
- 12 days/yr
Risk factors via First Street. Map © Google.
Why this score? — see what drove the B- grade
The composite is a weighted blend of 9 inputs, each scored 0–100. Each bar is that input's sub-score; the figure is the points it added to the 100-point composite (weight × sub-score).
- Cash flow +30.0/30.0
- 1% rule +10.0/10.0
- DSCR +10.0/10.0
- Schools +5.4/10.0
- Livability +4.2/5.0
- Rent growth +3.6/5.0
- Condition / age +2.5/5.0
- ARV discount +0.0/15.0
- Appreciation +0.0/10.0
$95,000
🖨 Deal sheet 📄 Offer letter ✓ Due diligence
Listing remarks
Experience the perfect blend of comfort and convenience in this impeccably maintained 1,200 sq ft home located in one of Puyallup's premier 55+ communities. Nestled in the heart of downtown, this home has been refreshed with brand-new carpet and refreshed paint creating an airy, "light and bright" atmosphere that feels like home the moment you step inside. The thoughtful floor plan features a large kitchen, huge family room, formal living room, dining room and a full size laundry room as well as 2 spacious bedrooms and 2 bathrooms, the massive primary boasts a huge walk-in closet and an oversized private bathroom, with tons of counter space and a large shower. The secondary bedroo
Key facts
- Huge family room
- Large kitchen
- Dining room
Tags
Neighborhood map
What this means for you Summary
Snapshot
- This is a 3-bed/2.0-bath manufactured listed at $95k.
Deal economics
- At list price, monthly cash flow is $1k ($12k/yr) — positive.
- The deal already cash-flows at list — no discount required.
- Meets the 1% rule at list price ($2k rent vs $95k).
- Recommended offer: $86k (9.0% below list) — sets the bar for market timing.
Location & tenants
- Location reads 85/100 on livability (#25 in WA, #468 nationally) — a professional / high-income tenant draw. Strengths: crime A+, amenities A+, housing A+; Watch: employment C-.
- Puyallup School District (suburban): math 53% / reading 66% proficiency, ranked #52 of 291 in WA (top 18%) — acceptable for families but not a draw, mixed tenant base, ~2y average lease.
- Market conditions: Rents rising fast (+4.5%/yr); 167 active listings in the ZIP; 29 comparable units currently listed for rent nearby; rentals at typical pace (median 18d on market — plan ~3-4 weeks tenant-placement turnaround); solid renter incomes; 3,209 units permitted in Pierce County in 2024 (1,269 in 5+ unit buildings).
Forward outlook
- Local home prices are declining (-3.0%/yr); year-one equity from $657 of loan paydown is wiped out by about $3k of value loss. Plan a longer hold.
- Pierce County population projected at +26% by 2050 — long-run rental-demand tailwind backs the buy-and-hold thesis.
- At projected returns (-3.0% appreciation + 4.5% rent growth), your $27k cash investment doubles in ~3 years — after that, you're playing with house money.
Negotiation context
- It's been on market 105 days — a 9% lower offer ($86k) is reasonable based on typical stale-listing flexibility.
- 2 sale attempts since 13y ago with the ask held roughly flat each time — persistent listings suggest the price (not the market) is what's stuck; bring a comps-based counter.
- Current owner paid $32k; list at $95k implies a 197% gain — meaningful room to come down on a strong offer.
Risks & watch-outs
- Watch-outs: flood insurance adds $66/mo.
- Climate carrying-cost: severe flood risk — expect insurance premiums to compound above CPI over the hold.
Questions for the listing agent
- It's been on market 105 days. Have you received any prior offers? Is the seller open to a 9% concession, seller financing, or rate buy-down credit?
- What's the actual annual flood-insurance premium (NFIP or private), and is the property in a SFHA with mandatory coverage?
- Why hasn't it sold? Are there any deal-killer items the seller is aware of (foundation, flood, title, zoning, code violations)?
- Is there a deadline driving the sale (1031 exchange, divorce, estate, relocation)? That informs how much negotiation room exists.
- What's the average days-on-market for RENTAL listings here right now (not sales)? A rising rental-DOM trend means longer vacancies and softer asking-rent achievability than the comps imply.
- What's the recent tenant-quality profile in this submarket — average credit score on applications, eviction rate, late-payment / NSF rate, and stable-employment percentage? A property-management company in the area should have these aggregated.
- How much new for-sale + rental construction is in the pipeline within 1–3 miles? Heavy new supply typically softens prices + rents 12–24 months out; constrained supply supports both.
Investment metrics
- 1% rule
- 2.35% ✓
- Cap rate
- 19.79%
- Cash-on-cash
- 48.19%
- DSCR
- 3.14
- GRM
- 3.6
CMA / ARV
- ARV (median comp)
- $73,752
- List price
- $95,000
- Delta
- 28.81%
- Verdict
- OVERPRICED
- Comps
- 20 within 1.0 mi
Show comp detail 12 sales within ~0.75 mi
| Address | Dist | Beds/Ba | Sqft | Sold | Price | $/sf | Match |
|---|---|---|---|---|---|---|---|
| 10703 62nd St E #82 | 0.10mi | 3/2.0 | 1,296 (0%) | 6mo | $120,000 | $93 | 90 |
| 10518 60th Street Ct E | 0.02mi | 2/2.0 (-1) | 1,248 (-4%) | 10mo | $45,000 | $36 | 79 |
| 10715 63rd Street Ct E #38 | 0.17mi | 3/2.0 | 1,252 (-3%) | 10mo | $118,000 | $94 | 78 |
| 10702 61st St E #105 | 0.08mi | 3/2.0 | 1,344 (+4%) | 21mo | $129,950 | $97 | 73 |
| 10524 63rd Street Ct E #51 | 0.11mi | 2/2.0 (-1) | 1,147 (-12%) | 4mo | $122,000 | $106 | 68 |
| 10707 60th Street Ct E #151 | 0.08mi | 2/2.0 (-1) | 1,243 (-4%) | 21mo | $125,000 | $101 | 67 |
| 10602 63rd Street Ct E #50 | 0.12mi | 2/2.0 (-1) | 1,244 (-4%) | 20mo | $89,950 | $72 | 66 |
| 6312 107th Ave E #56 | 0.13mi | 2/2.0 (-1) | 1,152 (-11%) | 10mo | $72,500 | $63 | 62 |
| 10517 60th Street Ct E #164 | 0.04mi | 2/2.0 (-1) | 1,119 (-14%) | 13mo | $59,000 | $53 | 60 |
| 10701 63rd St E | 0.12mi | 2/2.0 (-1) | 1,140 (-12%) | 12mo | $60,000 | $53 | 59 |
| 5621 112th Avenue Ct E #20 | 0.42mi | 2/2.0 (-1) | 1,248 (-4%) | 16mo | $148,000 | $119 | 56 |
| 10516 63rd Street Ct E #53 | 0.11mi | 2/2.0 (-1) | 1,109 (-14%) | 15mo | $80,000 | $72 | 54 |
Match score weights: distance 35% · size 25% · config 20% · recency 20%. Top-matched comps best support the ARV.
Projected returns pro-forma
-3.0% appreciation · 4.46% rent growth · sell at horizon
- IRR
- 44.1%
- Equity multiple
- 2.95×
- Total profit
- $51,832
- Equity at exit
- $14,165
- IRR
- 50.8%
- Equity multiple
- 6.33×
- Total profit
- $141,730
- Equity at exit
- $8,214
Cash invested: $26,600 (down + closing). Projections, not guarantees.
Landlord ↔ Tenant lean methodology
- Overall (STATE)
- 28 Tenant-Leaning
- State Washington
- 28 Tenant-Leaning · D+8
- County
- — inherits STATE
- City
- — inherits STATE
ZIP-level market 98372
- Rents YoY
- 4.5%
- Active inventory
- 167
- Price-to-rent
- 3.6×
Monthly cashflow live
- Estimated rent
- $2,229 high interval (Pro) →
- Mortgage (P&I)
- −$498
- Tax from tax record
- −$154 /mo · $1,853/yr
- Insurance
- −$40
- Flood insurance flood zone
- −$66 /mo · $798/yr
- HOA
- −$0
- Vacancy / Maint / Mgmt
- −$468
- Net cashflow
- $1,002
Break-even live
UW: 25.0% down · 7.5% · 30yr · 1.5% tax · 5.0% vac · 8.0% maint · 8.0% mgmt
Financing live
Cash to close
- Down payment
- $23,750
- Closing costs
- $2,850
- Reserves months
- —
- Total cash needed
- —
Loan-product check · same deal, 3 products live
Conventional
25% down · 7.5% · 30yr
- Down + closing
- —
- Monthly P&I
- —
- Monthly cashflow
- —
- DSCR
- —
- Eligible?
- —
Personal DTI + credit; lowest rate.
DSCR
20% down · 8.5% · 30yr
- Down + closing
- —
- Monthly P&I
- —
- Monthly cashflow
- —
- DSCR
- —
- Eligible?
- —
No personal income docs; deal must DSCR.
Hard money
10% down · 12.0% · 12mo
- Down + closing
- —
- Monthly P&I
- —
- Monthly cashflow
- —
- DSCR
- —
- Eligible?
- —
Short-term bridge; refi at stabilization.
Rent comps 29 comps
| Address | Beds | Baths | Sqft | Rent | $/sqft | DOM | Units | Dist |
|---|---|---|---|---|---|---|---|---|
| 407 Valley Ave NE Puyallup, WA | 1.0–3.0 | 1.0–2.0 | 923 | $2,499 | $2.71 | 44d | 1 | 0.40mi |
| 513 5th St NE Puyallup, WA | 3.0 | 1.0 | 1140 | $2,575 | $2.26 | 44d | 1 | 0.47mi |
| 501 2nd Ave NE Puyallup, WA | 1.0–2.0 | 1.0–2.0 | 1506 | $2,299 | $1.53 | 44d | 17 | 0.53mi |
| 501 2nd St NE Puyallup, WA | 1.0–2.0 | 1.0–2.0 | 850 | $2,299 | $2.70 | 5d | 11 | 0.53mi |
| 6808 112th Ave E Unit B Puyallup, WA | 3.0 | 1.5 | 1400 | $2,300 | $1.64 | 44d | 1 | 0.67mi |
| 721 2nd Ave NE Puyallup, WA | 2.0 | 1.5 | 1000 | $1,895 | $1.90 | 24d | 1 | 0.69mi |
| 719 2nd Ave NE Apt 2 Puyallup, WA | 2.0 | 1.5 | 1000 | $1,895 | $1.90 | 5d | 1 | 0.70mi |
| 4908 110th Avenue Ct E #3 Edgewood, WA | 3.0 | 2.0 | 1058 | $2,395 | $2.26 | 12d | 1 | 0.70mi |
| 4908 110th Ave Ct E Edgewood, WA | 3.0 | 2.0 | 1100 | $2,395 | $2.18 | 18d | 1 | 0.70mi |
| 10710 48th St E Unit A Edgewood, WA | 2.0 | 1.0 | 898 | $2,295 | $2.56 | 44d | 1 | 0.77mi |
| 4824 110th Avenue Ct E Edgewood, WA | 1.0–2.0 | 1.0 | 775 | $2,050 | $2.65 | 5d | 3 | 0.78mi |
| 1617 E Main Puyallup, WA | 1.0–2.0 | 1.0–2.0 | 930 | $2,151 | $2.31 | 2d | 30 | 1.01mi |
| 5406 122nd Ave E Unit B Edgewood, WA | 2.0 | 1.0 | 1400 | $2,425 | $1.73 | 5d | 1 | 1.04mi |
| 1017 13th Street Ct NW Puyallup, WA | 3.0 | 2.0 | 1250 | $2,200 | $1.76 | 44d | 1 | 1.06mi |
| 508 11th St NW Unit H Puyallup, WA | 2.0 | 1.0 | 1037 | $1,800 | $1.74 | 17d | 1 | 1.10mi |
| 508 11th St NW Puyallup, WA | 2.0 | 1.0 | 1037 | $2,000 | $1.93 | 44d | 1 | 1.10mi |
| 601 5th St SW Unit C Puyallup, WA | 2.0 | 2.5 | 1450 | $2,450 | $1.69 | 5d | 1 | 1.21mi |
| 507 15th St SE Puyallup, WA | 3.0 | 2.5 | 1737 | $2,750 | $1.58 | 5d | 1 | 1.24mi |
| 516 16th St SE Puyallup, WA | 2.0 | 1.0 | 950 | $1,895 | $1.99 | 24d | 1 | 1.27mi |
| 805 3rd St SW Puyallup, WA | 2.0 | 1.0 | 957 | $1,850 | $1.93 | 44d | 1 | 1.29mi |
| 1218 7th Ave SE Unit 1208 Puyallup, WA | 2.0 | 1.0 | 885 | $2,145 | $2.42 | 24d | 1 | 1.29mi |
| 1402 7th Ave SE Unit B Puyallup, WA | 3.0 | 2.5 | 1351 | $2,300 | $1.70 | 44d | 1 | 1.31mi |
| 322 9th Ave SE Puyallup, WA | 2.0 | 1.0 | 975 | $1,610 | $1.65 | 12d | 3 | 1.34mi |
| 322 9th Ave SE Unit 08 Puyallup, WA | 2.0 | 1.0 | 975 | $1,595 | $1.64 | 5d | 1 | 1.34mi |
| 322 9th Ave SE Apt 9 Puyallup, WA | 2.0 | 1.0 | 975 | $1,550 | $1.59 | 5d | 1 | 1.35mi |
| 931 9th St SE Puyallup, WA | 1.0–2.0 | 1.0 | 784 | $1,845 | $2.35 | 2d | 7 | 1.39mi |
| 1503 18th St NW Puyallup, WA | 1.0–2.0 | 1.0 | 840 | $1,730 | $2.06 | 10d | 4 | 1.41mi |
| 305 13th St SW Unit D Puyallup, WA | 2.0 | 1.5 | 880 | $1,820 | $2.07 | 44d | 1 | 1.41mi |
| 1022 10th Ave SE Puyallup, WA | 2.0 | 1.5 | 1100 | $1,950 | $1.77 | 44d | 1 | 1.49mi |
Listing history 22 events
-
2026-06-18days on market $95,000 Active 105 DOM
-
2026-06-17days on market $95,000 Active 104 DOM
-
2026-06-16days on market $95,000 Active 103 DOM
-
2026-06-15days on market $95,000 Active 102 DOM
-
2026-06-13days on market $95,000 Active 100 DOM
-
2026-06-13days on market $95,000 Active 99 DOM
-
2026-06-09days on market $95,000 Active 96 DOM
-
2026-06-08days on market $95,000 Active 95 DOM
-
2026-06-07days on market $95,000 Active 94 DOM
-
2026-06-04days on market $95,000 Active 91 DOM
-
2026-06-03days on market $95,000 Active 90 DOM
-
2026-06-02days on market $95,000 Active 89 DOM
-
2026-06-02price $95,000 Active 88 DOM
-
2026-06-01days on market $98,450 Active 88 DOM
-
2026-05-31days on market $98,450 Active 87 DOM
-
2026-05-14price $98,450
-
2026-03-05$99,950 Active
-
2013-12-12soldstatus $32,000 Sold
-
2013-11-13status Pending
-
2013-11-05price $29,950
-
2013-08-23price $39,900
-
2013-07-11$59,900 Active
ⓘ Source: listings_history table (triggers on properties + properties_extension) + one-shot
backfill from property_details.listing_events for pre-trigger history.
Tax reassessment forecast WA · Resets to sale price
- Current annual tax
- $1,853 · $154/mo
- Projected year-2 tax
- $1,853 · $154/mo
- Expected delta
- $0/yr ($0/mo · 0.0%)
ⓘ Screening estimate from a state-policy table — verify with the county assessor before closing.
Climate risk First Street
- Flood 9/10 Extreme FEMA zone X (unshaded) · 99% chance over 30 yrs
- Wildfire 1/10 Low
- Heat 3/10 Moderate 7 d/yr ≥89°F today · 16 d/yr by 30 yrs out
- Wind 1/10 Low
- Air quality 7/10 Severe 11 unhealthy d/yr today · 12 by 30 yrs out
Nearby sold comps map
Loading sold comps map…
Walkable amenities ~0.75 mi
Loading nearby amenities…
Taxation est. · year 1
- Rental income
- $26,742
- − Mortgage interest
- −$5,321
- − Property taxes
- −$1,853
- − Insurance
- −$1,272
- − Repairs & maintenance
- −$2,139
- − Management
- −$2,139
- − Depreciation
- −$2,764
- Taxable income
- $11,253
- Est. tax owed @ 24.0%
- −$2,701
- After-tax cash flow
- $9,322/yr
For passive investors: Depreciation is non-cash, so a rental often shows a tax loss while cash-flowing — sheltering income. Rental losses are passive: they offset passive income freely, and up to $25,000/yr can offset ordinary (W-2) income if you actively participate and your MAGI is under $100k (phasing out to $0 by $150k); unused losses carry forward. On sale, claimed depreciation is recaptured at up to 25%, and gains may owe capital-gains tax (a 1031 exchange can defer both). Figures are a year-1 estimate at your 24.0% rate — not tax advice; consult a CPA.
Schools (NCES district)
- District
- Puyallup School District
- NCES district ID
- 5306960
- Math proficiency
- 53% ▬ 0.00%
- Reading proficiency
- 66% ▬ 0.00%
- Median HH income
- $68,291
- Composite
- 54.01/100
- National rank
- #3006
- State rank
- #52 of 291 in WA
Livability — North Puyallup
- Score
- 85/100
- State rank
- #25
- US rank
- #468
Category grades
Schools grade is shown separately in the Schools card above.
Census & demographics
- Census place
- North Puyallup, WA
- County
- Pierce County · 788,257 people
- Metro
- Seattle-Tacoma-Bellevue, WA
- Population (ZIP)
- 26,012
- Household income
- $98,152
- Rent vs Own
- Severe rent burden
- 871.0
Population outlook (Pierce County) Hauer SSP2
- Today (2025)
- 956,648 people
- By 2030
- 1,010,862 · +5.7%
- By 2040
- 1,113,170 · +16.4%
- By 2050
- 1,206,524 · +26.1%
- By 2075
- 1,436,425 · +50.2%
- By 2100
- 1,563,654 · +63.5%
Race, ethnicity, and origin ACS 2023
- Neighborhood character
- Predominantly White (73%)
- Race & ethnicity
- White 73% Two or more races 10% Hispanic / Latino 8% Asian 6% Black 3% Pacific Islander 1%
- Hispanic origin (detail)
- Mexican 5% Puerto Rican 1%
- Common ancestry
- Lithuanian 4% Romanian 4% Subsaharan African 3%
- Foreign-born
- 13% · Canada, South Korea, China
- Languages at home
- 81% English-only · Russian/Polish/Slavic 5% Spanish 4% Other Asian/Pacific 3%
Political lean MEDSL · Pierce
- 2024 margin
- D (+10.8) · D 53.9% · R 43.1% · Other 3.0%
- 2008→2024 swing
- -1.4pp toward R · 2008: 12.2pp · 2024: 10.8pp
- All cycles
- 2024: D+10.8 2020: D+11.2 2016: D+7.5 2012: D+11.0 2008: D+12.2
Not yet ingested
- Civics
- —
Market trends
- HPI YoY
- ▼ -283.81%
- Current HPI
- 309.7871
- Rent YoY
- ▲ 4.46%
- Metro
- Seattle-Tacoma-Bellevue, WA
- State GDP YoY
- ▲ 4.65%
- F500 in state
- 22
Industry mix (Fortune 500 HQ in WA)
| Industry | F500 HQs | Revenue |
|---|---|---|
| Retail | 2 | $269B |
|
||
| Technology / Retail | 1 | $638B |
|
||
| Technology | 1 | $245B |
|
||
| Telecommunications | 1 | $38B |
|
||
| Food / Beverage | 1 | $36B |
|
||
| Automotive / Trucks | 1 | $34B |
|
||
Price history
+64.4% since first listed7 events — show timeline
- 2026-05-14 Price Changed $98,450 NWMLS as Distributed by MLS Grid
- 2026-03-05 Listed $99,950 NWMLS as Distributed by MLS Grid
- 2013-12-12 Sold (MLS) $32,000 NWMLS as Distributed by MLS Grid
- 2013-11-13 Pending — NWMLS as Distributed by MLS Grid
- 2013-11-05 Price Changed $29,950 NWMLS as Distributed by MLS Grid
- 2013-08-23 Price Changed $39,900 NWMLS as Distributed by MLS Grid
- 2013-07-11 Listed $59,900 NWMLS as Distributed by MLS Grid
Property tax history
+5.0%/yrLatest (2026): $1,853 · +0.2% YoY. Source: county tax records.
Cash-flow waterfall
monthlySold comps — $/sqft
last 12 mo · ≤1 miLoading sold comps…