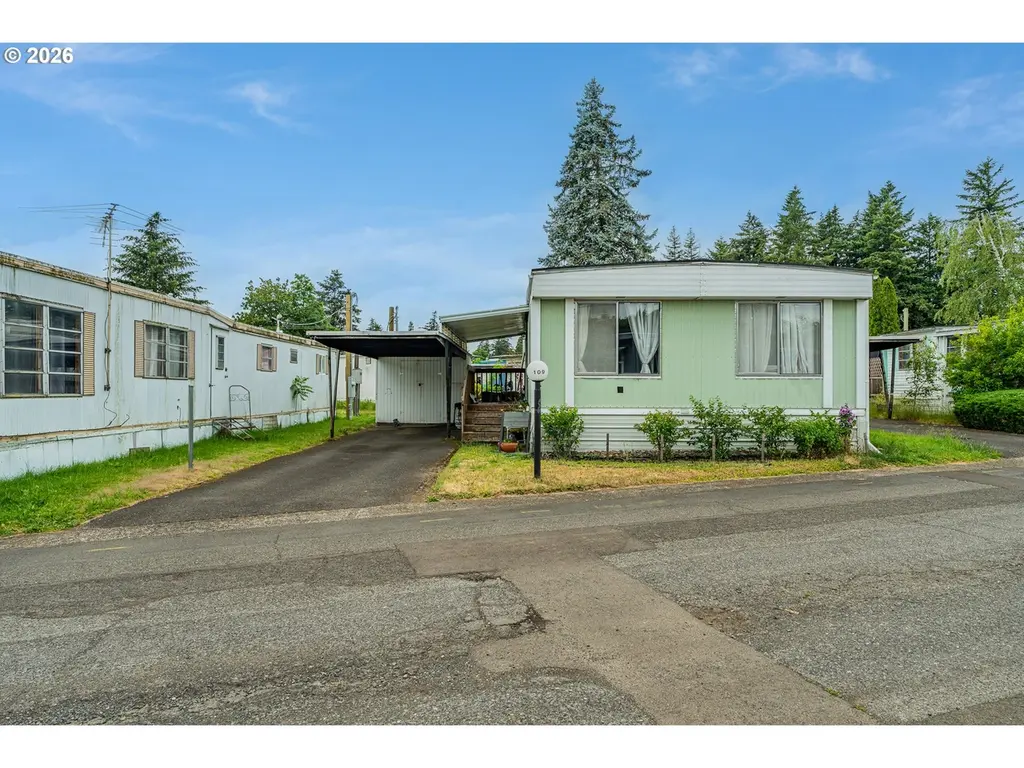
13045 SE Stark St #109 · Portland, OR
Flood risk 1/10 · Minimal
- FEMA flood zone
- X (unshaded)
- Chance of flooding over 30 yrs
- 0.0%
- Est. flood insurance / yr
- $507 – $1,088
Fire risk 1/10 · Minimal
- Est. fire insurance / yr
- $498 – $926
Heat risk 3/10 · Minor
- Hot days now (above 92°F)
- 7 days/yr
- Hot days in 30 yrs
- 15 days/yr
Wind risk 1/10 · Minimal
- Chance of severe wind over 30 yrs
- —
Air-quality risk 10/10 · Severe
- Unhealthy air days now
- 23 days/yr
- Unhealthy air days in 30 yrs
- 27 days/yr
Risk factors via First Street. Map © Google.
Why this score? — see what drove the B grade
The composite is a weighted blend of 9 inputs, each scored 0–100. Each bar is that input's sub-score; the figure is the points it added to the 100-point composite (weight × sub-score).
- Cash flow +30.0/30.0
- 1% rule +10.0/10.0
- DSCR +10.0/10.0
- ARV discount +7.5/15.0
- Livability +3.9/5.0
- Schools +3.7/10.0
- Rent growth +2.7/5.0
- Condition / age +2.5/5.0
- Appreciation +0.0/10.0
$55,000
🖨 Deal sheet 📄 Offer letter ✓ Due diligence
Listing remarks MLS
GREAT PRICE! OWNER SAYS SELL NOW! HUGE PRICE REDUCTION! Double wide in great condition! Rubber roof! Newer central air conditioning and water heater. Spacious living room with large windows for lots of light. Dining room with beautiful built-in hutch. Kitchen with all appliances. Utility room with washer & dryer. Large master bedroom with huge walk-in closet. Good sized 2nd bedroom. Bathroom has updated tub enclosure. Relaxing deck. Grape vine in ez care yard. Space rent includes: Water, sewer & garbage.
Key facts
- Covered carport
- Spacious kitchen
- In-unit laundry
Tags
Property features AI
Finance
- Other: Property is resale and not land-lease; Parcel number M354361
- HOA & community: Located in a manufactured home park; monthly lot rent applies ($1,150/month)
Exterior
- Parking: Carport providing parking for 2 vehicles
- Utilities: Electric fuel; Well water; Public sewer
- Home design: Manufactured home in a park (residential); Single-story (main level living); No notable view
- Construction: Built in 1970; Rubber roof
- Exterior features: Deck; Garden; Metal siding
Interior
- Kitchen: Free-standing range; Free-standing refrigerator; Range hood
- Bedrooms: Primary bedroom on main level with walk-in closet; Second bedroom on main level
- Flooring: Vinyl flooring in living areas and some rooms; Wall-to-wall carpet in primary bedroom
- Bathrooms: 1 full bathroom (main level)
- Heating & cooling: Heat pump for heating and cooling
- Interior features: Vinyl and wall-to-wall carpet flooring; Washer and dryer present; Water softener; Crawl space basement
- Laundry & utility: Washer and dryer in unit; Electric water heater
Neighborhood map
What this means for you Summary
Snapshot
- This is a 2-bed/2.0-bath manufactured listed at $55k.
Deal economics
- At list price, monthly cash flow is $723 ($9k/yr) — positive.
- The deal already cash-flows at list — no discount required.
- Meets the 1% rule at list price ($1k rent vs $55k).
- Recommended offer: $54k (1.5% below list) — sets the bar for market timing.
- Cap rate 22.1% vs local median 2.2% in Portland — top-decile yield for the area; either an underpriced asset or a hidden risk that comps aren't pricing in. Stress-test before assuming the spread holds.
Location & tenants
- Location reads 77/100 on livability (#72 in OR, #3,256 nationally) — a middle-class / working-renter tenant base. Strengths: amenities A+, commute A+, health & safety A+; Watch: crime F, cost of living F.
- David Douglas SD 40 (urban): math 34% / reading 49% proficiency, ranked #99 of 183 in OR (top 54%) — families likely to look elsewhere, expect single-tenant / working-renter base with shorter leases; 68% free/reduced lunch — lower-income household profile, screen leases tightly.
- Zoned schools: Mill Park Elementary School (446 students, 84% FRL); David Douglas High School (2,698 students, 73% FRL).
- Market conditions: Rents flat; 153 active listings in the ZIP; 40 comparable units currently listed for rent nearby; rentals at typical pace (median 24d on market — plan ~3-4 weeks tenant-placement turnaround); 2,041 units permitted in Multnomah County in 2024 (905 in 5+ unit buildings).
Forward outlook
- Local home prices are declining (-3.0%/yr); year-one equity from $380 of loan paydown is wiped out by about $2k of value loss. Plan a longer hold.
- Multnomah County population projected at +33% by 2050 — long-run rental-demand tailwind backs the buy-and-hold thesis.
- At projected returns (-3.0% appreciation + 1.0% rent growth), your $15k cash investment doubles in ~3 years — after that, you're playing with house money.
Negotiation context
- It's been on market 15 days — a 2% lower offer ($54k) is reasonable based on typical stale-listing flexibility.
- 2 sale attempts since 3y ago; this cycle's ask has dropped $5k (8%) from the opening price — seller is motivated, your offer sets the floor, not the list.
- Current owner paid $40k; 38% above their basis — modest negotiation headroom, anchor on the comps not their cost.
Questions for the listing agent
- Built in 1970 — when were the roof, HVAC, electrical panel, plumbing, and water heater last replaced?
- Is there a deadline driving the sale (1031 exchange, divorce, estate, relocation)? That informs how much negotiation room exists.
- Crime grade is F in this area — have there been break-ins, vandalism, or insurance claims at this property in the last 3 years? What carrier currently insures it and at what premium?
- What's the average days-on-market for RENTAL listings here right now (not sales)? A rising rental-DOM trend means longer vacancies and softer asking-rent achievability than the comps imply.
- What's the recent tenant-quality profile in this submarket — average credit score on applications, eviction rate, late-payment / NSF rate, and stable-employment percentage? A property-management company in the area should have these aggregated.
- How much new for-sale + rental construction is in the pipeline within 1–3 miles? Heavy new supply typically softens prices + rents 12–24 months out; constrained supply supports both.
Investment metrics
- 1% rule
- 2.54% ✓
- Cap rate
- 22.07%
- Cash-on-cash
- 56.34%
- DSCR
- 3.51
- GRM
- 3.3
CMA / ARV
No comps found within radius.
Projected returns pro-forma
-3.0% appreciation · 0.96% rent growth · sell at horizon
- IRR
- 52.4%
- Equity multiple
- 3.23×
- Total profit
- $34,352
- Equity at exit
- $8,201
- IRR
- 56.9%
- Equity multiple
- 6.08×
- Total profit
- $78,234
- Equity at exit
- $4,755
Cash invested: $15,400 (down + closing). Projections, not guarantees.
Landlord ↔ Tenant lean methodology
- Overall (CITY)
- 0 Strongly Tenant-Friendly
- State Oregon
- 28 Tenant-Leaning · D+6
- County
- — inherits STATE
- City Portland
- 0 Strongly Tenant-Friendly · D+39
ZIP-level market 97233
- Rents YoY
- 1.0%
- Active inventory
- 153
- Price-to-rent
- 3.3×
Monthly cashflow live
- Estimated rent
- $1,396 high interval (Pro) →
- Mortgage (P&I)
- −$288
- Tax est. 1.5%
- −$69 /mo · $825/yr
- Insurance
- −$23
- HOA
- −$0
- Vacancy / Maint / Mgmt
- −$293
- Net cashflow
- $723
Break-even live
UW: 25.0% down · 7.5% · 30yr · 1.5% tax · 5.0% vac · 8.0% maint · 8.0% mgmt
Financing live
Cash to close
- Down payment
- $13,750
- Closing costs
- $1,650
- Reserves months
- —
- Total cash needed
- —
Loan-product check · same deal, 3 products live
Conventional
25% down · 7.5% · 30yr
- Down + closing
- —
- Monthly P&I
- —
- Monthly cashflow
- —
- DSCR
- —
- Eligible?
- —
Personal DTI + credit; lowest rate.
DSCR
20% down · 8.5% · 30yr
- Down + closing
- —
- Monthly P&I
- —
- Monthly cashflow
- —
- DSCR
- —
- Eligible?
- —
No personal income docs; deal must DSCR.
Hard money
10% down · 12.0% · 12mo
- Down + closing
- —
- Monthly P&I
- —
- Monthly cashflow
- —
- DSCR
- —
- Eligible?
- —
Short-term bridge; refi at stabilization.
Rent comps 40 comps
| Address | Beds | Baths | Sqft | Rent | $/sqft | DOM | Units | Dist |
|---|---|---|---|---|---|---|---|---|
| 13110 SE Stark St Unit 02 Portland, OR | 2.0 | 1.0 | 750 | $1,450 | $1.93 | 44d | 1 | 0.08mi |
| 13110 SE Stark St Unit 13 Portland, OR | 2.0 | 1.0 | 750 | $1,375 | $1.83 | 4d | 1 | 0.08mi |
| 450 SE 127th Ave Unit 316 Portland, OR | 1.0 | 1.0 | 605 | $1,100 | $1.82 | 8d | 1 | 0.11mi |
| 450 SE 127th Ave Unit 319 Portland, OR | 1.0 | 1.0 | 605 | $1,300 | $2.15 | 44d | 1 | 0.11mi |
| 450 SE 127th Ave Unit 216 Portland, OR | 1.0 | 1.0 | 605 | $1,100 | $1.82 | 10d | 1 | 0.11mi |
| 450 SE 127th Ave Unit 314 Portland, OR | 1.0 | 1.0 | 605 | $1,175 | $1.94 | 4d | 1 | 0.11mi |
| 12621 SE Stark St Portland, OR | 1.0–2.0 | 1.0 | 564 | $1,131 | $2.01 | 44d | 1 | 0.16mi |
| 303 SE 126th Ave Unit 20 Portland, OR | 1.0 | 1.0 | 550 | $1,200 | $2.18 | 2d | 1 | 0.20mi |
| 12520 SE Stark St Unit 01 Portland, OR | 2.0 | 1.0 | 915 | $1,499 | $1.64 | 2d | 1 | 0.21mi |
| 12520 SE Stark St Unit 06 Portland, OR | 2.0 | 1.0 | 915 | $1,499 | $1.64 | 44d | 1 | 0.21mi |
| 12636 SE Alder St Portland, OR | 1.0–2.0 | 1.0–2.0 | 840 | $1,550 | $1.85 | 3d | 3 | 0.22mi |
| 13400 SE Stark St Unit 08 Portland, OR | 1.0 | 1.0 | 600 | $1,150 | $1.92 | 44d | 1 | 0.24mi |
| 13441 SE Stark St Portland, OR | 2.0 | 1.0 | 850 | $1,125 | $1.32 | 44d | 1 | 0.24mi |
| 13437 SE Stark St Portland, OR | 2.0 | 1.0 | 850 | $1,125 | $1.32 | 44d | 1 | 0.24mi |
| 13210 E Burnside St Unit 13210 Portland, OR | 1.0 | 1.0 | 589 | $995 | $1.69 | 22d | 1 | 0.26mi |
| 13202 NE Couch St Portland, OR | 3.0 | 1.0 | 1053 | $2,500 | $2.37 | 44d | 1 | 0.33mi |
| 515 SE 137th Ave Portland, OR | 2.0 | 1.0 | 929 | $1,325 | $1.43 | 44d | 1 | 0.33mi |
| 13625 SE Stark St Unit 35 Portland, OR | 2.0 | 1.5 | 900 | $1,500 | $1.67 | 18d | 1 | 0.34mi |
| 13625 SE Stark St Portland, OR | 2.0 | 1.0 | 900 | $1,500 | $1.67 | 3d | 1 | 0.35mi |
| 13625 SE Stark St Portland, OR | 1.0 | 1.0 | 675 | $1,150 | $1.70 | 3d | 1 | 0.35mi |
| 13625 SE Stark St Portland, OR | 1.0 | 1.0 | 675 | $1,150 | $1.70 | 24d | 1 | 0.35mi |
| 13625 SE Stark St Portland, OR | 1.0–2.0 | 1.0–1.5 | 787 | $1,500 | $1.90 | 8d | 5 | 0.35mi |
| 611 SE 139th Ave Unit 11 Portland, OR | 2.0 | 1.0 | 820 | $1,495 | $1.82 | 44d | 1 | 0.39mi |
| 1010 SE 122nd Ave Portland, OR | 2.0 | 1.0 | 865 | $1,350 | $1.56 | 16d | 1 | 0.39mi |
| 1403 SE 130th Ave Unit 1403 Portland, OR | 2.0 | 1.0 | 925 | $1,565 | $1.69 | 44d | 1 | 0.40mi |
| 333 SE 139th Ave Portland, OR | 2.0 | 1.0 | 850 | $1,575 | $1.85 | 44d | 1 | 0.40mi |
| 1411 SE 130th Ave Unit 1411 Portland, OR | 2.0 | 1.0 | 925 | $1,565 | $1.69 | 44d | 1 | 0.42mi |
| 13801 SE Stark St Unit 13853 Portland, OR | 2.0 | 1.0 | 820 | $1,350 | $1.65 | 24d | 1 | 0.42mi |
| 13801 SE Stark St Unit 13843 Portland, OR | 2.0 | 1.0 | 820 | $1,400 | $1.71 | 44d | 1 | 0.42mi |
| 13801 SE Stark St Unit 13829 Portland, OR | 2.0 | 1.0 | 820 | $1,375 | $1.68 | 2d | 1 | 0.42mi |
| 13801 SE Stark St Unit 13837 Portland, OR | 2.0 | 1.0 | 820 | $1,375 | $1.68 | 10d | 1 | 0.42mi |
| 12102 SE Pine St Portland, OR | 2.0 | 1.5 | 814 | $1,895 | $2.33 | 24d | 1 | 0.43mi |
| 336 NE 128th Ave Portland, OR | 3.0 | 1.0 | 1020 | $2,445 | $2.40 | 24d | 1 | 0.44mi |
| 12026 SE Ash St Unit 214 Portland, OR | 2.0 | 1.0 | 700 | $1,300 | $1.86 | 44d | 1 | 0.46mi |
| 12026 SE Ash St Unit 105 Portland, OR | 1.0 | 1.0 | 615 | $1,100 | $1.79 | 22d | 1 | 0.46mi |
| 12026 SE Ash St Unit 207 Portland, OR | 2.0 | 1.0 | 700 | $1,200 | $1.71 | 24d | 1 | 0.46mi |
| 12026 SE Ash St Apt 213 Portland, OR | 2.0 | 1.0 | 700 | $1,350 | $1.93 | 12d | 1 | 0.46mi |
| 12110 E Burnside St Portland, OR | 2.0 | 1.0 | 907 | $1,372 | $1.51 | 3d | 3 | 0.47mi |
| 11940 SE Ash St Unit 204 Portland, OR | 2.0 | 1.0 | 860 | $1,399 | $1.63 | 24d | 1 | 0.48mi |
| 1021 SE 122nd Ave Portland, OR | 2.0 | 1.0 | 875 | $1,495 | $1.71 | 12d | 1 | 0.49mi |
Listing history 10 events
-
2026-06-18days on market $55,000 Active 15 DOM
-
2026-06-17pricedays on market $55,000 Active 14 DOM
-
2026-06-16days on market $60,000 Active 13 DOM
-
2026-06-15days on market $60,000 Active 12 DOM
-
2026-06-13days on market $60,000 Active 10 DOM
-
2026-06-09days on market $60,000 Active 6 DOM
-
2026-06-08days on market $60,000 Active 5 DOM
-
2026-06-07days on market $60,000 Active 4 DOM
-
2026-06-05remarks 547-char remark
-
2026-06-05$60,000 Active 1 DOM
ⓘ Source: listings_history table (triggers on properties + properties_extension) + one-shot
backfill from property_details.listing_events for pre-trigger history.
Climate risk First Street
- Flood 1/10 Low FEMA zone X (unshaded) · 0% chance over 30 yrs
- Wildfire 1/10 Low
- Heat 3/10 Moderate 7 d/yr ≥92°F today · 15 d/yr by 30 yrs out
- Wind 1/10 Low
- Air quality 10/10 Extreme 23 unhealthy d/yr today · 27 by 30 yrs out
Nearby sold comps map
Loading sold comps map…
Walkable amenities ~0.75 mi
Loading nearby amenities…
Taxation est. · year 1
- Rental income
- $16,757
- − Mortgage interest
- −$3,081
- − Property taxes
- −$825
- − Insurance
- −$275
- − Repairs & maintenance
- −$1,341
- − Management
- −$1,341
- − Depreciation
- −$1,600
- Taxable income
- $8,295
- Est. tax owed @ 24.0%
- −$1,991
- After-tax cash flow
- $6,686/yr
For passive investors: Depreciation is non-cash, so a rental often shows a tax loss while cash-flowing — sheltering income. Rental losses are passive: they offset passive income freely, and up to $25,000/yr can offset ordinary (W-2) income if you actively participate and your MAGI is under $100k (phasing out to $0 by $150k); unused losses carry forward. On sale, claimed depreciation is recaptured at up to 25%, and gains may owe capital-gains tax (a 1031 exchange can defer both). Figures are a year-1 estimate at your 24.0% rate — not tax advice; consult a CPA.
Schools (NCES district)
- District
- David Douglas SD 40
- NCES district ID
- 4103940
- Math proficiency
- 34% ▲ 1.00%
- Reading proficiency
- 49% ▲ 1.00%
- Median HH income
- $42,781
- Composite
- 37.38/100
- National rank
- #8926
- State rank
- #99 of 183 in OR
Livability — Portland
- Score
- 77/100
- State rank
- #72
- US rank
- #3256
Category grades
Schools grade is shown separately in the Schools card above.
Census & demographics
- Census place
- Portland, OR
- County
- Multnomah County · 786,692 people
- City population
- 774,334
- Metro
- Portland-Vancouver-Hillsboro, OR-WA
- Population (ZIP)
- 36,236
- Household income
- $60,198
- Rent vs Own
- Severe rent burden
- 2541.0
Population outlook (Multnomah County) Hauer SSP2
- Today (2025)
- 930,825 people
- By 2030
- 996,904 · +7.1%
- By 2040
- 1,121,379 · +20.5%
- By 2050
- 1,242,124 · +33.4%
- By 2075
- 1,464,431 · +57.3%
- By 2100
- 1,576,181 · +69.3%
Race, ethnicity, and origin ACS 2023
- Neighborhood character
- Diverse neighborhood (Simpson 0.67)
- Race & ethnicity
- White 51% Hispanic / Latino 23% Two or more races 13% Asian 9% Black 9% Native American 2%
- Hispanic origin (detail)
- Mexican 19%
- Common ancestry
- Scotch-Irish 4% Portuguese 3% Subsaharan African 3%
- Foreign-born
- 25% · Canada, Vietnam, China
- Languages at home
- 61% English-only · Spanish 18% Russian/Polish/Slavic 7% Other Asian/Pacific 3%
Political lean MEDSL · Multnomah
- 2024 margin
- Solid D (+62.1) · D 79.3% · R 17.2% · Other 3.5%
- 2008→2024 swing
- +6.0pp toward D · 2008: 56.1pp · 2024: 62.1pp
- All cycles
- 2024: D+62.1 2020: D+61.3 2016: D+58.3 2012: D+54.9 2008: D+56.1
Not yet ingested
- Civics
- —
Market trends
- HPI YoY
- ▼ -493.14%
- Current HPI
- 302.1015
- Rent YoY
- ▲ 0.96%
- Metro
- Portland-Vancouver-Hillsboro, OR-WA
- State GDP YoY
- ▲ 2.05%
- F500 in state
- 2
Industry mix (Fortune 500 HQ in OR)
| Industry | F500 HQs | Revenue |
|---|---|---|
| Consumer Goods | 1 | $51B |
|
||
Price history
+20.0% since first listed5 events — show timeline
- 2026-06-03 Listed $60,000 RMLS
- 2023-09-27 Sold (MLS) $39,985 RMLS
- 2023-09-02 Pending — RMLS
- 2023-08-25 Price Changed $39,985 RMLS
- 2023-08-11 Listed $49,985 RMLS
Property tax history
-41.1%/yrLatest (2015): $6 · +0.0% YoY. Source: county tax records.
Cash-flow waterfall
monthlySold comps — $/sqft
last 12 mo · ≤1 miLoading sold comps…