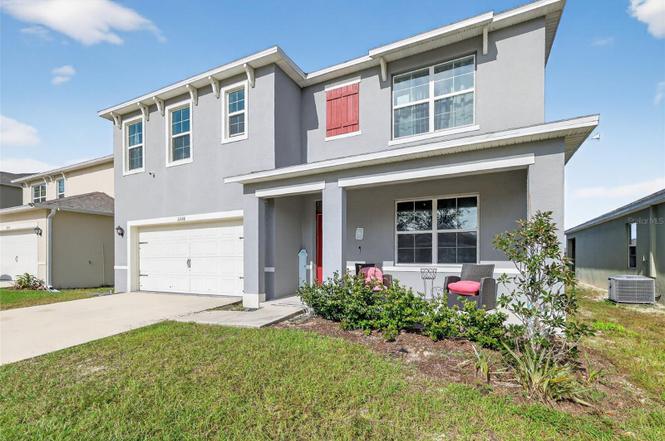
11338 Amber Ridge Dr · Zellwood, FL
Flood risk 1/10 · Minimal
- FEMA flood zone
- X (unshaded)
- Chance of flooding over 30 yrs
- 0.0%
- Est. flood insurance / yr
- $507 – $1,088
Fire risk 5/10 · Moderate
- Est. fire insurance / yr
- $947 – $1,759
Heat risk 8/10 · Major
- Hot days now (above 108°F)
- 7 days/yr
- Hot days in 30 yrs
- 22 days/yr
Wind risk 9/10 · Severe
- Chance of severe wind over 30 yrs
- 99.0%
Air-quality risk 1/10 · Minimal
- Unhealthy air days now
- 0 days/yr
- Unhealthy air days in 30 yrs
- 0 days/yr
Risk factors via First Street. Map © Google.
Why this score? — see what drove the D grade
The composite is a weighted blend of 9 inputs, each scored 0–100. Each bar is that input's sub-score; the figure is the points it added to the 100-point composite (weight × sub-score).
- Cash flow +8.3/30.0
- ARV discount +7.5/15.0
- Appreciation +6.3/10.0
- Schools +4.1/10.0
- Livability +3.8/5.0
- 1% rule +3.2/10.0
- Rent growth +2.5/5.0
- Condition / age +2.5/5.0
- DSCR +2.3/10.0
$389,000
🖨 Deal sheet (PDF) 📄 Offer letter ✓ Due diligence
Listing remarks
Under contract-accepting backup offers. Short Sale. Make an Offer. .Welcome to 11338 Amber Ridge Drive, located in Westridge Park, a sought-after community in Zellwood, offering small-town character and proximity to the historic Zellwood Corn Festival grounds, along with nearby shopping, dining, and major transportation routes. This expansive five-bedroom, three-bath Hayden floor plan offers a refined balance of space, functionality, and modern design. The second level features four well-appointed bedrooms, including a generous primary suite with two oversized walk-in closets and a spa-inspired bath with dual vanities. A spacious loft provides flexibility for a media room, home office, or s
Key facts
- Spacious backyard
- Community amenities
- Pool and playground
Tags
Neighborhood map
What this means for you Summary
Snapshot
- This is a 5-bed/3.0-bath single-family listed at $389k.
Deal economics
- At list price, monthly cash flow is $-353 ($-4k/yr) — negative.
- To cash-flow at today's rent, offer at most $327k (16.0% below list).
- To meet the 1% rule (rent ≥ 1% of price), the offer needs to be $318k (18.2% below list).
- Recommended offer: $318k (18.2% below list) — sets the bar for 1% rule.
Location & tenants
- Location reads 75/100 on livability (#248 in FL, #3,918 nationally) — a middle-class / working-renter tenant base. Strengths: crime A+, cost of living A+, housing A+; Watch: amenities F, commute D-, health & safety D-.
- Orange (suburban): math 46% / reading 51% proficiency, ranked #43 of 73 in FL (top 59%) — families likely to look elsewhere, expect single-tenant / working-renter base with shorter leases.
- Zoned schools: Zellwood Elementary (math 38% / reading 40%, grade F, #1,560 of 2,144 statewide, top 73%, 493 students, 55% FRL); Wolf Lake Middle (math 57% / reading 52%, grade B-, #183 of 571 statewide, top 34%, 1,194 students, 45% FRL); Apopka High (math 19% / reading 47%, grade F, #406 of 667 statewide, top 61%, 3,507 students, 42% FRL).
- Market conditions: 104 active listings in the ZIP; 4 comparable units currently listed for rent nearby; rentals at typical pace (median 16d on market — plan ~3-4 weeks tenant-placement turnaround); 8,053 units permitted in Orange County in 2024 (3,133 in 5+ unit buildings).
Forward outlook
- In year one you build about $12k of equity ($3k loan paydown + $10k appreciation (2.5% local appreciation)).
- Orange County population projected at +52% by 2050 — long-run rental-demand tailwind backs the buy-and-hold thesis.
- By year 3, paydown + projected appreciation supports a ~$31k cash-out refi (75% LTV) — recoverable capital for the next deal without selling this one.
Negotiation context
- It's been on market 45 days — a 3% lower offer ($377k) is reasonable based on typical stale-listing flexibility.
Risks & watch-outs
- Climate carrying-cost: severe wind risk, 99% chance of damaging wind over 30y; moderate wildfire risk; extreme-heat days projected 7→22/yr by 2055 (HVAC capex compounding) — expect insurance premiums to compound above CPI over the hold.
Questions for the listing agent
- What do current leases actually rent for vs. the listed asking? Can we see a recent rent roll and the last 12 months of T-12 income?
- It's been on market 45 days. Have you received any prior offers? Is the seller open to a 18% concession, seller financing, or rate buy-down credit?
- What does the HOA fee cover, when was the last increase, and are there any pending special assessments or reserve-fund shortfalls?
- Is there a deadline driving the sale (1031 exchange, divorce, estate, relocation)? That informs how much negotiation room exists.
- Schools are D-rated, which usually means shorter tenancies and higher turnover. Who's the typical renter profile here, and what's been the actual vacancy rate?
- The area grade is low — what's the realistic commute time and amenity access for the typical tenant pool here? Any planned neighborhood developments (good or bad) we should know about?
- What's the average days-on-market for RENTAL listings here right now (not sales)? A rising rental-DOM trend means longer vacancies and softer asking-rent achievability than the comps imply.
- What's the recent tenant-quality profile in this submarket — average credit score on applications, eviction rate, late-payment / NSF rate, and stable-employment percentage? A property-management company in the area should have these aggregated.
- How much new for-sale + rental construction is in the pipeline within 1–3 miles? Heavy new supply typically softens prices + rents 12–24 months out; constrained supply supports both.
Investment metrics
- 1% rule
- 0.82% ✗
- Cap rate
- 5.20%
- Cash-on-cash
- -3.89%
- DSCR
- 0.83
- GRM
- 10.2
CMA / ARV
No comps found within radius.
Projected returns pro-forma
2.5% appreciation · 3.0% rent growth · sell at horizon
- IRR
- 2.4%
- Equity multiple
- 1.13×
- Total profit
- $14,378
- Equity at exit
- $164,121
- IRR
- 6.1%
- Equity multiple
- 1.88×
- Total profit
- $95,865
- Equity at exit
- $244,840
Cash invested: $108,920 (down + closing). Projections, not guarantees.
Landlord ↔ Tenant lean methodology
- Overall (STATE)
- 87 Strongly Landlord-Friendly
- State Florida
- 87 Strongly Landlord-Friendly · R+3
- County
- — inherits STATE
- City
- — inherits STATE
ZIP-level market 32798
- Home prices YoY
- 1.0%
- Active inventory
- 104
- Price-to-rent
- 10.2×
Monthly cashflow live
- Estimated rent
- $3,182 medium interval (Pro) →
- Mortgage (P&I)
- −$2,040
- Tax from tax record
- −$599 /mo · $7,190/yr
- Insurance
- −$162
- HOA
- −$66
- Vacancy / Maint / Mgmt
- −$668
- Net cashflow
- $-353
Break-even live
Sensitivity live
| Price | -10% $-133 | -5% $-243 | +0% $-353 | +5% $-463 | +10% $-573 |
|---|---|---|---|---|---|
| Rent | -10% $-605 | -5% $-479 | +0% $-353 | +5% $-228 | +10% $-102 |
| Rate | -1.0pp $-157 | -0.5pp $-254 | base $-353 | +0.5pp $-454 | +1.0pp $-557 |
UW: 25.0% down · 7.5% · 30yr · 1.5% tax · 5.0% vac · 8.0% maint · 8.0% mgmt
Financing live
Cash to close
- Down payment
- $97,250
- Closing costs
- $11,670
- Reserves months
- —
- Total cash needed
- —
Loan-product check · same deal, 3 products live
Conventional
25% down · 7.5% · 30yr
- Down + closing
- —
- Monthly P&I
- —
- Monthly cashflow
- —
- DSCR
- —
- Eligible?
- —
Personal DTI + credit; lowest rate.
DSCR
20% down · 8.5% · 30yr
- Down + closing
- —
- Monthly P&I
- —
- Monthly cashflow
- —
- DSCR
- —
- Eligible?
- —
No personal income docs; deal must DSCR.
Hard money
10% down · 12.0% · 12mo
- Down + closing
- —
- Monthly P&I
- —
- Monthly cashflow
- —
- DSCR
- —
- Eligible?
- —
Short-term bridge; refi at stabilization.
Rent comps 4 comps
| Address | Beds | Baths | Sqft | Rent | $/sqft | DOM | Units | Dist |
|---|---|---|---|---|---|---|---|---|
| 11338 Amber Ridge Dr Zellwood, FL | 5.0 | 3.0 | 2674 | $3,200 | $1.20 | 0d | 1 | 0.03mi |
| 2796 Grassmoor Loop Apopka, FL | 4.0 | 2.0 | 2365 | $2,636 | $1.11 | 0d | 1 | 1.35mi |
| 4067 Meandering Bay Dr Apopka, FL | 5.0 | 3.5 | 3544 | $3,890 | $1.10 | 16d | 1 | 1.37mi |
| 2407 Palmetto Ridge Cir Apopka, FL | 4.0 | 2.0 | 1885 | $2,800 | $1.49 | 19d | 1 | 1.42mi |
HOA detail
- Monthly dues
- $66 · $792/yr
- Likely covers
- landscaping
Listing history 4 events
-
2026-01-31status Pending
-
2026-01-23price $389,000
-
2026-01-23price $399,000
-
2025-12-12$410,000 Active
ⓘ Source: listings_history table (triggers on properties + properties_extension) + one-shot
backfill from property_details.listing_events for pre-trigger history.
Tax reassessment forecast FL · Resets to sale price
- Current annual tax
- $7,190 · $599/mo
- Projected year-2 tax
- $7,190 · $599/mo
- Expected delta
- $0/yr ($0/mo · 0.0%)
ⓘ Screening estimate from a state-policy table — verify with the county assessor before closing.
Climate risk First Street
- Flood 1/10 Low FEMA zone X (unshaded) · 0% chance over 30 yrs
- Wildfire 5/10 Major
- Heat 8/10 Severe 7 d/yr ≥108°F today · 22 d/yr by 30 yrs out
- Wind 9/10 Extreme 99% chance of damaging wind over 30 yrs
- Air quality 1/10 Low 0 unhealthy d/yr today · 0 by 30 yrs out
Nearby sold comps map
Loading sold comps map…
Walkable amenities ~0.75 mi
Loading nearby amenities…
Taxation est. · year 1
- Rental income
- $38,187
- − Mortgage interest
- −$21,790
- − Property taxes
- −$7,190
- − Insurance
- −$1,945
- − Repairs & maintenance
- −$3,055
- − Management
- −$3,055
- − HOA
- −$792
- − Depreciation
- −$11,316
- Taxable loss
- −$10,956
- Est. tax savings @ 24.0%
- +$2,630
- After-tax cash flow
- $-1,609/yr
For passive investors: Depreciation is non-cash, so a rental often shows a tax loss while cash-flowing — sheltering income. Rental losses are passive: they offset passive income freely, and up to $25,000/yr can offset ordinary (W-2) income if you actively participate and your MAGI is under $100k (phasing out to $0 by $150k); unused losses carry forward. On sale, claimed depreciation is recaptured at up to 25%, and gains may owe capital-gains tax (a 1031 exchange can defer both). Figures are a year-1 estimate at your 24.0% rate — not tax advice; consult a CPA.
Schools (NCES district)
- District
- Orange
- NCES district ID
- 1201440
- Math proficiency
- 46% ▼ -9.00%
- Reading proficiency
- 51% ▼ -2.00%
- Median HH income
- $49,350
- Composite
- 41.47/100
- National rank
- #3461
- State rank
- #43 of 73 in FL
Livability — Zellwood
- Score
- 75/100
- State rank
- #248
- US rank
- #3918
Category grades
Schools grade is shown separately in the Schools card above.
Census & demographics
- Census place
- Zellwood, FL
- City population
- 2,159
- Population (ZIP)
- 2,159
Population outlook (Orange County) Hauer SSP2
- Today (2025)
- 1,618,226 people
- By 2030
- 1,787,404 · +10.5%
- By 2040
- 2,125,621 · +31.4%
- By 2050
- 2,454,016 · +51.6%
- By 2075
- 3,173,711 · +96.1%
- By 2100
- 3,607,781 · +122.9%
Race, ethnicity, and origin ACS 2023
- Neighborhood character
- Predominantly White (86%)
- Race & ethnicity
- White 86% Hispanic / Latino 10% Two or more races 8%
- Hispanic origin (detail)
- Puerto Rican 10%
- Common ancestry
- Iranian 5% Lithuanian 5% Romanian 2%
- Foreign-born
- 5%
- Languages at home
- 89% English-only · Spanish 9% German/W. Germanic 3%
Political lean MEDSL · Orange
- 2024 margin
- D (+13.6) · D 56.1% · R 42.5% · Other 1.3%
- 2008→2024 swing
- -5.0pp toward R · 2008: 18.6pp · 2024: 13.6pp
- All cycles
- 2024: D+13.6 2020: D+23.1 2016: D+24.6 2012: D+18.2 2008: D+18.6
Not yet ingested
- Civics
- —
Market trends
- HPI YoY
- ▲ 2.50%
- Current HPI
- 254.7681
- Rent YoY
- —
- Metro
- —
- State GDP YoY
- ▲ 3.28%
- F500 in state
- 36
Industry mix (Fortune 500 HQ in FL)
| Industry | F500 HQs | Revenue |
|---|---|---|
| Industrial Technology | 2 | $29B |
|
||
| Insurance | 2 | $17B |
|
||
| Retail | 1 | $60B |
|
||
| Technology Distribution | 1 | $58B |
|
||
| Homebuilding | 1 | $35B |
|
||
| Technology Manufacturing | 1 | $35B |
|
||
Price history
-5.1% since first listed4 events — show timeline
- 2026-01-31 Pending — Stellar MLS as Distributed by MLS Grid
- 2026-01-23 Price Changed $389,000 Stellar MLS as Distributed by MLS Grid
- 2026-01-23 Price Changed $399,000 Stellar MLS as Distributed by MLS Grid
- 2025-12-12 Listed $410,000 Stellar MLS as Distributed by MLS Grid
Property tax history
+128.7%/yrLatest (2025): $7,190 · -9.3% YoY. Source: county tax records.
Cash-flow waterfall
monthlySold comps — $/sqft
last 12 mo · ≤1 miLoading sold comps…