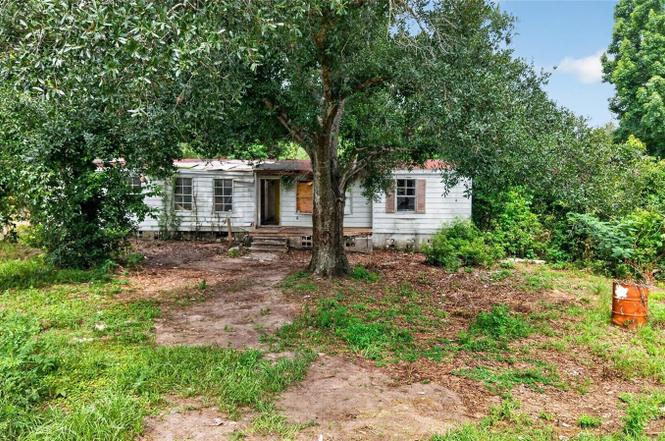
8608 Hamster Dr · Zephyrhills, FL
Flood risk 1/10 · Minimal
- FEMA flood zone
- X (unshaded)
- Chance of flooding over 30 yrs
- 0.0%
- Est. flood insurance / yr
- $507 – $1,088
Fire risk 5/10 · Moderate
- Est. fire insurance / yr
- $947 – $1,759
Heat risk 9/10 · Severe
- Hot days now (above 108°F)
- 7 days/yr
- Hot days in 30 yrs
- 24 days/yr
Wind risk 10/10 · Severe
- Chance of severe wind over 30 yrs
- 99.0%
Air-quality risk 2/10 · Minimal
- Unhealthy air days now
- 1 days/yr
- Unhealthy air days in 30 yrs
- 1 days/yr
Risk factors via First Street. Map © Google.
Why this score? — see what drove the B+ grade
The composite is a weighted blend of 9 inputs, each scored 0–100. Each bar is that input's sub-score; the figure is the points it added to the 100-point composite (weight × sub-score).
- Cash flow +30.0/30.0
- ARV discount +14.5/15.0
- 1% rule +10.0/10.0
- DSCR +10.0/10.0
- Schools +4.3/10.0
- Livability +3.6/5.0
- Rent growth +2.5/5.0
- Condition / age +2.5/5.0
- Appreciation +0.0/10.0
$167,900
🖨 Deal sheet 📄 Offer letter ✓ Due diligence
Listing remarks
HANDYMAN SPECIAL on 2 acres with NO HOA and NO lot rent! * * Lot can be split into Two, 1 acre Each (Buyers to do their own due diligence) * * Bring your vision and unlock the potential of this unique property at 8608 Hamster Drive in Zephyrhills. Situated on an oversized 2-acre parcel, this fixer-upper offers the rare opportunity to create your ideal homestead, investment property, or renovation project while enjoying the freedom and privacy that acreage provides. The existing home is ready for updates and improvements, making it a great opportunity for investors, flippers, or buyers looking to put their personal touch on a property with incredible upside. A major bonus is the RELATIVEL
Key facts
- New well
- 2 acres
- Room for workshops
Tags
Property features AI
Finance
- Other: Lot approximately 2 acres (dimensions 330 x 264); Zoned AR (agricultural/residential)
- Financial info: No investor or income/expense details provided
- HOA & community: No HOA
Exterior
- Parking: No parking details provided
- Security: No security features listed
- Utilities: Well water; Septic tank; Electricity available
- Home design: Manufactured double-wide home; Single-story; Faces east; Property listed as fixer condition
- Construction: Metal siding; Shingle roof; Crawlspace foundation; Built area and living area reported (building area total 1,656; living area 1,344)
- Exterior features: Dirt road access
Interior
- Kitchen: No appliances listed
- Bedrooms: 3 bedrooms
- Flooring: Other flooring
- Bathrooms: 2 full bathrooms
- Heating & cooling: No heating specified; No cooling specified
- Interior features: No interior features specified
- Laundry & utility: No laundry features
Neighborhood map
What this means for you Summary
Snapshot
- This is a 3-bed/2.0-bath manufactured listed at $168k.
Deal economics
- At list price, monthly cash flow is $1k ($16k/yr) — positive.
- The deal already cash-flows at list — no discount required.
- Meets the 1% rule at list price ($3k rent vs $168k).
- Cap rate 15.6% vs local median 3.7% in Zephyrhills — top-decile yield for the area; either an underpriced asset or a hidden risk that comps aren't pricing in. Stress-test before assuming the spread holds.
Location & tenants
- Location reads 72/100 on livability (#330 in FL) — a middle-class / working-renter tenant base. Strengths: cost of living A+, housing A+, health & safety A; Watch: schools C-, crime C-, amenities F.
- Pasco (suburban): math 50% / reading 52% proficiency, ranked #32 of 73 in FL (top 44%) — acceptable for families but not a draw, mixed tenant base, ~2y average lease.
- Market conditions: 235 active listings in the ZIP; 6 comparable units currently listed for rent nearby; rentals at typical pace (median 24d on market — plan ~3-4 weeks tenant-placement turnaround); 6,765 units permitted in Pasco County in 2024 (1,250 in 5+ unit buildings).
Forward outlook
- Local home prices are declining (-3.0%/yr); year-one equity from $1k of loan paydown is wiped out by about $5k of value loss. Plan a longer hold.
- Pasco County population projected at +29% by 2050 — long-run rental-demand tailwind backs the buy-and-hold thesis.
- At projected returns (-3.0% appreciation + 3.0% rent growth), your $47k cash investment doubles in ~4 years — after that, you're playing with house money.
Negotiation context
- Only 4 days on market — expect competitive offers; lowballing is unlikely to land.
- 4 sale attempts since 21y ago; this cycle's ask has dropped $30k (15%) from the opening price — seller is motivated, your offer sets the floor, not the list.
Risks & watch-outs
- Climate carrying-cost: severe wind risk, 99% chance of damaging wind over 30y; moderate wildfire risk; extreme-heat days projected 7→24/yr by 2055 (HVAC capex compounding) — expect insurance premiums to compound above CPI over the hold.
Questions for the listing agent
- Built in 1977 — when were the roof, HVAC, electrical panel, plumbing, and water heater last replaced?
- Is there a deadline driving the sale (1031 exchange, divorce, estate, relocation)? That informs how much negotiation room exists.
- What's the average days-on-market for RENTAL listings here right now (not sales)? A rising rental-DOM trend means longer vacancies and softer asking-rent achievability than the comps imply.
- What's the recent tenant-quality profile in this submarket — average credit score on applications, eviction rate, late-payment / NSF rate, and stable-employment percentage? A property-management company in the area should have these aggregated.
- How much new for-sale + rental construction is in the pipeline within 1–3 miles? Heavy new supply typically softens prices + rents 12–24 months out; constrained supply supports both.
Investment metrics
- 1% rule
- 1.81% ✓
- Cap rate
- 15.63%
- Cash-on-cash
- 33.34%
- DSCR
- 2.48
- GRM
- 4.6
CMA / ARV
- ARV (on-the-fly)
- $198,912
- Comps found
- 4
Show comp detail 4 sales within ~0.75 mi
| Address | Dist | Beds/Ba | Sqft | Sold | Price | $/sf | Match |
|---|---|---|---|---|---|---|---|
| 8351 Clara Dr | 0.27mi | 3/2.0 | 1,152 (-14%) | 7mo | $170,000 | $148 | 57 |
| 8514 Bragg St | 0.72mi | 3/2.0 | 1,404 (+4%) | 10mo | $160,000 | $114 | 50 |
| 8105 Cindy Dr | 0.55mi | 3/2.0 | 1,152 (-14%) | 7mo | $135,000 | $117 | 45 |
| 8014 Hobart Dr | 0.61mi | 3/2.0 | 1,456 (+8%) | 18mo | $230,000 | $158 | 42 |
Match score weights: distance 35% · size 25% · config 20% · recency 20%. Top-matched comps best support the ARV.
Projected returns pro-forma
-3.0% appreciation · 3.0% rent growth · sell at horizon
- IRR
- 28.6%
- Equity multiple
- 2.19×
- Total profit
- $55,998
- Equity at exit
- $25,034
- IRR
- 36.0%
- Equity multiple
- 4.32×
- Total profit
- $155,919
- Equity at exit
- $14,517
Cash invested: $47,012 (down + closing). Projections, not guarantees.
Landlord ↔ Tenant lean methodology
- Overall (STATE)
- 87 Strongly Landlord-Friendly
- State Florida
- 87 Strongly Landlord-Friendly · R+3
- County
- — inherits STATE
- City
- — inherits STATE
ZIP-level market 33540
- Home prices YoY
- -3.0%
- Active inventory
- 235
- Price-to-rent
- 4.6×
Monthly cashflow live
- Estimated rent
- $3,041 high interval (Pro) →
- Mortgage (P&I)
- −$880
- Tax from tax record
- −$146 /mo · $1,750/yr
- Insurance
- −$70
- HOA
- −$0
- Vacancy / Maint / Mgmt
- −$639
- Net cashflow
- $1,306
Break-even live
UW: 25.0% down · 7.5% · 30yr · 1.5% tax · 5.0% vac · 8.0% maint · 8.0% mgmt
Financing live
Cash to close
- Down payment
- $41,975
- Closing costs
- $5,037
- Reserves months
- —
- Total cash needed
- —
Loan-product check · same deal, 3 products live
Conventional
25% down · 7.5% · 30yr
- Down + closing
- —
- Monthly P&I
- —
- Monthly cashflow
- —
- DSCR
- —
- Eligible?
- —
Personal DTI + credit; lowest rate.
DSCR
20% down · 8.5% · 30yr
- Down + closing
- —
- Monthly P&I
- —
- Monthly cashflow
- —
- DSCR
- —
- Eligible?
- —
No personal income docs; deal must DSCR.
Hard money
10% down · 12.0% · 12mo
- Down + closing
- —
- Monthly P&I
- —
- Monthly cashflow
- —
- DSCR
- —
- Eligible?
- —
Short-term bridge; refi at stabilization.
Rent comps 6 comps
| Address | Beds | Baths | Sqft | Rent | $/sqft | DOM | Units | Dist |
|---|---|---|---|---|---|---|---|---|
| 8540 Boyt Rd Zephyrhills, FL | 3.0 | 2.0 | 1674 | $3,500 | $2.09 | 24d | 1 | 0.42mi |
| 8313 Wheat Stone Dr Zephyrhills, FL | 3.0 | 2.0 | 1864 | $2,275 | $1.22 | 24d | 1 | 1.35mi |
| 9960 U.S. 98 Dade City, FL | 3.0 | 2.0 | 1616 | $2,500 | $1.55 | 5d | 1 | 1.43mi |
| 10034 Hamp Dr Unit 1234478P Dade City, FL | 3.0 | 1.0 | 968 | $3,164 | $3.27 | 2d | 1 | 1.43mi |
| 10030 Sterling Ave Unit 1234467P Dade City, FL | 2.0 | 2.0 | 1280 | $2,744 | $2.14 | 12d | 1 | 1.44mi |
| 10043 Collingwood Ave Dade City, FL | 2.0 | 2.0 | 1286 | $3,000 | $2.33 | 24d | 1 | 1.45mi |
Listing history 6 events
-
2026-06-19price $167,900 Active 4 DOM
-
2026-06-18days on market $197,700 Active 4 DOM
-
2026-06-17days on market $197,700 Active 3 DOM
-
2026-06-16days on market $197,700 Active 2 DOM
-
2026-06-15remarks 699-char remark
-
2026-06-15$197,700 Active 1 DOM
ⓘ Source: listings_history table (triggers on properties + properties_extension) + one-shot
backfill from property_details.listing_events for pre-trigger history.
Tax reassessment forecast FL · Resets to sale price
- Current annual tax
- $1,750 · $146/mo
- Projected year-2 tax
- $1,750 · $146/mo
- Expected delta
- $0/yr ($0/mo · 0.0%)
ⓘ Screening estimate from a state-policy table — verify with the county assessor before closing.
Climate risk First Street
- Flood 1/10 Low FEMA zone X (unshaded) · 0% chance over 30 yrs
- Wildfire 5/10 Major
- Heat 9/10 Extreme 7 d/yr ≥108°F today · 24 d/yr by 30 yrs out
- Wind 10/10 Extreme 99% chance of damaging wind over 30 yrs
- Air quality 2/10 Low 1 unhealthy d/yr today · 1 by 30 yrs out
Nearby sold comps map
Loading sold comps map…
Walkable amenities ~0.75 mi
Loading nearby amenities…
Taxation est. · year 1
- Rental income
- $36,495
- − Mortgage interest
- −$9,405
- − Property taxes
- −$1,750
- − Insurance
- −$840
- − Repairs & maintenance
- −$2,920
- − Management
- −$2,920
- − Depreciation
- −$4,884
- Taxable income
- $13,777
- Est. tax owed @ 24.0%
- −$3,306
- After-tax cash flow
- $12,369/yr
For passive investors: Depreciation is non-cash, so a rental often shows a tax loss while cash-flowing — sheltering income. Rental losses are passive: they offset passive income freely, and up to $25,000/yr can offset ordinary (W-2) income if you actively participate and your MAGI is under $100k (phasing out to $0 by $150k); unused losses carry forward. On sale, claimed depreciation is recaptured at up to 25%, and gains may owe capital-gains tax (a 1031 exchange can defer both). Figures are a year-1 estimate at your 24.0% rate — not tax advice; consult a CPA.
Schools (NCES district)
- District
- Pasco
- NCES district ID
- 1201530
- Math proficiency
- 50% ▼ -10.00%
- Reading proficiency
- 52% ▼ -5.00%
- Median HH income
- $45,039
- Composite
- 43.14/100
- National rank
- #3074
- State rank
- #32 of 73 in FL
Livability — Zephyrhills
- Score
- 72/100
- State rank
- #330
- US rank
- #5760
Category grades
Schools grade is shown separately in the Schools card above.
Census & demographics
- City population
- 48,266
- Population (ZIP)
- 11,098
Population outlook (Pasco County) Hauer SSP2
- Today (2025)
- 570,045 people
- By 2030
- 605,844 · +6.3%
- By 2040
- 674,806 · +18.4%
- By 2050
- 736,022 · +29.1%
- By 2075
- 862,900 · +51.4%
- By 2100
- 906,364 · +59.0%
Race, ethnicity, and origin ACS 2023
- Neighborhood character
- Predominantly White (77%)
- Race & ethnicity
- White 77% Hispanic / Latino 14% Two or more races 10% Black 3% Asian 1%
- Hispanic origin (detail)
- Mexican 2% Puerto Rican 8% Cuban 2%
- Common ancestry
- Lithuanian 4% Romanian 3% Italian 2%
- Foreign-born
- 11% · Canada, Vietnam
- Languages at home
- 87% English-only · Spanish 9% French/Haitian/Cajun 2% Other Indo-European 1%
Political lean MEDSL · Pasco
- 2024 margin
- Strong R (+25.2) · D 36.9% · R 62.1% · Other 1.0%
- 2008→2024 swing
- -21.6pp toward R · 2008: -3.6pp · 2024: -25.2pp
- All cycles
- 2024: R+25.2 2020: R+20.1 2016: R+21.6 2012: R+6.7 2008: R+3.6
Not yet ingested
- Civics
- —
Market trends
- HPI YoY
- ▼ -11.57%
- Current HPI
- 370.8747
- Rent YoY
- —
- Metro
- —
- State GDP YoY
- ▲ 3.28%
- F500 in state
- 36
Industry mix (Fortune 500 HQ in FL)
| Industry | F500 HQs | Revenue |
|---|---|---|
| Industrial Technology | 2 | $29B |
|
||
| Insurance | 2 | $17B |
|
||
| Retail | 1 | $60B |
|
||
| Technology Distribution | 1 | $58B |
|
||
| Homebuilding | 1 | $35B |
|
||
| Technology Manufacturing | 1 | $35B |
|
||
Price history
+4.6% since first listed5 events — show timeline
- 2026-06-14 Listed $197,700 Stellar MLS as Distributed by MLS Grid
- 2015-05-19 Listing Removed — Stellar MLS as Distributed by MLS Grid
- 2014-08-26 Listed $47,500 Stellar MLS as Distributed by MLS Grid
- 2006-09-26 Listed $199,900 Stellar MLS as Distributed by MLS Grid
- 2005-11-11 Listed $189,000 Stellar MLS as Distributed by MLS Grid
Property tax history
+9.3%/yrLatest (2025): $1,750 · +4.7% YoY. Source: county tax records.
Cash-flow waterfall
monthlySold comps — $/sqft
last 12 mo · ≤1 miLoading sold comps…