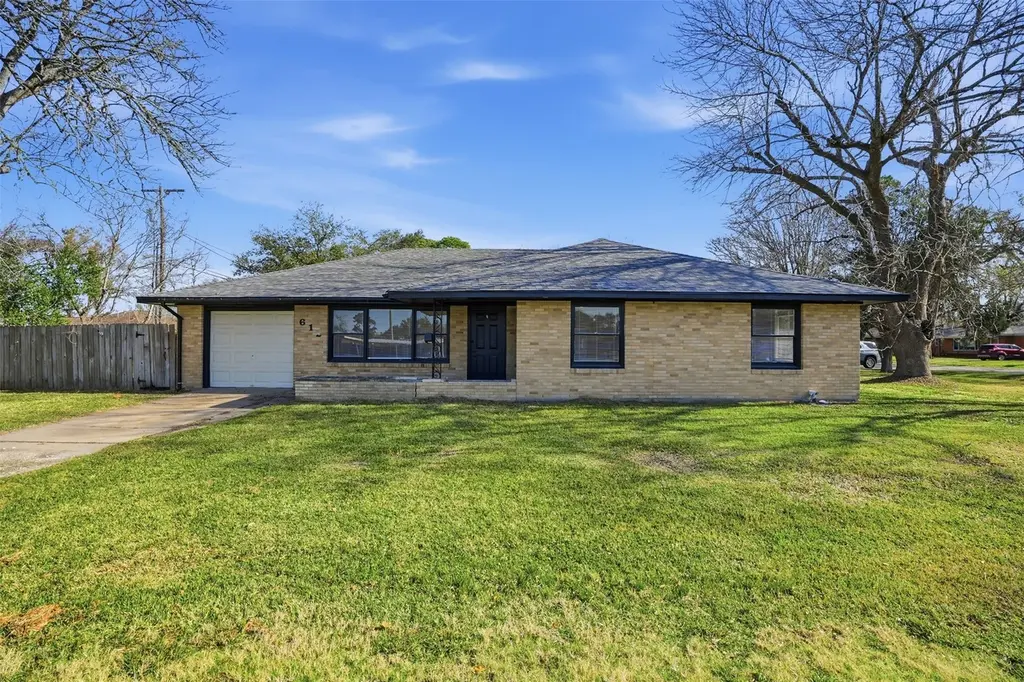
612 Sunset Ln · La Marque, TX
Flood risk 7/10 · Major
- FEMA flood zone
- X
- Chance of flooding over 30 yrs
- 0.6%
- Est. flood insurance / yr
- $507 – $1,088
Fire risk 2/10 · Minimal
- Est. fire insurance / yr
- $1,222 – $2,270
Heat risk 10/10 · Severe
- Hot days now (above 109°F)
- 7 days/yr
- Hot days in 30 yrs
- 27 days/yr
Wind risk 10/10 · Severe
- Chance of severe wind over 30 yrs
- 99.0%
Air-quality risk 3/10 · Minor
- Unhealthy air days now
- 2 days/yr
- Unhealthy air days in 30 yrs
- 2 days/yr
Risk factors via First Street. Map © Google.
Why this score? — see what drove the C- grade
The composite is a weighted blend of 9 inputs, each scored 0–100. Each bar is that input's sub-score; the figure is the points it added to the 100-point composite (weight × sub-score).
- Cash flow +19.1/30.0
- ARV discount +9.3/15.0
- 1% rule +6.5/10.0
- DSCR +6.0/10.0
- Rent growth +3.5/5.0
- Livability +3.0/5.0
- Condition / age +2.5/5.0
- Schools +2.4/10.0
- Appreciation +0.0/10.0
$178,000
🖨 Deal sheet 📄 Offer letter ✓ Due diligence
Listing remarks MLS
Welcome to this charming and spacious home offering a comfortable layout and modern touches throughout. The inviting living room provides plenty of space to gather and unwind, while the updated kitchen shines with a beautiful statement light fixture and flows seamlessly into the dining and living areas for easy everyday living and entertaining. The primary bedroom serves as a private retreat with its own ensuite bath, creating a relaxing space to recharge. Step outside to a fully fenced backyard featuring a covered patio and ample greenspace, perfect for outdoor dining, pets, or weekend get-togethers. Conveniently located near local parks, neighborhood schools, and shopping and dining options along FM 1764 and I-45, with easy access to Galveston beaches and nearby recreation, this home blends comfort, convenience, and a great location.
Key facts
- Ample greenspace
- Covered patio
- Updated kitchen
Tags
Neighborhood map
What this means for you Summary
Snapshot
- This is a 3-bed/1.5-bath single-family listed at $178k.
Deal economics
- At list price, monthly cash flow is $121 ($1k/yr) — positive.
- The deal already cash-flows at list — no discount required.
- Meets the 1% rule at list price ($2k rent vs $178k).
- Recommended offer: $157k (12.0% below list) — sets the bar for market timing.
- Cap rate 7.6% vs local median 5.6% in La Marque — top-decile yield for the area; either an underpriced asset or a hidden risk that comps aren't pricing in. Stress-test before assuming the spread holds.
Location & tenants
- Location reads 59/100 on livability (#1,136 in TX) — a working-class tenant base; expect higher turnover. Strengths: cost of living A+, housing A+; Watch: employment D, schools F, crime F.
- Texas City ISD (suburban): math 28% / reading 29% proficiency, ranked #655 of 826 in TX (top 79%) — low school quality limits family demand, transient renter base, plan for 1-2y turnover; 66% free/reduced lunch — lower-income household profile, screen leases tightly.
- Market conditions: Rents rising (+4.0%/yr); 654 active listings in the ZIP; 8 comparable units currently listed for rent nearby; rentals at typical pace (median 25d on market — plan ~3-4 weeks tenant-placement turnaround); 3,258 units permitted in Galveston County in 2024 (0 in 5+ unit buildings).
- This rent runs 33% of the median local income ($75k/yr) — at the standard rent-burdened threshold; future hikes will face affordability resistance.
Forward outlook
- Local home prices are declining (-3.0%/yr); year-one equity from $1k of loan paydown is wiped out by about $5k of value loss. Plan a longer hold.
- Galveston County population projected at +43% by 2050 — long-run rental-demand tailwind backs the buy-and-hold thesis.
Negotiation context
- It's been on market 129 days — a 12% lower offer ($157k) is reasonable based on typical stale-listing flexibility.
- 3 sale attempts since 3y ago with the ask held roughly flat each time — persistent listings suggest the price (not the market) is what's stuck; bring a comps-based counter.
Risks & watch-outs
- Watch-outs: property tax is 2.8% of price; flood insurance adds $66/mo; built in 1950 — expect roof / HVAC / electrical / plumbing capex.
- Climate carrying-cost: major flood risk; severe wind risk, 99% chance of damaging wind over 30y; extreme-heat days projected 7→27/yr by 2055 (HVAC capex compounding) — expect insurance premiums to compound above CPI over the hold.
Questions for the listing agent
- It's been on market 129 days. Have you received any prior offers? Is the seller open to a 12% concession, seller financing, or rate buy-down credit?
- Built in 1950 — when were the roof, HVAC, electrical panel, plumbing, and water heater last replaced?
- Property tax is high relative to price — has the assessment been appealed recently, and will the sale trigger a re-assessment?
- What's the actual annual flood-insurance premium (NFIP or private), and is the property in a SFHA with mandatory coverage?
- Why hasn't it sold? Are there any deal-killer items the seller is aware of (foundation, flood, title, zoning, code violations)?
- Is there a deadline driving the sale (1031 exchange, divorce, estate, relocation)? That informs how much negotiation room exists.
- Schools are F-rated, which usually means shorter tenancies and higher turnover. Who's the typical renter profile here, and what's been the actual vacancy rate?
- Crime grade is F in this area — have there been break-ins, vandalism, or insurance claims at this property in the last 3 years? What carrier currently insures it and at what premium?
- What's the average days-on-market for RENTAL listings here right now (not sales)? A rising rental-DOM trend means longer vacancies and softer asking-rent achievability than the comps imply.
- What's the recent tenant-quality profile in this submarket — average credit score on applications, eviction rate, late-payment / NSF rate, and stable-employment percentage? A property-management company in the area should have these aggregated.
- How much new for-sale + rental construction is in the pipeline within 1–3 miles? Heavy new supply typically softens prices + rents 12–24 months out; constrained supply supports both.
Investment metrics
- 1% rule
- 1.15% ✓
- Cap rate
- 7.56%
- Cash-on-cash
- 4.51%
- DSCR
- 1.20
- GRM
- 7.3
CMA / ARV
- ARV (median comp)
- $185,631
- List price
- $178,000
- Delta
- -4.11%
- Verdict
- FAIR
- Comps
- 20 within 1.0 mi
Show comp detail 12 sales within ~0.75 mi
| Address | Dist | Beds/Ba | Sqft | Sold | Price | $/sf | Match |
|---|---|---|---|---|---|---|---|
| 1303 Red Bud Ln Ln | 0.26mi | 3/2.0 | 1,796 (+2%) | 4mo | $170,000 | $95 | 80 |
| 524 Avenue A | 0.39mi | 4/2.5 (+1) | 1,778 (+0%) | 2mo | $249,000 | $140 | 71 |
| 1112 Cora St | 0.32mi | 3/2.0 | 1,631 (-8%) | 6mo | $175,000 | $107 | 65 |
| 328 S Oak St | 0.62mi | 3/2.0 | 1,786 (+1%) | 6mo | $139,000 | $78 | 63 |
| 1825 Thompson St | 0.55mi | 3/2.5 | 1,676 (-5%) | 4mo | $229,900 | $137 | 58 |
| 2405 Stonewall St | 0.56mi | 4/3.0 (+1) | 1,812 (+2%) | 2mo | $249,900 | $138 | 58 |
| 727 Eleanor St | 0.55mi | 3/2.5 | 1,672 (-6%) | 6mo | $170,000 | $102 | 56 |
| 1010 Ross St | 0.55mi | 3/2.5 | 1,520 (-14%) | 3mo | $269,000 | $177 | 44 |
| 1518 Oleander Dr | 0.74mi | 4/2.0 (+1) | 1,940 (+10%) | 2mo | $299,000 | $154 | 40 |
| 612 Honeysuckle Dr | 0.64mi | 3/2.0 | 1,504 (-15%) | 4mo | $159,000 | $106 | 40 |
| 2115 Scott St | 0.74mi | 3/2.5 | 1,584 (-10%) | 7mo | $159,000 | $100 | 38 |
| 1311 Scott St | 0.69mi | 2/2.0 (-1) | 1,520 (-14%) | 6mo | $164,000 | $108 | 32 |
Match score weights: distance 35% · size 25% · config 20% · recency 20%. Top-matched comps best support the ARV.
Projected returns pro-forma
-3.0% appreciation · 3.95% rent growth · sell at horizon
- IRR
- -10.3%
- Equity multiple
- 0.62×
- Total profit
- $-18,978
- Equity at exit
- $26,540
- IRR
- 0.7%
- Equity multiple
- 1.05×
- Total profit
- $2,406
- Equity at exit
- $15,390
Cash invested: $49,840 (down + closing). Projections, not guarantees.
Landlord ↔ Tenant lean methodology
- Overall (STATE)
- 87 Strongly Landlord-Friendly
- State Texas
- 87 Strongly Landlord-Friendly · R+5
- County
- — inherits STATE
- City
- — inherits STATE
ZIP-level market 77568
- Home prices YoY
- -22.7%
- Rents YoY
- 4.0%
- Active inventory
- 654
- Price-to-rent
- 7.3×
Monthly cashflow live
- Estimated rent
- $2,040 high interval (Pro) →
- Mortgage (P&I)
- −$933
- Tax from tax record
- −$416 /mo · $4,996/yr
- Insurance
- −$74
- Flood insurance flood zone
- −$66 /mo · $798/yr
- HOA
- −$0
- Vacancy / Maint / Mgmt
- −$428
- Net cashflow
- $121
Break-even live
UW: 25.0% down · 7.5% · 30yr · 1.5% tax · 5.0% vac · 8.0% maint · 8.0% mgmt
Financing live
Cash to close
- Down payment
- $44,500
- Closing costs
- $5,340
- Reserves months
- —
- Total cash needed
- —
Loan-product check · same deal, 3 products live
Conventional
25% down · 7.5% · 30yr
- Down + closing
- —
- Monthly P&I
- —
- Monthly cashflow
- —
- DSCR
- —
- Eligible?
- —
Personal DTI + credit; lowest rate.
DSCR
20% down · 8.5% · 30yr
- Down + closing
- —
- Monthly P&I
- —
- Monthly cashflow
- —
- DSCR
- —
- Eligible?
- —
No personal income docs; deal must DSCR.
Hard money
10% down · 12.0% · 12mo
- Down + closing
- —
- Monthly P&I
- —
- Monthly cashflow
- —
- DSCR
- —
- Eligible?
- —
Short-term bridge; refi at stabilization.
Rent comps 8 comps
| Address | Beds | Baths | Sqft | Rent | $/sqft | DOM | Units | Dist |
|---|---|---|---|---|---|---|---|---|
| 1230 Kirsten St La Marque, TX | 3.0 | 2.0 | 1704 | $1,660 | $0.97 | 3d | 1 | 0.42mi |
| 1029 Sycamore St La Marque, TX | 3.0 | 2.0 | 1928 | $1,695 | $0.88 | 15d | 1 | 0.43mi |
| 203 Beatrice St La Marque, TX | 3.0 | 1.0 | 1304 | $1,395 | $1.07 | 24d | 1 | 0.53mi |
| 1401 Austin St La Marque, TX | 4.0 | 3.0 | 1542 | $2,400 | $1.56 | 43d | 1 | 0.76mi |
| 309 S Bell Dr Texas City, TX | 2.0 | 2.0 | 1316 | $1,650 | $1.25 | 43d | 1 | 0.81mi |
| 1006 E Camp Cir La Marque, TX | 3.0 | 1.0 | 1230 | $1,500 | $1.22 | 24d | 1 | 0.94mi |
| 113 N Pecan Dr Texas City, TX | 4.0 | 2.0 | 1468 | $3,000 | $2.04 | 43d | 1 | 1.04mi |
| 105 Plum St La Marque, TX | 4.0 | 1.5 | 1329 | $2,100 | $1.58 | 3d | 1 | 1.42mi |
Listing history 25 events
-
2026-06-18pricedays on market $178,000 Active 129 DOM
-
2026-06-15days on market $170,000 Active 130 DOM
-
2026-06-13days on market $170,000 Active 128 DOM
-
2026-06-09days on market $170,000 Active 124 DOM
-
2026-06-08days on market $170,000 Active 123 DOM
-
2026-06-07days on market $170,000 Active 122 DOM
-
2026-06-04days on market $170,000 Active 119 DOM
-
2026-06-03days on market $170,000 Active 118 DOM
-
2026-06-02days on market $170,000 Active 117 DOM
-
2026-06-01days on market $170,000 Active 116 DOM
-
2026-05-31days on market $170,000 Active 115 DOM
-
2026-02-24price $170,000 850-char remark
Show marketing remark (850 chars)
Welcome to this charming and spacious home offering a comfortable layout and modern touches throughout. The inviting living room provides plenty of space to gather and unwind, while the updated kitchen shines with a beautiful statement light fixture and flows seamlessly into the dining and living areas for easy everyday living and entertaining. The primary bedroom serves as a private retreat with its own ensuite bath, creating a relaxing space to recharge. Step outside to a fully fenced backyard featuring a covered patio and ample greenspace, perfect for outdoor dining, pets, or weekend get-togethers. Conveniently located near local parks, neighborhood schools, and shopping and dining options along FM 1764 and I-45, with easy access to Galveston beaches and nearby recreation, this home blends comfort, convenience, and a great location.
-
2026-02-05$180,000 Active 850-char remark
Show marketing remark (850 chars)
Welcome to this charming and spacious home offering a comfortable layout and modern touches throughout. The inviting living room provides plenty of space to gather and unwind, while the updated kitchen shines with a beautiful statement light fixture and flows seamlessly into the dining and living areas for easy everyday living and entertaining. The primary bedroom serves as a private retreat with its own ensuite bath, creating a relaxing space to recharge. Step outside to a fully fenced backyard featuring a covered patio and ample greenspace, perfect for outdoor dining, pets, or weekend get-togethers. Conveniently located near local parks, neighborhood schools, and shopping and dining options along FM 1764 and I-45, with easy access to Galveston beaches and nearby recreation, this home blends comfort, convenience, and a great location.
-
2023-10-03soldstatus
-
2023-09-27historical
-
2023-09-06price $219,900
-
2023-08-25status Active
-
2023-07-24historical
-
2023-07-24historical
-
2023-05-23price $235,900
-
2023-05-17price $254,900
-
2023-04-30$269,900 Active
-
2023-01-20soldstatus
-
2023-01-19soldstatus
-
1995-10-31soldstatus
ⓘ Source: listings_history table (triggers on properties + properties_extension) + one-shot
backfill from property_details.listing_events for pre-trigger history.
Tax reassessment forecast TX · Resets to sale price
- Current annual tax
- $4,996 · $416/mo
- Projected year-2 tax
- $4,996 · $416/mo
- Expected delta
- $0/yr ($0/mo · 0.0%)
ⓘ Screening estimate from a state-policy table — verify with the county assessor before closing.
Climate risk First Street
- Flood 7/10 Severe FEMA zone X · 60% chance over 30 yrs
- Wildfire 2/10 Low
- Heat 10/10 Extreme 7 d/yr ≥109°F today · 27 d/yr by 30 yrs out
- Wind 10/10 Extreme 99% chance of damaging wind over 30 yrs
- Air quality 3/10 Moderate 2 unhealthy d/yr today · 2 by 30 yrs out
Nearby sold comps map
Loading sold comps map…
Walkable amenities ~0.75 mi
Loading nearby amenities…
Taxation est. · year 1
- Rental income
- $24,477
- − Mortgage interest
- −$9,971
- − Property taxes
- −$4,996
- − Insurance
- −$1,688
- − Repairs & maintenance
- −$1,958
- − Management
- −$1,958
- − Depreciation
- −$5,178
- Taxable loss
- −$1,272
- Est. tax savings @ 24.0%
- +$305
- After-tax cash flow
- $1,757/yr
For passive investors: Depreciation is non-cash, so a rental often shows a tax loss while cash-flowing — sheltering income. Rental losses are passive: they offset passive income freely, and up to $25,000/yr can offset ordinary (W-2) income if you actively participate and your MAGI is under $100k (phasing out to $0 by $150k); unused losses carry forward. On sale, claimed depreciation is recaptured at up to 25%, and gains may owe capital-gains tax (a 1031 exchange can defer both). Figures are a year-1 estimate at your 24.0% rate — not tax advice; consult a CPA.
Schools (NCES district)
- District
- Texas City ISD
- NCES district ID
- 4842510
- Math proficiency
- 28% ▼ -10.00%
- Reading proficiency
- 29% ▼ -4.00%
- Median HH income
- $44,875
- Composite
- 24.47/100
- National rank
- #7664
- State rank
- #655 of 826 in TX
Livability — La Marque
- Score
- 59/100
- State rank
- #1136
- US rank
- #20037
Category grades
Schools grade is shown separately in the Schools card above.
Census & demographics
- Census place
- La Marque, TX
- County
- Galveston County · 357,330 people
- City population
- 23,083
- Metro
- Houston-The Woodlands-Sugar Land, TX
- Population (ZIP)
- 23,083
- Household income
- $74,694
- Rent vs Own
- Severe rent burden
- 700.0
Population outlook (Galveston County) Hauer SSP2
- Today (2025)
- 390,640 people
- By 2030
- 425,226 · +8.9%
- By 2040
- 493,765 · +26.4%
- By 2050
- 559,698 · +43.3%
- By 2075
- 719,260 · +84.1%
- By 2100
- 819,628 · +109.8%
Race, ethnicity, and origin ACS 2023
- Neighborhood character
- Highly diverse neighborhood (Simpson 0.71)
- Race & ethnicity
- White 37% Hispanic / Latino 29% Black 26% Two or more races 17% Asian 3%
- Hispanic origin (detail)
- Mexican 22% Puerto Rican 1%
- Common ancestry
- Lithuanian 1% Italian 1% Serbian 1%
- Foreign-born
- 8% · Canada
- Languages at home
- 77% English-only · Spanish 21% Tagalog/Filipino 1% Other Asian/Pacific 1%
Political lean MEDSL · Galveston
- 2024 margin
- Strong R (+27.4) · D 35.7% · R 63.1% · Other 1.2%
- 2008→2024 swing
- -7.9pp toward R · 2008: -19.5pp · 2024: -27.4pp
- All cycles
- 2024: R+27.4 2020: R+22.6 2016: R+22.6 2012: R+26.9 2008: R+19.5
Not yet ingested
- Civics
- —
Market trends
- HPI YoY
- ▼ -69.39%
- Current HPI
- 236.0239
- Rent YoY
- ▲ 3.95%
- Metro
- Houston-The Woodlands-Sugar Land, TX
- State GDP YoY
- ▲ 3.95%
- F500 in state
- 110
Industry mix (Fortune 500 HQ in TX)
| Industry | F500 HQs | Revenue |
|---|---|---|
| Energy | 16 | $1,198B |
|
||
| Technology | 5 | $198B |
|
||
| Engineering / Construction | 4 | $72B |
|
||
| Energy Services | 3 | $60B |
|
||
| Utilities | 3 | $41B |
|
||
| Healthcare | 2 | $330B |
|
||
Price history
-37.0% since first listed14 events — show timeline
- 2026-02-24 Price Changed $170,000 HARMLS
- 2026-02-05 Listed $180,000 HARMLS
- 2023-10-03 Sold (Public Records) — Public Records
- 2023-09-27 Listing Removed — HARMLS
- 2023-09-06 Price Changed $219,900 HARMLS
- 2023-08-25 Relisted — HARMLS
- 2023-07-24 Rental Removed — HARMLS
- 2023-07-24 Listing Removed — HARMLS
- 2023-05-23 Price Changed $235,900 HARMLS
- 2023-05-17 Price Changed $254,900 HARMLS
- 2023-04-30 Listed $269,900 HARMLS
- 2023-01-20 Sold (Public Records) — Public Records
- 2023-01-19 Sold (Public Records) — Public Records
- 1995-10-31 Sold (Public Records) — Public Records
Property tax history
+9.0%/yrLatest (2025): $4,996 · +2.7% YoY. Source: county tax records.
Cash-flow waterfall
monthlySold comps — $/sqft
last 12 mo · ≤1 miLoading sold comps…