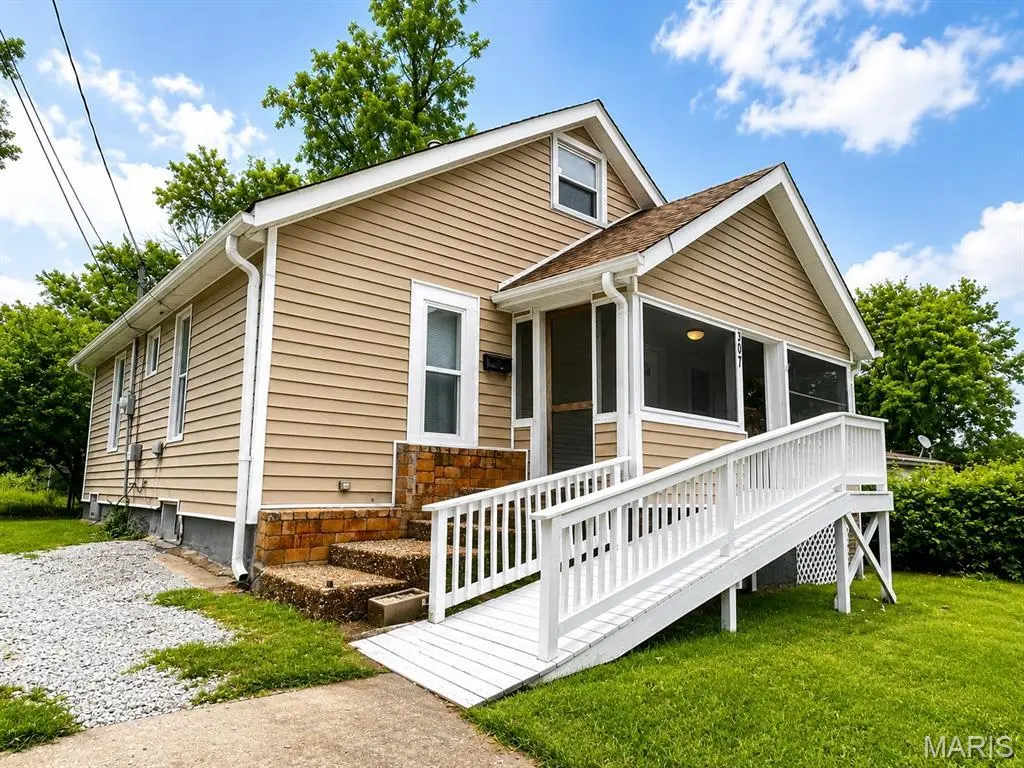
307 Alsobrook St · Kirkwood, MO
Flood risk 1/10 · Minimal
- FEMA flood zone
- X (unshaded)
- Chance of flooding over 30 yrs
- 0.0%
- Est. flood insurance / yr
- $473 – $860
Fire risk 1/10 · Minimal
- Est. fire insurance / yr
- $1,054 – $1,958
Heat risk 5/10 · Moderate
- Hot days now (above 107°F)
- 7 days/yr
- Hot days in 30 yrs
- 21 days/yr
Wind risk 2/10 · Minimal
- Chance of severe wind over 30 yrs
- 1.0%
Air-quality risk 3/10 · Minor
- Unhealthy air days now
- 2 days/yr
- Unhealthy air days in 30 yrs
- 4 days/yr
Risk factors via First Street. Map © Google.
Why this score? — see what drove the B grade
The composite is a weighted blend of 9 inputs, each scored 0–100. Each bar is that input's sub-score; the figure is the points it added to the 100-point composite (weight × sub-score).
- Cash flow +25.5/30.0
- ARV discount +15.0/15.0
- DSCR +8.5/10.0
- 1% rule +6.2/10.0
- Schools +5.7/10.0
- Rent growth +4.2/5.0
- Livability +3.9/5.0
- Condition / age +2.5/5.0
- Appreciation +0.0/10.0
$175,000
🖨 Deal sheet 📄 Offer letter ✓ Due diligence
Listing remarks
Beautiful 3 bedroom, 2 bathroom home located in Kirkwood! This charming home offers a spacious layout with comfortable living areas, a nice kitchen, and plenty of natural light throughout. The primary suite features a private full bath, while the additional bedrooms provide flexibility for family, guests, or a home office. Enjoy the flat backyard perfect for entertaining, relaxing, or outdoor activities. Conveniently located near parks, shopping, dining, and top rated schools with easy access to major highways. Move in ready and full of character, this is one you do not want to miss!
Key facts
- 5,000 sq ft lot
- Built 1950
- Listed 22 days
Property features AI
Exterior
- Utilities: Public water; Ameren electric service; Public sewer
- Home design: Single-family residence; Two levels
- Construction: Built using other construction materials
- Exterior features: Fenced yard (other); Lot described with other features
Interior
- Kitchen: Microwave; Electric oven; Range / Electric range
- Bedrooms: 3 bedrooms total; 2 bedrooms on the main level; 1 bedroom on the upper level
- Bathrooms: 2 full bathrooms total; 1 full bathroom on the main level; 1 full bathroom on the upper level
- Interior features: Microwave; Electric oven; Range / Electric range; Forced air heating; Central air conditioning; Has basement with 8 ft+ poured concrete
Neighborhood map
What this means for you Summary
Snapshot
- This is a 3-bed/2.0-bath single-family listed at $175k.
Deal economics
- At list price, monthly cash flow is $411 ($5k/yr) — positive.
- The deal already cash-flows at list — no discount required.
- Meets the 1% rule at list price ($2k rent vs $175k).
- Recommended offer: $172k (1.5% below list) — sets the bar for market timing.
- Cap rate 9.1% vs local median 2.4% in Kirkwood — top-decile yield for the area; either an underpriced asset or a hidden risk that comps aren't pricing in. Stress-test before assuming the spread holds.
Location & tenants
- Location reads 78/100 on livability (#27 in MO, #2,478 nationally) — a middle-class / working-renter tenant base. Strengths: employment A+, housing A+, crime B; Watch: cost of living C-, commute F.
- Kirkwood R-VII (suburban): math 57% / reading 68% proficiency, ranked #5 of 324 in MO (top 2%) — acceptable for families but not a draw, mixed tenant base, ~2y average lease; only 11% free/reduced lunch — higher-income household profile.
- Zoned schools: George R. Robinson Elem. (math 47% / reading 63%, grade C, #185 of 1,115 statewide, top 17%, 493 students, 17% FRL); Kirkwood Sr. High (math 72% / reading 79%, grade A-, #3 of 521 statewide, top 0%, 1,775 students, 11% FRL) — zoned schools at 14% FRL track the district average.
- Market conditions: Rents rising fast (+6.6%/yr); 211 active listings in the ZIP; 6 comparable units currently listed for rent nearby; rentals at typical pace (median 24d on market — plan ~3-4 weeks tenant-placement turnaround); high-income renter base; 920 units permitted in St. Louis County in 2024 (250 in 5+ unit buildings).
- This rent is only 17% of the median local income ($136k/yr) — well below the 30% rent-burden line; pricing power to push rent on renewal without tenant pushback.
Forward outlook
- Local home prices are declining (-3.0%/yr); year-one equity from $1k of loan paydown is wiped out by about $5k of value loss. Plan a longer hold.
- At projected returns (-3.0% appreciation + 6.6% rent growth), your $49k cash investment doubles in ~8 years — after that, you're playing with house money.
Negotiation context
- It's been on market 22 days — a 2% lower offer ($172k) is reasonable based on typical stale-listing flexibility.
- Current owner paid $32k; list at $175k implies a 438% gain — meaningful room to come down on a strong offer.
Risks & watch-outs
- Watch-outs: built in 1950 — expect roof / HVAC / electrical / plumbing capex.
- Climate carrying-cost: extreme-heat days projected 7→21/yr by 2055 (HVAC capex compounding) — expect insurance premiums to compound above CPI over the hold.
Questions for the listing agent
- Built in 1950 — when were the roof, HVAC, electrical panel, plumbing, and water heater last replaced?
- Is there a deadline driving the sale (1031 exchange, divorce, estate, relocation)? That informs how much negotiation room exists.
- Schools are A-rated — typically a magnet for longer-tenancy family renters. What's the average tenant stay here, and is there a school-zone premium baked into asking?
- What's the average days-on-market for RENTAL listings here right now (not sales)? A rising rental-DOM trend means longer vacancies and softer asking-rent achievability than the comps imply.
- What's the recent tenant-quality profile in this submarket — average credit score on applications, eviction rate, late-payment / NSF rate, and stable-employment percentage? A property-management company in the area should have these aggregated.
- How much new for-sale + rental construction is in the pipeline within 1–3 miles? Heavy new supply typically softens prices + rents 12–24 months out; constrained supply supports both.
Investment metrics
- 1% rule
- 1.12% ✓
- Cap rate
- 9.11%
- Cash-on-cash
- 10.06%
- DSCR
- 1.45
- GRM
- 7.5
CMA / ARV
- ARV (on-the-fly)
- $240,240
- Comps found
- 12
Show comp detail 12 sales within ~0.75 mi
| Address | Dist | Beds/Ba | Sqft | Sold | Price | $/sf | Match |
|---|---|---|---|---|---|---|---|
| 730 Samoa Dr | 0.55mi | 3/1.5 | 1,005 (+0%) | 0mo | $315,000 | $313 | 71 |
| 1408 Homecrest Dr | 0.41mi | 3/1.5 | 1,014 (+1%) | 9mo | $235,000 | $232 | 69 |
| 520 Pinellas Dr | 0.42mi | 3/1.0 | 1,040 (+4%) | 2mo | $279,900 | $269 | 68 |
| 556 Joshua Dr | 0.40mi | 3/1.0 | 1,040 (+4%) | 6mo | $249,995 | $240 | 66 |
| 621 Pinellas Dr | 0.50mi | 3/2.0 | 1,040 (+4%) | 9mo | $179,500 | $173 | 63 |
| 210 Monica Dr | 0.47mi | 3/1.0 | 945 (-6%) | 3mo | $199,000 | $211 | 62 |
| 216 Monica Dr | 0.46mi | 3/1.0 | 1,028 (+3%) | 9mo | $199,900 | $194 | 62 |
| 535 Rayburn Ave | 0.43mi | 3/1.5 | 936 (-6%) | 9mo | $300,000 | $321 | 59 |
| 1323 Samoa Dr | 0.69mi | 2/1.5 (-1) | 1,005 (+0%) | 4mo | $250,000 | $249 | 57 |
| 600 Norton Ave | 0.60mi | 2/1.0 (-1) | 1,032 (+3%) | 8mo | $245,000 | $237 | 51 |
| 613 S Fillmore Ave | 0.54mi | 2/1.0 (-1) | 1,092 (+9%) | 2mo | $249,900 | $229 | 49 |
| 418 E Elliott Ave | 0.69mi | 3/1.0 | 864 (-14%) | 10mo | $274,900 | $318 | 33 |
Match score weights: distance 35% · size 25% · config 20% · recency 20%. Top-matched comps best support the ARV.
Projected returns pro-forma
-3.0% appreciation · 6.63% rent growth · sell at horizon
- IRR
- 2.7%
- Equity multiple
- 1.11×
- Total profit
- $5,191
- Equity at exit
- $26,093
- IRR
- 15.3%
- Equity multiple
- 2.45×
- Total profit
- $70,894
- Equity at exit
- $15,131
Cash invested: $49,000 (down + closing). Projections, not guarantees.
Landlord ↔ Tenant lean methodology
- Overall (STATE)
- 81 Strongly Landlord-Friendly
- State Missouri
- 81 Strongly Landlord-Friendly · R+10
- County
- — inherits STATE
- City
- — inherits STATE
ZIP-level market 63122
- Rents YoY
- 6.6%
- Active inventory
- 211
- Price-to-rent
- 7.5×
Monthly cashflow live
- Estimated rent
- $1,957 high interval (Pro) →
- Mortgage (P&I)
- −$918
- Tax from tax record
- −$145 /mo · $1,737/yr
- Insurance
- −$73
- HOA
- −$0
- Vacancy / Maint / Mgmt
- −$411
- Net cashflow
- $411
Break-even live
UW: 25.0% down · 7.5% · 30yr · 1.5% tax · 5.0% vac · 8.0% maint · 8.0% mgmt
Financing live
Cash to close
- Down payment
- $43,750
- Closing costs
- $5,250
- Reserves months
- —
- Total cash needed
- —
Loan-product check · same deal, 3 products live
Conventional
25% down · 7.5% · 30yr
- Down + closing
- —
- Monthly P&I
- —
- Monthly cashflow
- —
- DSCR
- —
- Eligible?
- —
Personal DTI + credit; lowest rate.
DSCR
20% down · 8.5% · 30yr
- Down + closing
- —
- Monthly P&I
- —
- Monthly cashflow
- —
- DSCR
- —
- Eligible?
- —
No personal income docs; deal must DSCR.
Hard money
10% down · 12.0% · 12mo
- Down + closing
- —
- Monthly P&I
- —
- Monthly cashflow
- —
- DSCR
- —
- Eligible?
- —
Short-term bridge; refi at stabilization.
Rent comps 6 comps
| Address | Beds | Baths | Sqft | Rent | $/sqft | DOM | Units | Dist |
|---|---|---|---|---|---|---|---|---|
| 907 Carriage Circle Ln Unit 901F-CCL Kirkwood, MO | 2.0 | 2.0 | 985 | $1,750 | $1.78 | 43d | 1 | 0.29mi |
| 10820 Big Bend Rd Kirkwood, MO | 2.0 | 1.0 | 1000 | $1,595 | $1.59 | 43d | 1 | 0.47mi |
| 551 S Clay Ave Saint Louis, MO | 3.0 | 2.0 | 1250 | $1,650 | $1.32 | 7d | 1 | 0.68mi |
| 467 S Holmes Ave Unit B Kirkwood, MO | 2.0 | 1.0 | 700 | $1,099 | $1.57 | 23d | 1 | 0.90mi |
| 141 E Madison Ave Kirkwood, MO | 1.0–2.0 | 1.0–2.0 | 1017 | $2,765 | $2.72 | 1d | 9 | 1.11mi |
| 416 N Kirkwood Rd St. Louis, MO | 2.0 | 1.0–2.0 | 890 | $3,751 | $4.21 | 1d | 6 | 1.46mi |
Listing history 18 events
-
2026-06-18days on market $175,000 Active 22 DOM
-
2026-06-17days on market $175,000 Active 21 DOM
-
2026-06-16pricedays on market $175,000 Active 20 DOM
-
2026-06-15days on market $190,000 Active 19 DOM
-
2026-06-13days on market $190,000 Active 17 DOM
-
2026-06-13days on market $190,000 Active 16 DOM
-
2026-06-09days on market $190,000 Active 13 DOM
-
2026-06-08pricedays on market $190,000 Active 12 DOM
-
2026-06-07days on market $200,000 Active 11 DOM
-
2026-06-03days on market $200,000 Active 7 DOM
-
2026-06-02days on market $200,000 Active 6 DOM
-
2026-06-01days on market $200,000 Active 5 DOM
-
2026-05-31days on market $200,000 Active 4 DOM
-
2026-05-27$200,000 Active
-
2026-05-27historical $200,000
-
2015-11-19soldstatus $32,500
-
2010-09-03soldstatus
-
1998-06-11soldstatus $9,000
ⓘ Source: listings_history table (triggers on properties + properties_extension) + one-shot
backfill from property_details.listing_events for pre-trigger history.
Tax reassessment forecast MO · Resets to sale price
- Current annual tax
- $1,737 · $145/mo
- Projected year-2 tax
- $1,737 · $145/mo
- Expected delta
- $0/yr ($0/mo · 0.0%)
ⓘ Screening estimate from a state-policy table — verify with the county assessor before closing.
Climate risk First Street
- Flood 1/10 Low FEMA zone X (unshaded) · 0% chance over 30 yrs
- Wildfire 1/10 Low
- Heat 5/10 Major 7 d/yr ≥107°F today · 21 d/yr by 30 yrs out
- Wind 2/10 Low 100% chance of damaging wind over 30 yrs
- Air quality 3/10 Moderate 2 unhealthy d/yr today · 4 by 30 yrs out
Nearby sold comps map
Loading sold comps map…
Walkable amenities ~0.75 mi
Loading nearby amenities…
Taxation est. · year 1
- Rental income
- $23,484
- − Mortgage interest
- −$9,803
- − Property taxes
- −$1,737
- − Insurance
- −$875
- − Repairs & maintenance
- −$1,879
- − Management
- −$1,879
- − Depreciation
- −$5,091
- Taxable income
- $2,221
- Est. tax owed @ 24.0%
- −$533
- After-tax cash flow
- $4,395/yr
For passive investors: Depreciation is non-cash, so a rental often shows a tax loss while cash-flowing — sheltering income. Rental losses are passive: they offset passive income freely, and up to $25,000/yr can offset ordinary (W-2) income if you actively participate and your MAGI is under $100k (phasing out to $0 by $150k); unused losses carry forward. On sale, claimed depreciation is recaptured at up to 25%, and gains may owe capital-gains tax (a 1031 exchange can defer both). Figures are a year-1 estimate at your 24.0% rate — not tax advice; consult a CPA.
Schools (NCES district)
- District
- Kirkwood R-VII
- NCES district ID
- 2916770
- Math proficiency
- 57% ▼ -9.00%
- Reading proficiency
- 68% ▼ -5.00%
- Median HH income
- $85,581
- Composite
- 56.51/100
- National rank
- #1153
- State rank
- #5 of 324 in MO
Livability — Kirkwood
- Score
- 78/100
- State rank
- #27
- US rank
- #2478
Category grades
Schools grade is shown separately in the Schools card above.
Census & demographics
- Census place
- Kirkwood, MO
- County
- Saint Louis County · 888,823 people
- City population
- 41,634
- Metro
- St. Louis, MO-IL
- Population (ZIP)
- 41,634
- Household income
- $136,385
- Rent vs Own
- Severe rent burden
- 738.0
Population outlook (St. Louis County) Hauer SSP2
- Today (2025)
- 1,025,227 people
- By 2030
- 1,028,023 · +0.3%
- By 2040
- 1,020,940 · -0.4%
- By 2050
- 1,007,280 · -1.8%
- By 2075
- 987,277 · -3.7%
- By 2100
- 921,984 · -10.1%
Race, ethnicity, and origin ACS 2023
- Neighborhood character
- Predominantly White (84%)
- Race & ethnicity
- White 84% Two or more races 8% Black 4% Hispanic / Latino 2% Asian 2%
- Common ancestry
- Lithuanian 3% Italian 3% Slovak 3%
- Foreign-born
- 3% · Canada, China
- Languages at home
- 96% English-only · Spanish 1% Other Indo-European 1% Chinese 1%
Political lean MEDSL · St. Louis
- 2024 margin
- Strong D (+23.4) · D 60.8% · R 37.4% · Other 1.7%
- 2008→2024 swing
- +3.5pp toward D · 2008: 19.9pp · 2024: 23.4pp
- All cycles
- 2024: D+23.4 2020: D+24.0 2016: D+16.2 2012: D+13.7 2008: D+19.9
Not yet ingested
- Civics
- —
Market trends
- HPI YoY
- ▼ -413.98%
- Current HPI
- 242.2782
- Rent YoY
- ▲ 6.63%
- Metro
- St. Louis, MO-IL
- State GDP YoY
- ▲ 1.84%
- F500 in state
- 20
Industry mix (Fortune 500 HQ in MO)
| Industry | F500 HQs | Revenue |
|---|---|---|
| Healthcare | 1 | $163B |
|
||
| Insurance | 1 | $21B |
|
||
| Industrial Technology | 1 | $17B |
|
||
| Retail | 1 | $16B |
|
||
| Industrial Distribution | 1 | $10B |
|
||
| Utilities | 1 | $9B |
|
||
Price history
+2122.2% since first listed5 events — show timeline
- 2026-05-27 Listed $200,000 MARIS as Distributed by MLS Grid
- 2026-05-27 Coming Soon $200,000 MARIS as Distributed by MLS Grid
- 2015-11-19 Sold (Public Records) $32,500 Public Records
- 2010-09-03 Sold (Public Records) — Public Records
- 1998-06-11 Sold (Public Records) $9,000 Public Records
Property tax history
+18.7%/yrLatest (2022): $1,737 · +10.5% YoY. Source: county tax records.
Cash-flow waterfall
monthlySold comps — $/sqft
last 12 mo · ≤1 miLoading sold comps…