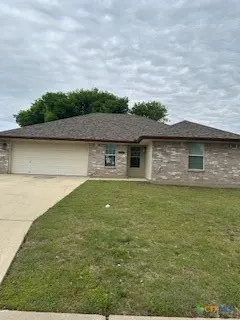
7304 Windchime Way · Temple, TX
Flood risk 1/10 · Minimal
- FEMA flood zone
- X (unshaded)
- Chance of flooding over 30 yrs
- 0.0%
- Est. flood insurance / yr
- $507 – $1,088
Fire risk 4/10 · Minor
- Est. fire insurance / yr
- $1,222 – $2,270
Heat risk 8/10 · Major
- Hot days now (above 108°F)
- 7 days/yr
- Hot days in 30 yrs
- 25 days/yr
Wind risk 8/10 · Major
- Chance of severe wind over 30 yrs
- 80.0%
Air-quality risk 2/10 · Minimal
- Unhealthy air days now
- 0 days/yr
- Unhealthy air days in 30 yrs
- 1 days/yr
Risk factors via First Street. Map © Google.
Why this score? — see what drove the D grade
The composite is a weighted blend of 9 inputs, each scored 0–100. Each bar is that input's sub-score; the figure is the points it added to the 100-point composite (weight × sub-score).
- ARV discount +15.0/15.0
- Cash flow +8.0/30.0
- 1% rule +3.8/10.0
- Schools +3.8/10.0
- Livability +3.8/5.0
- Condition / age +2.5/5.0
- Rent growth +2.3/5.0
- DSCR +2.1/10.0
- Appreciation +0.0/10.0
$214,900
🖨 Deal sheet (PDF) 📄 Offer letter ✓ Due diligence
Listing remarks MLS
Seller is a Licensed Real Estate Agent. Belton school district, Temple address! This 3 bedroom home is ready for a quick move in. No carpet, all vinyl plank flooring throughout. Seller will consider a $4000 repair allowance with a full price offer!
Key facts
- 6,917 sq ft lot
- 2 garage spots
- Built 2005
Neighborhood map
What this means for you Summary
Snapshot
- This is a 3-bed/2.0-bath single-family listed at $215k.
Deal economics
- At list price, monthly cash flow is $-220 ($-3k/yr) — negative.
- To cash-flow at today's rent, offer at most $176k (18.1% below list).
- To meet the 1% rule (rent ≥ 1% of price), the offer needs to be $190k (11.6% below list).
- Recommended offer: $176k (18.1% below list) — sets the bar for cash-flow.
- Cap rate 5.1% vs local median 3.6% in Temple — top-decile yield for the area; either an underpriced asset or a hidden risk that comps aren't pricing in. Stress-test before assuming the spread holds.
Location & tenants
- Location reads 75/100 on livability (#122 in TX, #3,814 nationally) — a middle-class / working-renter tenant base. Strengths: cost of living A+, housing A+, health & safety A+; Watch: commute C-, crime D+, employment D+.
- Belton ISD (suburban): math 39% / reading 46% proficiency, ranked #285 of 826 in TX (top 34%) — families likely to look elsewhere, expect single-tenant / working-renter base with shorter leases.
- Zoned schools: Joe M Pirtle El (math 51% / reading 49%, grade D+, #849 of 4,322 statewide, top 20%, 606 students, 42% FRL); Lake Belton Middle (math 47% / reading 52%, grade C, #356 of 1,662 statewide, top 23%, 826 students, 30% FRL); Belton H S (math 39% / reading 46%, grade F, #721 of 1,632 statewide, top 45%, 1,941 students, 46% FRL) — zoned schools at 40% FRL track the district average.
- Market conditions: Rents soft (-0.8%/yr); 1126 active listings in the ZIP; 40 comparable units currently listed for rent nearby; rentals lingering (median 46d on market — plan ~5-8 weeks vacancy on turnover, expect pricing pressure); 60% of comp listings sitting > 30 days — soft ceiling on asking rent; solid renter incomes; 3,222 units permitted in Bell County in 2024 (246 in 5+ unit buildings).
Forward outlook
- Local home prices are declining (-3.0%/yr); year-one equity from $1k of loan paydown is wiped out by about $6k of value loss. Plan a longer hold.
- Bell County population projected at +21% by 2050 — long-run rental-demand tailwind backs the buy-and-hold thesis.
Negotiation context
- It's been on market 68 days — a 6% lower offer ($202k) is reasonable based on typical stale-listing flexibility.
- 3 sale attempts since 16y ago with the ask held roughly flat each time — persistent listings suggest the price (not the market) is what's stuck; bring a comps-based counter.
Risks & watch-outs
- Watch-outs: property tax is 2.8% of price.
- Climate carrying-cost: severe wind risk, 80% chance of damaging wind over 30y; extreme-heat days projected 7→25/yr by 2055 (HVAC capex compounding) — expect insurance premiums to compound above CPI over the hold.
Questions for the listing agent
- What do current leases actually rent for vs. the listed asking? Can we see a recent rent roll and the last 12 months of T-12 income?
- It's been on market 68 days. Have you received any prior offers? Is the seller open to a 18% concession, seller financing, or rate buy-down credit?
- Property tax is high relative to price — has the assessment been appealed recently, and will the sale trigger a re-assessment?
- Why hasn't it sold? Are there any deal-killer items the seller is aware of (foundation, flood, title, zoning, code violations)?
- Is there a deadline driving the sale (1031 exchange, divorce, estate, relocation)? That informs how much negotiation room exists.
- Crime grade is D in this area — have there been break-ins, vandalism, or insurance claims at this property in the last 3 years? What carrier currently insures it and at what premium?
- The area grade is low — what's the realistic commute time and amenity access for the typical tenant pool here? Any planned neighborhood developments (good or bad) we should know about?
- What's the average days-on-market for RENTAL listings here right now (not sales)? A rising rental-DOM trend means longer vacancies and softer asking-rent achievability than the comps imply.
- What's the recent tenant-quality profile in this submarket — average credit score on applications, eviction rate, late-payment / NSF rate, and stable-employment percentage? A property-management company in the area should have these aggregated.
- How much new for-sale + rental construction is in the pipeline within 1–3 miles? Heavy new supply typically softens prices + rents 12–24 months out; constrained supply supports both.
Investment metrics
- 1% rule
- 0.88% ✗
- Cap rate
- 5.07%
- Cash-on-cash
- -4.38%
- DSCR
- 0.81
- GRM
- 9.4
CMA / ARV
- ARV (median comp)
- $311,873
- List price
- $214,900
- Delta
- -31.09%
- Verdict
- UNDERPRICED
- Comps
- 20 within 1.0 mi
Show comp detail 11 sales within ~0.75 mi
| Address | Dist | Beds/Ba | Sqft | Sold | Price | $/sf | Match |
|---|---|---|---|---|---|---|---|
| 7713 Purvis St | 0.37mi | 4/2.0 (+1) | 1,536 (-4%) | 1mo | $255,516 | $166 | 71 |
| 7606 Hickman St | 0.27mi | 4/2.0 (+1) | 1,631 (+2%) | 11mo | $274,900 | $169 | 69 |
| 7618 Hickman St | 0.30mi | 3/2.0 | 1,744 (+10%) | 2mo | $288,000 | $165 | 68 |
| 7709 Mcculloch Rd | 0.33mi | 4/2.0 (+1) | 1,710 (+8%) | 1mo | $280,000 | $164 | 66 |
| 7414 Hickman St | 0.22mi | 4/2.0 (+1) | 1,753 (+10%) | 2mo | $293,000 | $167 | 66 |
| 7619 Mcculloch Rd | 0.31mi | 4/3.0 (+1) | 1,785 (+12%) | 2mo | $300,000 | $168 | 55 |
| 1805 Shadow Canyon Dr | 0.48mi | 3/2.0 | 1,629 (+2%) | 24mo | $315,000 | $193 | 54 |
| 1220 Neuberry Cliffe | 0.70mi | 3/2.0 | 1,454 (-9%) | 2mo | $255,000 | $175 | 51 |
| 1316 Branchwood Way | 0.64mi | 4/2.0 (+1) | 1,722 (+8%) | 2mo | $275,000 | $160 | 49 |
| 7109 Hammermill Ln | 0.66mi | 3/2.0 | 1,751 (+10%) | 6mo | $287,900 | $164 | 47 |
| 1303 Neuberry Cliffe | 0.65mi | 3/2.0 | 1,387 (-13%) | 7mo | $225,000 | $162 | 43 |
Match score weights: distance 35% · size 25% · config 20% · recency 20%. Top-matched comps best support the ARV.
Projected returns pro-forma
-3.0% appreciation · 0.0% rent growth · sell at horizon
- IRR
- -27.6%
- Equity multiple
- 0.10×
- Total profit
- $-54,202
- Equity at exit
- $32,042
- IRR
- -46.4%
- Equity multiple
- -0.43×
- Total profit
- $-86,014
- Equity at exit
- $18,581
Cash invested: $60,172 (down + closing). Projections, not guarantees.
Landlord ↔ Tenant lean methodology
- Overall (STATE)
- 87 Strongly Landlord-Friendly
- State Texas
- 87 Strongly Landlord-Friendly · R+5
- County
- — inherits STATE
- City
- — inherits STATE
ZIP-level market 76502
- Rents YoY
- -0.8%
- Active inventory
- 1126
- Price-to-rent
- 9.4×
Monthly cashflow live
- Estimated rent
- $1,899 high interval (Pro) →
- Mortgage (P&I)
- −$1,127
- Tax from tax record
- −$503 /mo · $6,040/yr
- Insurance
- −$90
- HOA
- −$0
- Vacancy / Maint / Mgmt
- −$399
- Net cashflow
- $-220
Break-even live
Sensitivity live
| Price | -10% $-98 | -5% $-159 | +0% $-220 | +5% $-280 | +10% $-341 |
|---|---|---|---|---|---|
| Rent | -10% $-370 | -5% $-295 | +0% $-220 | +5% $-145 | +10% $-70 |
| Rate | -1.0pp $-111 | -0.5pp $-165 | base $-220 | +0.5pp $-275 | +1.0pp $-332 |
UW: 25.0% down · 7.5% · 30yr · 1.5% tax · 5.0% vac · 8.0% maint · 8.0% mgmt
Financing live
Cash to close
- Down payment
- $53,725
- Closing costs
- $6,447
- Reserves months
- —
- Total cash needed
- —
Loan-product check · same deal, 3 products live
Conventional
25% down · 7.5% · 30yr
- Down + closing
- —
- Monthly P&I
- —
- Monthly cashflow
- —
- DSCR
- —
- Eligible?
- —
Personal DTI + credit; lowest rate.
DSCR
20% down · 8.5% · 30yr
- Down + closing
- —
- Monthly P&I
- —
- Monthly cashflow
- —
- DSCR
- —
- Eligible?
- —
No personal income docs; deal must DSCR.
Hard money
10% down · 12.0% · 12mo
- Down + closing
- —
- Monthly P&I
- —
- Monthly cashflow
- —
- DSCR
- —
- Eligible?
- —
Short-term bridge; refi at stabilization.
Rent comps 40 comps
| Address | Beds | Baths | Sqft | Rent | $/sqft | DOM | Units | Dist |
|---|---|---|---|---|---|---|---|---|
| 7215 Upland Bend Dr Temple, TX | 3.0 | 2.0 | 1646 | $1,650 | $1.00 | 25d | 1 | 0.13mi |
| 1948 Lively Ln Unit A Temple, TX | 3.0 | 2.0 | 1235 | $1,575 | $1.28 | 45d | 1 | 0.25mi |
| 2608 Inca Dove Dr Temple, TX | 4.0 | 2.0 | 1838 | $2,250 | $1.22 | 46d | 1 | 0.29mi |
| 1924 Hayes St Temple, TX | 4.0 | 3.0 | 2031 | $2,495 | $1.23 | 45d | 1 | 0.46mi |
| 1924 Hayes St Temple, TX | 4.0 | 3.0 | 2031 | $2,500 | $1.23 | 25d | 1 | 0.46mi |
| 1126 Neuberry Cliffe Temple, TX | 3.0 | 2.0 | 1597 | $1,750 | $1.10 | 25d | 1 | 0.76mi |
| 1112 Pinwheel Dr Temple, TX | 3.0 | 2.0 | 1662 | $2,150 | $1.29 | 45d | 1 | 0.77mi |
| 1113 Branchwood Way Temple, TX | 3.0 | 2.0 | 1453 | $1,625 | $1.12 | 45d | 1 | 0.79mi |
| 1022 Neuberry Cliffe Temple, TX | 3.0 | 2.0 | 1468 | $1,695 | $1.15 | 45d | 1 | 0.84mi |
| 8210 Sunset Trl Temple, TX | 4.0 | 2.0 | 1434 | $1,650 | $1.15 | 23d | 1 | 0.84mi |
| 1722 Bent Oak Dr Temple, TX | 3.0 | 2.0 | 1293 | $1,650 | $1.28 | 45d | 1 | 0.91mi |
| 8332 Saddle Brook Dr Unit B Temple, TX | 3.0 | 2.0 | 1100 | $1,250 | $1.14 | 45d | 1 | 0.93mi |
| 816 Copper Ridge Loop Temple, TX | 3.0 | 2.0 | 2200 | $2,145 | $0.97 | 15d | 1 | 1.04mi |
| 716 Copper Ridge Loop Temple, TX | 4.0 | 2.0 | 1712 | $2,100 | $1.23 | 25d | 1 | 1.10mi |
| 812 Meiomi Dr Temple, TX | 3.0 | 2.5 | 1387 | $1,495 | $1.08 | 45d | 1 | 1.13mi |
| 620 Copper Ridge Loop Temple, TX | 4.0 | 2.0 | 1712 | $2,195 | $1.28 | 45d | 1 | 1.13mi |
| 746 Meiomi Dr Temple, TX | 3.0 | 2.5 | 1387 | $1,695 | $1.22 | 45d | 1 | 1.14mi |
| 739 Meiomi Dr Temple, TX | 3.0 | 2.5 | 1387 | $1,495 | $1.08 | 45d | 1 | 1.15mi |
| 742 Meiomi Dr Temple, TX | 4.0 | 2.5 | 1538 | $1,695 | $1.10 | 45d | 1 | 1.15mi |
| 821 Woodhollow Dr Temple, TX | 3.0 | 2.0 | 1537 | $2,000 | $1.30 | 45d | 1 | 1.15mi |
| 729 Meiomi Dr Temple, TX | 3.0 | 2.5 | 1387 | $1,695 | $1.22 | 45d | 1 | 1.17mi |
| 1502 Cedar Ln Temple, TX | 3.0 | 2.0 | 1384 | $1,595 | $1.15 | 15d | 1 | 1.17mi |
| 719 Meiomi Dr Temple, TX | 4.0 | 2.5 | 1585 | $1,995 | $1.26 | 45d | 1 | 1.19mi |
| 7108B Cameron Park Rd Temple, TX | 3.0 | 2.0 | 1350 | $1,395 | $1.03 | 25d | 1 | 1.20mi |
| 709 Meiomi Dr Temple, TX | 4.0 | 2.5 | 1538 | $1,695 | $1.10 | 45d | 1 | 1.21mi |
| 613 Rock Meadow Ln Temple, TX | 4.0 | 2.0 | 1934 | $2,095 | $1.08 | 45d | 1 | 1.22mi |
| 707 Meiomi Dr Temple, TX | 3.0 | 2.5 | 1387 | $1,495 | $1.08 | 45d | 1 | 1.22mi |
| 619 Meiomi Dr Temple, TX | 4.0 | 2.5 | 1538 | $1,695 | $1.10 | 45d | 1 | 1.23mi |
| 617 Meiomi Dr Temple, TX | 3.0 | 2.5 | 1387 | $1,695 | $1.22 | 45d | 1 | 1.23mi |
| 610 Rock Meadow Ln Temple, TX | 4.0 | 2.0 | 1934 | $2,095 | $1.08 | 15d | 1 | 1.24mi |
| 607 Hayfield Ln Temple, TX | 4.0 | 2.0 | 1934 | $2,095 | $1.08 | 25d | 1 | 1.25mi |
| 510 Sanders Farm Rd Temple, TX | 4.0 | 2.0 | 1940 | $2,095 | $1.08 | 15d | 6 | 1.25mi |
| 604 Hayfield Ln Temple, TX | 4.0 | 2.0 | 1934 | $2,095 | $1.08 | 25d | 1 | 1.27mi |
| 526 Rock Meadow Ln Temple, TX | 4.0 | 2.0 | 1934 | $2,095 | $1.08 | 45d | 1 | 1.27mi |
| 523 Hayfield Ln Temple, TX | 4.0 | 2.0 | 1934 | $2,095 | $1.08 | 45d | 1 | 1.28mi |
| 602 Thistle Brook Dr Temple, TX | 4.0 | 2.0 | 1934 | $2,095 | $1.08 | 25d | 1 | 1.29mi |
| 525 Thistle Brook Dr Temple, TX | 4.0 | 2.0 | 1934 | $2,095 | $1.08 | 25d | 1 | 1.29mi |
| 513 Thistle Brook Dr Temple, TX | 4.0 | 2.0 | 1934 | $2,095 | $1.08 | 25d | 1 | 1.32mi |
| 518 Thistle Brook Dr Temple, TX | 4.0 | 2.0 | 1934 | $2,095 | $1.08 | 25d | 1 | 1.32mi |
| 515 Big Oak Trl Temple, TX | 4.0 | 2.0 | 1934 | $2,095 | $1.08 | 45d | 1 | 1.34mi |
Listing history 26 events
-
2026-06-21days on market $214,900 Active 68 DOM
-
2026-06-18days on market $214,900 Active 65 DOM
-
2026-06-17days on market $214,900 Active 64 DOM
-
2026-06-16days on market $214,900 Active 63 DOM
-
2026-06-15days on market $214,900 Active 62 DOM
-
2026-06-14days on market $214,900 Active 60 DOM
-
2026-06-13days on market $214,900 Active 59 DOM
-
2026-06-09days on market $214,900 Active 56 DOM
-
2026-06-08days on market $214,900 Active 55 DOM
-
2026-06-07days on market $214,900 Active 54 DOM
-
2026-06-05days on market $214,900 Active 51 DOM
-
2026-06-03days on market $214,900 Active 50 DOM
-
2026-06-02days on market $214,900 Active 49 DOM
-
2026-06-01days on market $214,900 Active 48 DOM
-
2026-05-31days on market $214,900 Active 47 DOM
-
2026-05-30days on market $214,900 Active 46 DOM
-
2026-05-08price $214,900 249-char remark
Show marketing remark (249 chars)
Seller is a Licensed Real Estate Agent. Belton school district, Temple address! This 3 bedroom home is ready for a quick move in. No carpet, all vinyl plank flooring throughout. Seller will consider a $4000 repair allowance with a full price offer!
-
2026-04-14$219,900 Active 249-char remark
Show marketing remark (249 chars)
Seller is a Licensed Real Estate Agent. Belton school district, Temple address! This 3 bedroom home is ready for a quick move in. No carpet, all vinyl plank flooring throughout. Seller will consider a $4000 repair allowance with a full price offer!
-
2022-04-01price $1,595
-
2011-07-18soldstatus
-
2011-06-30historical
-
2010-10-06$110,000
-
2010-10-01historical
-
2010-05-04$119,900
-
2007-04-23soldstatus
-
2005-01-26soldstatus
ⓘ Source: listings_history table (triggers on properties + properties_extension) + one-shot
backfill from property_details.listing_events for pre-trigger history.
Tax reassessment forecast TX · Resets to sale price
- Current annual tax
- $6,040 · $503/mo
- Projected year-2 tax
- $6,040 · $503/mo
- Expected delta
- $0/yr ($0/mo · 0.0%)
ⓘ Screening estimate from a state-policy table — verify with the county assessor before closing.
Climate risk First Street
- Flood 1/10 Low FEMA zone X (unshaded) · 0% chance over 30 yrs
- Wildfire 4/10 Moderate
- Heat 8/10 Severe 7 d/yr ≥108°F today · 25 d/yr by 30 yrs out
- Wind 8/10 Severe 80% chance of damaging wind over 30 yrs
- Air quality 2/10 Low 0 unhealthy d/yr today · 1 by 30 yrs out
Nearby sold comps map
Loading sold comps map…
Walkable amenities ~0.75 mi
Loading nearby amenities…
Taxation est. · year 1
- Rental income
- $22,789
- − Mortgage interest
- −$12,038
- − Property taxes
- −$6,040
- − Insurance
- −$1,074
- − Repairs & maintenance
- −$1,823
- − Management
- −$1,823
- − Depreciation
- −$6,252
- Taxable loss
- −$6,262
- Est. tax savings @ 24.0%
- +$1,503
- After-tax cash flow
- $-1,132/yr
For passive investors: Depreciation is non-cash, so a rental often shows a tax loss while cash-flowing — sheltering income. Rental losses are passive: they offset passive income freely, and up to $25,000/yr can offset ordinary (W-2) income if you actively participate and your MAGI is under $100k (phasing out to $0 by $150k); unused losses carry forward. On sale, claimed depreciation is recaptured at up to 25%, and gains may owe capital-gains tax (a 1031 exchange can defer both). Figures are a year-1 estimate at your 24.0% rate — not tax advice; consult a CPA.
Schools (NCES district)
- District
- Belton ISD
- NCES district ID
- 4809860
- Math proficiency
- 39% ▼ -14.00%
- Reading proficiency
- 46% ▼ -4.00%
- Median HH income
- $61,239
- Composite
- 37.62/100
- National rank
- #4378
- State rank
- #285 of 826 in TX
Livability — Temple
- Score
- 75/100
- State rank
- #122
- US rank
- #3814
Category grades
Schools grade is shown separately in the Schools card above.
Census & demographics
- Census place
- Temple, TX
- County
- Bell County · 345,090 people
- City population
- 96,587
- Metro
- Killeen-Temple, TX
- Population (ZIP)
- 52,669
- Household income
- $82,088
- Rent vs Own
- Severe rent burden
- 1890.0
Population outlook (Bell County) Hauer SSP2
- Today (2025)
- 371,114 people
- By 2030
- 389,104 · +4.8%
- By 2040
- 420,592 · +13.3%
- By 2050
- 447,779 · +20.7%
- By 2075
- 499,130 · +34.5%
- By 2100
- 505,680 · +36.3%
Race, ethnicity, and origin ACS 2023
- Neighborhood character
- Diverse neighborhood (Simpson 0.59)
- Race & ethnicity
- White 58% Hispanic / Latino 26% Two or more races 15% Black 9% Asian 3%
- Hispanic origin (detail)
- Mexican 21% Puerto Rican 2%
- Common ancestry
- Italian 2% Slovak 2% Serbian 1%
- Foreign-born
- 7% · Canada, South Korea, China
- Languages at home
- 86% English-only · Spanish 10% Other Indo-European 1% Korean 1%
Political lean MEDSL · Bell
- 2024 margin
- R (+16.2) · D 41.3% · R 57.6% · Other 1.1%
- 2008→2024 swing
- -6.5pp toward R · 2008: -9.8pp · 2024: -16.2pp
- All cycles
- 2024: R+16.2 2020: R+8.5 2016: R+15.1 2012: R+16.4 2008: R+9.8
Not yet ingested
- Civics
- —
Market trends
- HPI YoY
- ▼ -216.80%
- Current HPI
- 166.927
- Rent YoY
- ▼ -0.79%
- Metro
- Killeen-Temple, TX
- State GDP YoY
- ▲ 3.95%
- F500 in state
- 110
Industry mix (Fortune 500 HQ in TX)
| Industry | F500 HQs | Revenue |
|---|---|---|
| Energy | 16 | $1,198B |
|
||
| Technology | 5 | $198B |
|
||
| Engineering / Construction | 4 | $72B |
|
||
| Energy Services | 3 | $60B |
|
||
| Utilities | 3 | $41B |
|
||
| Healthcare | 2 | $330B |
|
||
Price history
+79.2% since first listed10 events — show timeline
- 2026-05-08 Price Changed $214,900 CTXMLS
- 2026-04-14 Listed $219,900 CTXMLS
- 2022-04-01 Price Changed $1,595 RENT.
- 2011-07-18 Sold (Public Records) — Public Records
- 2011-06-30 Listing Removed — CTXMLS
- 2010-10-06 Listed $110,000 CTXMLS
- 2010-10-01 Listing Removed — CTXMLS
- 2010-05-04 Listed $119,900 CTXMLS
- 2007-04-23 Sold (Public Records) — Public Records
- 2005-01-26 Sold (Public Records) — Public Records
Property tax history
+6.7%/yrLatest (2025): $6,040 · +4.2% YoY. Source: county tax records.
Cash-flow waterfall
monthlySold comps — $/sqft
last 12 mo · ≤1 miLoading sold comps…