53 Sherill Dr · Mount Pleasant, PA
Flood risk 4/10 · Minor
- FEMA flood zone
- X (unshaded)
- Chance of flooding over 30 yrs
- 0.24%
- Est. flood insurance / yr
- $507 – $1,088
Fire risk 1/10 · Minimal
- Est. fire insurance / yr
- $511 – $949
Heat risk 5/10 · Moderate
- Hot days now (above 102°F)
- 7 days/yr
- Hot days in 30 yrs
- 15 days/yr
Wind risk 4/10 · Minor
- Chance of severe wind over 30 yrs
- 7.0%
Air-quality risk 2/10 · Minimal
- Unhealthy air days now
- 1 days/yr
- Unhealthy air days in 30 yrs
- 3 days/yr
Risk factors via First Street. Map © Google.
Why this score? — see what drove the B- grade
The composite is a weighted blend of 9 inputs, each scored 0–100. Each bar is that input's sub-score; the figure is the points it added to the 100-point composite (weight × sub-score).
- Cash flow +26.9/30.0
- 1% rule +10.0/10.0
- DSCR +9.3/10.0
- ARV discount +7.5/15.0
- Schools +4.1/10.0
- Livability +3.6/5.0
- Rent growth +2.5/5.0
- Condition / age +2.5/5.0
- Appreciation +0.0/10.0
$78,000
🖨 Deal sheet 📄 Offer letter ✓ Due diligence
Listing remarks
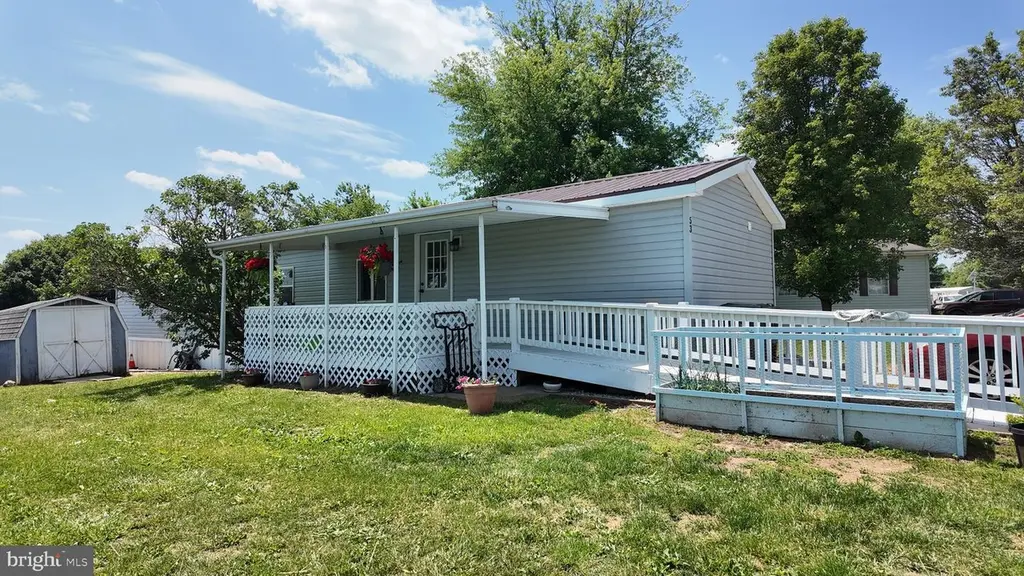
53 Sherill Drive, New Oxford, PA 17350 Welcome home to this charming 3-bedroom, 2-bathroom single-wide manufactured home on a premium corner lot in a friendly, well-maintained community! This beautifully maintained home boasts excellent curb appeal featuring light-colored siding, a covered front porch, and a spacious wooden deck — perfect for morning coffee or evening relaxation. The desirable corner lot provides significantly more outdoor space for entertaining, gardening, or enjoying the fresh air. Recent Updates: * New metal roof (2020) * Bathroom remodel with new drywall * New flooring throughout * New water heater (2025) Key Features: * 3 generously sized bedrooms * 2
Key facts
- 2 parking spots
- Built 1980
- Listed 20 days
Property features AI
Finance
- Other: Property manager present; Year built source: Assessor; Above-grade finished area source: Assessor; Ownership interest: Fee simple
- HOA & community: HOA fee of $745 monthly
Exterior
- Parking: Driveway parking; Driveway fits 2 vehicles; Total of 2 garage and parking spaces
- Utilities: Water: Private/Community; Hot water: Natural gas; Heating fuel: Oil; Cooling fuel: Other
- Home design: Manufactured property; Above-grade finished area reported as 924 (assessor); Fee simple ownership
- Construction: Vinyl siding; Other structures above and below grade
- Exterior features: Not in a federal flood zone; Private or community water
Interior
- Bedrooms: 3 bedrooms on the main level
- Bathrooms: 2 full bathrooms on the main level
- Heating & cooling: Window cooling units; Heating system: Other; Oil-fired heating; Hot water: Natural gas
- Interior features: No basement; Living area measured by assessor
Neighborhood map
What this means for you Summary
Snapshot
- This is a 2-bed/1.0-bath manufactured listed at $78k.
Deal economics
- At list price, monthly cash flow is $215 ($3k/yr) — positive.
- The deal already cash-flows at list — no discount required.
- Meets the 1% rule at list price ($2k rent vs $78k).
- Recommended offer: $77k (1.5% below list) — sets the bar for market timing.
- Cap rate 9.6% vs local median 1.8% in Mount Pleasant — top-decile yield for the area; either an underpriced asset or a hidden risk that comps aren't pricing in. Stress-test before assuming the spread holds.
Location & tenants
- Location reads 72/100 on livability (#647 in PA) — a middle-class / working-renter tenant base. Strengths: crime A+, cost of living A+, housing A+; Watch: amenities F, commute F, employment F.
- Conewago Valley SD (suburban): math 39% / reading 56% proficiency, ranked #215 of 539 in PA (top 40%) — families likely to look elsewhere, expect single-tenant / working-renter base with shorter leases.
- Market conditions: 54 active listings in the ZIP; 403 units permitted in Adams County in 2024 (0 in 5+ unit buildings).
Forward outlook
- Local home prices are declining (-3.0%/yr); year-one equity from $539 of loan paydown is wiped out by about $2k of value loss. Plan a longer hold.
- Adams County population projected at -10% by 2050 — secular population decline; favor cash flow + early exit over multi-decade hold.
- At projected returns (-3.0% appreciation + 3.0% rent growth), your $22k cash investment doubles in ~9 years — after that, you're playing with house money.
Negotiation context
- It's been on market 20 days — a 2% lower offer ($77k) is reasonable based on typical stale-listing flexibility.
Risks & watch-outs
- Watch-outs: HOA is 41% of rent.
- Climate carrying-cost: extreme-heat days projected 7→15/yr by 2055 (HVAC capex compounding) — expect insurance premiums to compound above CPI over the hold.
Questions for the listing agent
- What does the HOA fee cover, when was the last increase, and are there any pending special assessments or reserve-fund shortfalls?
- Is there a deadline driving the sale (1031 exchange, divorce, estate, relocation)? That informs how much negotiation room exists.
- What's the average days-on-market for RENTAL listings here right now (not sales)? A rising rental-DOM trend means longer vacancies and softer asking-rent achievability than the comps imply.
- What's the recent tenant-quality profile in this submarket — average credit score on applications, eviction rate, late-payment / NSF rate, and stable-employment percentage? A property-management company in the area should have these aggregated.
- How much new for-sale + rental construction is in the pipeline within 1–3 miles? Heavy new supply typically softens prices + rents 12–24 months out; constrained supply supports both.
Investment metrics
- 1% rule
- 2.31% ✓
- Cap rate
- 9.61%
- Cash-on-cash
- 11.84%
- DSCR
- 1.53
- GRM
- 3.6
CMA / ARV
No comps found within radius.
Projected returns pro-forma
-3.0% appreciation · 3.0% rent growth · sell at horizon
- IRR
- 1.8%
- Equity multiple
- 1.07×
- Total profit
- $1,519
- Equity at exit
- $11,630
- IRR
- 11.8%
- Equity multiple
- 1.95×
- Total profit
- $20,774
- Equity at exit
- $6,744
Cash invested: $21,840 (down + closing). Projections, not guarantees.
Landlord ↔ Tenant lean methodology
- Overall (STATE)
- 62 Landlord-Friendly
- State Pennsylvania
- 62 Landlord-Friendly · EVEN
- County
- — inherits STATE
- City
- — inherits STATE
ZIP-level market 17350
- Home prices YoY
- -20.7%
- Active inventory
- 54
- Price-to-rent
- 3.6×
Monthly cashflow live
- Estimated rent
- $1,804 medium interval (Pro) →
- Mortgage (P&I)
- −$409
- Tax from tax record
- −$23 /mo · $277/yr
- Insurance
- −$32
- HOA
- −$745
- Vacancy / Maint / Mgmt
- −$379
- Net cashflow
- $215
Break-even live
UW: 25.0% down · 7.5% · 30yr · 1.5% tax · 5.0% vac · 8.0% maint · 8.0% mgmt
Financing live
Cash to close
- Down payment
- $19,500
- Closing costs
- $2,340
- Reserves months
- —
- Total cash needed
- —
Loan-product check · same deal, 3 products live
Conventional
25% down · 7.5% · 30yr
- Down + closing
- —
- Monthly P&I
- —
- Monthly cashflow
- —
- DSCR
- —
- Eligible?
- —
Personal DTI + credit; lowest rate.
DSCR
20% down · 8.5% · 30yr
- Down + closing
- —
- Monthly P&I
- —
- Monthly cashflow
- —
- DSCR
- —
- Eligible?
- —
No personal income docs; deal must DSCR.
Hard money
10% down · 12.0% · 12mo
- Down + closing
- —
- Monthly P&I
- —
- Monthly cashflow
- —
- DSCR
- —
- Eligible?
- —
Short-term bridge; refi at stabilization.
HOA detail
- Monthly dues
- $745 · $8,940/yr
- Likely covers
- water
Listing history 15 events
-
2026-06-18days on market $78,000 Active 20 DOM
-
2026-06-17days on market $78,000 Active 19 DOM
-
2026-06-16days on market $78,000 Active 18 DOM
-
2026-06-15days on market $78,000 Active 17 DOM
-
2026-06-14days on market $78,000 Active 15 DOM
-
2026-06-13days on market $78,000 Active 14 DOM
-
2026-06-10days on market $78,000 Active 12 DOM
-
2026-06-09days on market $78,000 Active 11 DOM
-
2026-06-08days on market $78,000 Active 10 DOM
-
2026-06-07days on market $78,000 Active 9 DOM
-
2026-06-02days on market $78,000 Active 4 DOM
-
2026-06-01days on market $78,000 Active 3 DOM
-
2026-05-31days on market $78,000 Active 2 DOM
-
2026-05-30statusdays on market $78,000 Active 1 DOM
-
2026-05-16historical $78,000
ⓘ Source: listings_history table (triggers on properties + properties_extension) + one-shot
backfill from property_details.listing_events for pre-trigger history.
Tax reassessment forecast PA · Partial reset (capped growth)
- Current annual tax
- $277 · $23/mo
- Projected year-2 tax
- $755 · $63/mo
- Expected delta
- +$478/yr (+$40/mo · 172.5%)
ⓘ Screening estimate from a state-policy table — verify with the county assessor before closing.
Climate risk First Street
- Flood 4/10 Moderate FEMA zone X (unshaded) · 24% chance over 30 yrs
- Wildfire 1/10 Low
- Heat 5/10 Major 7 d/yr ≥102°F today · 15 d/yr by 30 yrs out
- Wind 4/10 Moderate 7% chance of damaging wind over 30 yrs
- Air quality 2/10 Low 1 unhealthy d/yr today · 3 by 30 yrs out
Nearby sold comps map
Loading sold comps map…
Walkable amenities ~0.75 mi
Loading nearby amenities…
Taxation est. · year 1
- Rental income
- $21,646
- − Mortgage interest
- −$4,369
- − Property taxes
- −$277
- − Insurance
- −$390
- − Repairs & maintenance
- −$1,732
- − Management
- −$1,732
- − HOA
- −$8,940
- − Depreciation
- −$2,269
- Taxable income
- $1,937
- Est. tax owed @ 24.0%
- −$465
- After-tax cash flow
- $2,120/yr
For passive investors: Depreciation is non-cash, so a rental often shows a tax loss while cash-flowing — sheltering income. Rental losses are passive: they offset passive income freely, and up to $25,000/yr can offset ordinary (W-2) income if you actively participate and your MAGI is under $100k (phasing out to $0 by $150k); unused losses carry forward. On sale, claimed depreciation is recaptured at up to 25%, and gains may owe capital-gains tax (a 1031 exchange can defer both). Figures are a year-1 estimate at your 24.0% rate — not tax advice; consult a CPA.
Schools (NCES district)
- District
- Conewago Valley SD
- NCES district ID
- 4206550
- Math proficiency
- 39% ▼ -15.00%
- Reading proficiency
- 56% ▼ -11.00%
- Median HH income
- $54,603
- Composite
- 41.08/100
- National rank
- #3572
- State rank
- #215 of 539 in PA
Livability — Mount Pleasant
- Score
- 72/100
- State rank
- #647
- US rank
- #6287
Category grades
Schools grade is shown separately in the Schools card above.
Census & demographics
- Population (ZIP)
- 13,219
Population outlook (Adams County) Hauer SSP2
- Today (2025)
- 102,494 people
- By 2030
- 101,890 · -0.6%
- By 2040
- 98,417 · -4.0%
- By 2050
- 92,014 · -10.2%
- By 2075
- 76,128 · -25.7%
- By 2100
- 58,931 · -42.5%
Race, ethnicity, and origin ACS 2023
- Neighborhood character
- Predominantly White (89%)
- Race & ethnicity
- White 89% Hispanic / Latino 10% Two or more races 3%
- Hispanic origin (detail)
- Mexican 6% Puerto Rican 4%
- Common ancestry
- Slovak 2% Lithuanian 2% Romanian 1%
- Foreign-born
- 3% · Canada
- Languages at home
- 92% English-only · Spanish 7%
Political lean MEDSL · Adams
- 2024 margin
- Solid R (+33.6) · D 32.7% · R 66.4%
- 2008→2024 swing
- -14.1pp toward R · 2008: -19.6pp · 2024: -33.6pp
- All cycles
- 2024: R+33.6 2020: R+34.1 2016: R+36.4 2012: R+27.6 2008: R+19.6
Not yet ingested
- Civics
- —
Market trends
- HPI YoY
- ▼ -76.47%
- Current HPI
- 293.6445
- Rent YoY
- —
- Metro
- —
- State GDP YoY
- ▲ 1.68%
- F500 in state
- 34
Industry mix (Fortune 500 HQ in PA)
| Industry | F500 HQs | Revenue |
|---|---|---|
| Healthcare | 2 | $309B |
|
||
| Insurance | 2 | $27B |
|
||
| Telecommunications / Media | 1 | $124B |
|
||
| Industrial Distribution | 1 | $22B |
|
||
| Financial Services | 1 | $20B |
|
||
| Chemicals / Materials | 1 | $18B |
|
||
Price history
1 event — show timeline
- 2026-05-16 Coming Soon $78,000 BRIGHT MLS
Property tax history
+3.7%/yrLatest (2026): $277 · +1.9% YoY. Source: county tax records.
Cash-flow waterfall
monthlySold comps — $/sqft
last 12 mo · ≤1 miLoading sold comps…