2014 Watermark Pl · Columbia, SC
Flood risk 1/10 · Minimal
- FEMA flood zone
- X (unshaded)
- Chance of flooding over 30 yrs
- 0.0%
- Est. flood insurance / yr
- $507 – $1,088
Fire risk 2/10 · Minimal
- Est. fire insurance / yr
- $783 – $1,453
Heat risk 6/10 · Moderate
- Hot days now (above 109°F)
- 7 days/yr
- Hot days in 30 yrs
- 16 days/yr
Wind risk 6/10 · Moderate
- Chance of severe wind over 30 yrs
- 68.0%
Air-quality risk 3/10 · Minor
- Unhealthy air days now
- 2 days/yr
- Unhealthy air days in 30 yrs
- 2 days/yr
Risk factors via First Street. Map © Google.
Why this score? — see what drove the B- grade
The composite is a weighted blend of 9 inputs, each scored 0–100. Each bar is that input's sub-score; the figure is the points it added to the 100-point composite (weight × sub-score).
- Cash flow +26.9/30.0
- 1% rule +9.7/10.0
- DSCR +9.3/10.0
- ARV discount +7.5/15.0
- Livability +3.9/5.0
- Rent growth +3.8/5.0
- Schools +2.6/10.0
- Condition / age +2.5/5.0
- Appreciation +0.0/10.0
$116,900
🖨 Deal sheet (PDF) 📄 Offer letter ✓ Due diligence
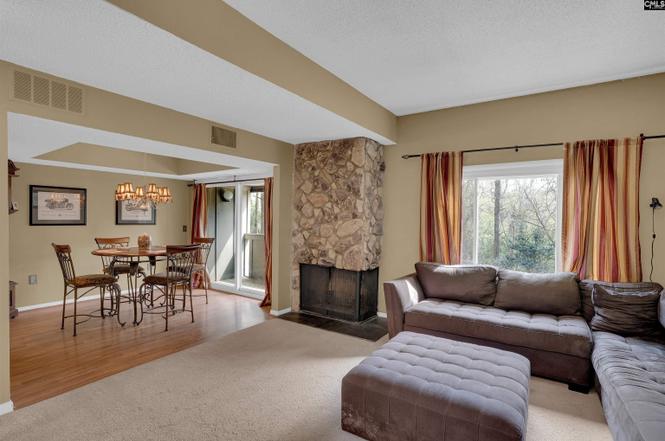
Listing remarks
BACK ON THE MARKET-BUYER FINANCING Enjoy the convenience of living close to everything Columbia has available while still feeling tucked away from the bustle of city life. Nestled in a peaceful community surrounded by nature, this 3bd/2ba condo has the perfect balance of accessibility and tranquility. Step inside and begin the process of coming home. The entry foyer provides the perfect drop zone for coats, bags, and shoes before heading upstairs to the heart of the home. The second floor is designed for comfortable everyday living. Here you'll find the living room, dining area, kitchen, plus a bedroom and full bath ideal for guests, a home office, or flex living space. The kitchen has two
Key facts
- Covered front porch
- Entry foyer
- Ample closet space
Tags
Property features AI
Finance
- HOA & community: Has association; Community pool; Sidewalks in community
Exterior
- Parking: Attached garage (1 car); Total 2 parking spaces
- Utilities: Public water; Public sewer
- Home design: Three-story property
- Construction: Slab foundation
- Exterior features: Covered front porch; Wood exterior finish; Private maintenance road
Interior
- Kitchen: Galley kitchen with pantry; Formica countertops; Tile floor; Painted cabinets; Microwave (above stove); Dishwasher; Disposal; Refrigerator; Free-standing range
- Bedrooms: Primary bedroom on third floor with double vanity, sitting room, vaulted ceilings, tub/shower, shared bath, ceiling fan, private closet, carpeted floors; Bedroom 2 on third floor with double vanity, shared bath, tub/shower, private closet, laminate floors; Bedroom 3 on second floor with shared bath, tub/shower, private closet, laminate floors
- Flooring: Carpet in living areas and formal dining; Laminate in secondary bedrooms; Tile in kitchen
- Bathrooms: Two full bathrooms; One additional full bathroom
- Heating & cooling: Central air conditioning; Electric heating
- Interior features: Finished lower level; Wood burning fireplace; Free-standing range; Electric water heater
- Laundry & utility: Heated laundry space on second floor; Washer and dryer included
Neighborhood map
What this means for you Summary
Snapshot
- This is a 3-bed/2.0-bath condo listed at $117k.
Deal economics
- At list price, monthly cash flow is $324 ($4k/yr) — positive.
- The deal already cash-flows at list — no discount required.
- Meets the 1% rule at list price ($2k rent vs $117k).
- Recommended offer: $106k (9.0% below list) — sets the bar for market timing.
- Cap rate 9.6% vs local median 5.0% in Columbia — top-decile yield for the area; either an underpriced asset or a hidden risk that comps aren't pricing in. Stress-test before assuming the spread holds.
Location & tenants
- Location reads 78/100 on livability (#18 in SC, #2,436 nationally) — a middle-class / working-renter tenant base. Strengths: amenities A+, commute A+, cost of living A+; Watch: employment D, crime F.
- Richland 01 (urban): math 26% / reading 36% proficiency, ranked #54 of 80 in SC (top 68%) — families likely to look elsewhere, expect single-tenant / working-renter base with shorter leases; 64% free/reduced lunch — lower-income household profile, screen leases tightly.
- Zoned schools: H. B. Rhame Elementary (math 15% / reading 20%, grade F, #512 of 597 statewide, top 86%, 446 students, 100% FRL); Columbia High (math 17% / reading 67%, grade F, #174 of 196 statewide, top 90%, 665 students, 100% FRL) — zoned schools average 100% FRL vs 64% district-wide (36 pts higher); higher-poverty schools than district average — tighter screening recommended.
- Market conditions: Rents rising fast (+5.0%/yr); 146 active listings in the ZIP; 22 comparable units currently listed for rent nearby; rentals at typical pace (median 25d on market — plan ~3-4 weeks tenant-placement turnaround); 3,472 units permitted in Richland County in 2024 (1,096 in 5+ unit buildings).
Forward outlook
- Local home prices are declining (-3.0%/yr); year-one equity from $808 of loan paydown is wiped out by about $4k of value loss. Plan a longer hold.
- Richland County population projected at +30% by 2050 — long-run rental-demand tailwind backs the buy-and-hold thesis.
- At projected returns (-3.0% appreciation + 5.0% rent growth), your $33k cash investment doubles in ~8 years — after that, you're playing with house money.
Negotiation context
- It's been on market 95 days — a 9% lower offer ($106k) is reasonable based on typical stale-listing flexibility.
- 2 sale attempts with the ask held roughly flat each time — persistent listings suggest the price (not the market) is what's stuck; bring a comps-based counter.
- Current owner paid $84k; 40% above their basis — modest negotiation headroom, anchor on the comps not their cost.
Risks & watch-outs
- Watch-outs: HOA is 20% of rent.
- Climate carrying-cost: major wind risk, 68% chance of damaging wind over 30y; extreme-heat days projected 7→16/yr by 2055 (HVAC capex compounding) — expect insurance premiums to compound above CPI over the hold.
Questions for the listing agent
- It's been on market 95 days. Have you received any prior offers? Is the seller open to a 9% concession, seller financing, or rate buy-down credit?
- Built in 1975 — when were the roof, HVAC, electrical panel, plumbing, and water heater last replaced?
- What does the HOA fee cover, when was the last increase, and are there any pending special assessments or reserve-fund shortfalls?
- Any open or pending special assessments — roof, HVAC, plumbing, elevator, façade? What's the per-unit balance and payoff schedule, and is the seller paying it off at close or rolling it to the buyer?
- Why hasn't it sold? Are there any deal-killer items the seller is aware of (foundation, flood, title, zoning, code violations)?
- Is there a deadline driving the sale (1031 exchange, divorce, estate, relocation)? That informs how much negotiation room exists.
- Schools are D-rated, which usually means shorter tenancies and higher turnover. Who's the typical renter profile here, and what's been the actual vacancy rate?
- Crime grade is F in this area — have there been break-ins, vandalism, or insurance claims at this property in the last 3 years? What carrier currently insures it and at what premium?
- What's the average days-on-market for RENTAL listings here right now (not sales)? A rising rental-DOM trend means longer vacancies and softer asking-rent achievability than the comps imply.
- What's the recent tenant-quality profile in this submarket — average credit score on applications, eviction rate, late-payment / NSF rate, and stable-employment percentage? A property-management company in the area should have these aggregated.
- How much new apartment / multifamily construction is in the pipeline within 1–3 miles? Heavy new supply (>2% of stock underway) typically softens rents 12–24 months out; light construction supports rent growth.
Investment metrics
- 1% rule
- 1.47% ✓
- Cap rate
- 9.62%
- Cash-on-cash
- 11.89%
- DSCR
- 1.53
- GRM
- 5.7
CMA / ARV
No comps found within radius.
Projected returns pro-forma
-3.0% appreciation · 5.0% rent growth · sell at horizon
- IRR
- 4.2%
- Equity multiple
- 1.17×
- Total profit
- $5,402
- Equity at exit
- $17,430
- IRR
- 15.8%
- Equity multiple
- 2.44×
- Total profit
- $47,050
- Equity at exit
- $10,107
Cash invested: $32,732 (down + closing). Projections, not guarantees.
Landlord ↔ Tenant lean methodology
- Overall (STATE)
- 90 Strongly Landlord-Friendly
- State South Carolina
- 90 Strongly Landlord-Friendly · R+6
- County
- — inherits STATE
- City
- — inherits STATE
ZIP-level market 29210
- Home prices YoY
- -32.2%
- Rents YoY
- 5.0%
- Active inventory
- 146
- Price-to-rent
- 5.7×
Monthly cashflow live
- Estimated rent
- $1,719 high interval (Pro) →
- Mortgage (P&I)
- −$613
- Tax from tax record
- −$28 /mo · $339/yr
- Insurance
- −$49
- HOA
- −$344
- Vacancy / Maint / Mgmt
- −$361
- Net cashflow
- $324
Break-even live
Sensitivity live
| Price | -10% $390 | -5% $357 | +0% $324 | +5% $291 | +10% $258 |
|---|---|---|---|---|---|
| Rent | -10% $188 | -5% $256 | +0% $324 | +5% $392 | +10% $460 |
| Rate | -1.0pp $383 | -0.5pp $354 | base $324 | +0.5pp $294 | +1.0pp $263 |
UW: 25.0% down · 7.5% · 30yr · 1.5% tax · 5.0% vac · 8.0% maint · 8.0% mgmt
Financing live
Cash to close
- Down payment
- $29,225
- Closing costs
- $3,507
- Reserves months
- —
- Total cash needed
- —
Loan-product check · same deal, 3 products live
Conventional
25% down · 7.5% · 30yr
- Down + closing
- —
- Monthly P&I
- —
- Monthly cashflow
- —
- DSCR
- —
- Eligible?
- —
Personal DTI + credit; lowest rate.
DSCR
20% down · 8.5% · 30yr
- Down + closing
- —
- Monthly P&I
- —
- Monthly cashflow
- —
- DSCR
- —
- Eligible?
- —
No personal income docs; deal must DSCR.
Hard money
10% down · 12.0% · 12mo
- Down + closing
- —
- Monthly P&I
- —
- Monthly cashflow
- —
- DSCR
- —
- Eligible?
- —
Short-term bridge; refi at stabilization.
Rent comps 22 comps
| Address | Beds | Baths | Sqft | Rent | $/sqft | DOM | Units | Dist |
|---|---|---|---|---|---|---|---|---|
| 1000 Watermark Pl Columbia, SC | 1.0–2.0 | 1.0–2.0 | 944 | $1,100 | $1.17 | 12d | 14 | 0.11mi |
| 215 Northwood St Columbia, SC | 3.0 | 2.5 | 1288 | $1,849 | $1.44 | 25d | 1 | 0.36mi |
| 168 Canal Place Cir Columbia, SC | 3.0 | 2.5 | 1437 | $2,250 | $1.57 | 25d | 1 | 0.39mi |
| 328 Northwood St Columbia, SC | 3.0 | 2.5 | 1461 | $2,395 | $1.64 | 25d | 1 | 0.51mi |
| 167 Stoneridge Dr Columbia, SC | 1.0–2.0 | 1.0–2.0 | 900 | $1,071 | $1.19 | 12d | 27 | 0.61mi |
| 98 Riverview Ct Columbia, SC | 3.0 | 2.0 | 1257 | $1,800 | $1.43 | 15d | 1 | 0.66mi |
| 1100 Skyland Dr Unit R1 Columbia, SC | 2.0 | 2.0 | 1100 | $1,300 | $1.18 | 25d | 1 | 0.78mi |
| 100 Riverbend Dr West Columbia, SC | 1.0–3.0 | 1.0–2.0 | 821 | $1,445 | $1.76 | 25d | 1 | 0.88mi |
| 116 Ashley Ct West Columbia, SC | 3.0 | 2.5 | 1540 | $1,995 | $1.30 | 25d | 1 | 0.91mi |
| 900 Vista Towers Dr Columbia, SC | 1.0–3.0 | 1.0–2.0 | 1044 | $1,725 | $1.65 | 12d | 20 | 0.92mi |
| 2901 Park St Columbia, SC | 3.0 | 2.0 | 1288 | $2,750 | $2.14 | 25d | 1 | 0.98mi |
| 1007 Edgefield St Columbia, SC | 4.0 | 2.5 | 2034 | $3,000 | $1.47 | 25d | 1 | 1.01mi |
| 100 Bryton Trce Columbia, SC | 2.0 | 1.0–2.0 | 950 | $1,215 | $1.28 | 22d | 4 | 1.07mi |
| 3900 Bentley Dr Columbia, SC | 1.0–2.0 | 1.0–2.0 | 873 | $1,330 | $1.52 | 12d | 40 | 1.08mi |
| 200 Saluda River Rd Columbia, SC | 1.0–2.0 | 1.0–1.5 | 900 | $1,120 | $1.24 | 12d | 8 | 1.25mi |
| 2617 River Dr Columbia, SC | 2.0–3.0 | 1.0–2.0 | 1038 | $993 | $0.96 | 15d | 2 | 1.29mi |
| 3638 Falling Springs Rd Columbia, SC | 3.0 | 2.0 | 1080 | $1,332 | $1.23 | 25d | 1 | 1.33mi |
| 1850 Atlantic Dr #524 Columbia, SC | 2.0 | 2.0 | 1630 | $2,400 | $1.47 | 15d | 1 | 1.33mi |
| 127 State St West Columbia, SC | 1.0–2.0 | 1.0–2.0 | 975 | $2,390 | $2.45 | 4d | 9 | 1.42mi |
| 302 Koon St Unit C West Columbia, SC | 2.0 | 1.5 | 1150 | $1,200 | $1.04 | 4d | 1 | 1.46mi |
| 609 Center St West Columbia, SC | 4.0 | 2.0 | 1600 | $2,800 | $1.75 | 25d | 1 | 1.46mi |
| 611 Lady St Unit b Columbia, SC | 3.0 | 2.5 | 1600 | $2,200 | $1.38 | 25d | 1 | 1.48mi |
HOA detail condo
- Monthly dues
- $344 · $4,128/yr
- Assessments
- None detected in remarks — confirm with the listing agent.
Listing history 20 events
-
2026-06-16statusdays on market $116,900 Pending 95 DOM
-
2026-06-15days on market $116,900 Active - Contingent 94 DOM
-
2026-06-14days on market $116,900 Active - Contingent 92 DOM
-
2026-06-10days on market $116,900 Active - Contingent 89 DOM
-
2026-06-09days on market $116,900 Active - Contingent 88 DOM
-
2026-06-08days on market $116,900 Active - Contingent 87 DOM
-
2026-06-07days on market $116,900 Active - Contingent 86 DOM
-
2026-06-03days on market $116,900 Active - Contingent 82 DOM
-
2026-06-03days on market $116,900 Active - Contingent 81 DOM
-
2026-06-02status $116,900 Active - Contingent 80 DOM
-
2026-06-01days on market $116,900 Active 80 DOM
-
2026-05-31days on market $116,900 Active 79 DOM
-
2026-04-16status Active
-
2026-04-06historical Active - Contingent
-
2026-03-13$116,900 Active
-
2004-07-21soldstatus $83,500
-
2003-09-22soldstatus $58,100
-
1996-02-26soldstatus $57,000
-
1986-03-01soldstatus $62,000
-
1980-05-01soldstatus $54,500
ⓘ Source: listings_history table (triggers on properties + properties_extension) + one-shot
backfill from property_details.listing_events for pre-trigger history.
Tax reassessment forecast SC · Resets to sale price
- Current annual tax
- $339 · $28/mo
- Projected year-2 tax
- $666 · $56/mo
- Expected delta
- +$327/yr (+$27/mo · 96.6%)
ⓘ Screening estimate from a state-policy table — verify with the county assessor before closing.
Climate risk First Street
- Flood 1/10 Low FEMA zone X (unshaded) · 0% chance over 30 yrs
- Wildfire 2/10 Low
- Heat 6/10 Major 7 d/yr ≥109°F today · 16 d/yr by 30 yrs out
- Wind 6/10 Major 68% chance of damaging wind over 30 yrs
- Air quality 3/10 Moderate 2 unhealthy d/yr today · 2 by 30 yrs out
Nearby sold comps map
Loading sold comps map…
Walkable amenities ~0.75 mi
Loading nearby amenities…
Taxation est. · year 1
- Rental income
- $20,631
- − Mortgage interest
- −$6,548
- − Property taxes
- −$339
- − Insurance
- −$584
- − Repairs & maintenance
- −$1,651
- − Management
- −$1,651
- − HOA
- −$4,128
- − Depreciation
- −$3,401
- Taxable income
- $2,330
- Est. tax owed @ 24.0%
- −$559
- After-tax cash flow
- $3,332/yr
For passive investors: Depreciation is non-cash, so a rental often shows a tax loss while cash-flowing — sheltering income. Rental losses are passive: they offset passive income freely, and up to $25,000/yr can offset ordinary (W-2) income if you actively participate and your MAGI is under $100k (phasing out to $0 by $150k); unused losses carry forward. On sale, claimed depreciation is recaptured at up to 25%, and gains may owe capital-gains tax (a 1031 exchange can defer both). Figures are a year-1 estimate at your 24.0% rate — not tax advice; consult a CPA.
Schools (NCES district)
- District
- Richland 01
- NCES district ID
- 4503360
- Math proficiency
- 26% ▼ -7.00%
- Reading proficiency
- 36% ▼ -5.00%
- Median HH income
- $38,931
- Composite
- 25.94/100
- National rank
- #7335
- State rank
- #54 of 80 in SC
Livability — Columbia
- Score
- 78/100
- State rank
- #18
- US rank
- #2436
Category grades
Schools grade is shown separately in the Schools card above.
Census & demographics
- Census place
- Columbia, SC
- County
- Richland County · 389,530 people
- City population
- 335,994
- Metro
- Columbia, SC
- Population (ZIP)
- 39,962
- Household income
- $50,871
- Rent vs Own
- Severe rent burden
- 2859.0
Population outlook (Richland County) Hauer SSP2
- Today (2025)
- 459,667 people
- By 2030
- 487,524 · +6.1%
- By 2040
- 542,035 · +17.9%
- By 2050
- 595,371 · +29.5%
- By 2075
- 732,998 · +59.5%
- By 2100
- 820,415 · +78.5%
Race, ethnicity, and origin ACS 2023
- Neighborhood character
- Diverse neighborhood (Simpson 0.58)
- Race & ethnicity
- Black 55% White 34% Two or more races 6% Hispanic / Latino 4% Asian 2%
- Common ancestry
- Arab 2% Lithuanian 2% Slovak 1%
- Foreign-born
- 7% · Canada
- Languages at home
- 91% English-only · Spanish 3%
Political lean MEDSL · Richland
- 2024 margin
- Solid D (+34.6) · D 66.4% · R 31.8% · Other 1.8%
- 2008→2024 swing
- +5.7pp toward D · 2008: 28.9pp · 2024: 34.6pp
- All cycles
- 2024: D+34.6 2020: D+38.3 2016: D+32.9 2012: D+33.3 2008: D+28.9
Not yet ingested
- Civics
- —
Market trends
- HPI YoY
- ▼ -107.61%
- Current HPI
- 226.2564
- Rent YoY
- ▲ 5.00%
- Metro
- Columbia, SC
- State GDP YoY
- ▲ 4.51%
- F500 in state
- 2
Industry mix (Fortune 500 HQ in SC)
| Industry | F500 HQs | Revenue |
|---|---|---|
| Packaging | 1 | $7B |
|
||
Price history
+114.5% since first listed8 events — show timeline
- 2026-04-16 Relisted — Consolidated MLS
- 2026-04-06 Contingent — Consolidated MLS
- 2026-03-13 Listed $116,900 Consolidated MLS
- 2004-07-21 Sold (Public Records) $83,500 Public Records
- 2003-09-22 Sold (Public Records) $58,100 Public Records
- 1996-02-26 Sold (Public Records) $57,000 Public Records
- 1986-03-01 Sold (Public Records) $62,000 Public Records
- 1980-05-01 Sold (Public Records) $54,500 Public Records
Property tax history
-4.0%/yrLatest (2025): $339 · +3.7% YoY. Source: county tax records.
Cash-flow waterfall
monthlySold comps — $/sqft
last 12 mo · ≤1 miLoading sold comps…