 🏗️ New Construction
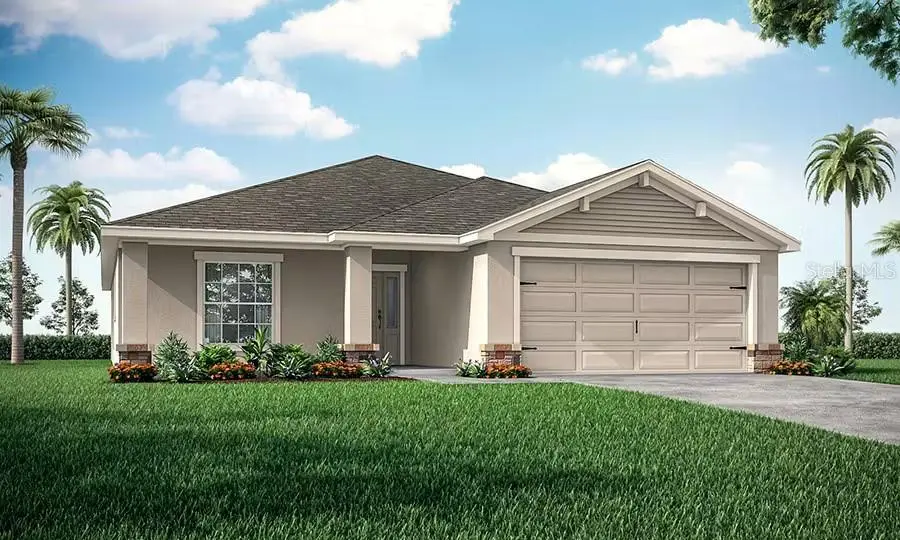
597 Cypress Creek Run · St. Cloud, FL
Flood risk 1/10 · Minimal
- FEMA flood zone
- X (unshaded)
- Chance of flooding over 30 yrs
- 0.0%
- Est. flood insurance / yr
- $507 – $1,088
Fire risk 6/10 · Moderate
- Est. fire insurance / yr
- $947 – $1,759
Heat risk 9/10 · Severe
- Hot days now (above 108°F)
- 7 days/yr
- Hot days in 30 yrs
- 23 days/yr
Wind risk 9/10 · Severe
- Chance of severe wind over 30 yrs
- 99.0%
Air-quality risk 2/10 · Minimal
- Unhealthy air days now
- 1 days/yr
- Unhealthy air days in 30 yrs
- 1 days/yr
Risk factors via First Street. Map © Google.
Why this score? — see what drove the F grade
The composite is a weighted blend of 9 inputs, each scored 0–100. Each bar is that input's sub-score; the figure is the points it added to the 100-point composite (weight × sub-score).
- ARV discount +7.5/15.0
- Cash flow +6.5/30.0
- Schools +3.6/10.0
- Rent growth +3.3/5.0
- Livability +2.5/5.0
- Condition / age +2.5/5.0
- 1% rule +1.3/10.0
- DSCR +0.8/10.0
- Appreciation +0.0/10.0
$424,325
🖨 Deal sheet 📄 Offer letter ✓ Due diligence
Listing remarks
Under Construction. New construction home with 1819 square feet on one-story including 4 bedrooms, 2 baths, and an open living area. Enjoy an open kitchen with Quartz countertops, Samsung stainless steel appliances, a walk-in pantry, and a spacious counter height island, fully open to the dining café and gathering room. The living area, laundry room, and baths include luxury wood vinyl plank flooring, with stain-resistant carpet in the bedrooms. Your owner's suite is complete with a walk-in wardrobe and a private en-suite bath with dual vanities, a tiled shower, and a closeted toilet. Plus, enjoy a covered lanai, 2-car garage, custom-fit window blinds, architectural shingles, energy-
Key facts
- 5,663 sq ft lot
- 2 garage spots
- Built 2026
Property features AI
Finance
- Other: CDD applies
- HOA & community: HOA managed by Hcmanagement; annual association fee $115 (monthly equivalent $9.58); association fees required; Community has deed restrictions; Pets allowed
Exterior
- Parking: Attached 2-car garage (19 x 20)
- Utilities: Public water; Public sewer; Cable available
- Home design: Single-family residence; One-story home; Faces west; Under construction (projected completion: 2026-05-27)
- Construction: Block construction; Shingle roof; Slab foundation; New construction by Highland Homes (Model: RAYCHEL)
- Exterior features: Paved road access; Irrigation system
Interior
- Kitchen: Fully equipped kitchen with range, microwave, dishwasher, refrigerator, and disposal
- Bedrooms: 4 bedrooms
- Flooring: Carpet; Vinyl
- Bathrooms: 2 full bathrooms
- Heating & cooling: Central heating; Central air conditioning
- Interior features: In-wall pest control system; Dishwasher; Disposal; Electric water heater; Microwave; Range; Refrigerator
- Laundry & utility: Laundry room inside the home
Neighborhood map
What this means for you Summary
Snapshot
- This is a 4-bed/2.0-bath land listed at $424k.
Deal economics
- At list price, monthly cash flow is $-722 ($-9k/yr) — negative.
- To cash-flow at today's rent, offer at most $297k (30.0% below list).
- To meet the 1% rule (rent ≥ 1% of price), the offer needs to be $268k (36.8% below list).
- Recommended offer: $268k (36.8% below list) — sets the bar for 1% rule.
Location & tenants
- Location reads: area grade F — affects rentability + tenant quality, not the cash-flow math above.
- Osceola (suburban): math 39% / reading 45% proficiency, ranked #60 of 73 in FL (top 82%) — families likely to look elsewhere, expect single-tenant / working-renter base with shorter leases; 60% free/reduced lunch — lower-income household profile, screen leases tightly.
- Market conditions: Rents rising (+3.0%/yr); 1378 active listings in the ZIP; 30 comparable units currently listed for rent nearby; rentals at typical pace (median 18d on market — plan ~3-4 weeks tenant-placement turnaround); solid renter incomes; 8,813 units permitted in Osceola County in 2024 (3,072 in 5+ unit buildings).
- This rent runs 33% of the median local income ($97k/yr) — at the standard rent-burdened threshold; future hikes will face affordability resistance.
Forward outlook
- Local home prices are declining (-3.0%/yr); year-one equity from $3k of loan paydown is wiped out by about $13k of value loss. Plan a longer hold.
- Osceola County population projected at +73% by 2050 — long-run rental-demand tailwind backs the buy-and-hold thesis.
Negotiation context
- Only 1 days on market — expect competitive offers; lowballing is unlikely to land.
Risks & watch-outs
- Climate carrying-cost: severe wind risk, 99% chance of damaging wind over 30y; major wildfire risk; extreme-heat days projected 7→23/yr by 2055 (HVAC capex compounding) — expect insurance premiums to compound above CPI over the hold.
Questions for the listing agent
- What do current leases actually rent for vs. the listed asking? Can we see a recent rent roll and the last 12 months of T-12 income?
- What does the HOA fee cover, when was the last increase, and are there any pending special assessments or reserve-fund shortfalls?
- Is there a deadline driving the sale (1031 exchange, divorce, estate, relocation)? That informs how much negotiation room exists.
- The area grade is low — what's the realistic commute time and amenity access for the typical tenant pool here? Any planned neighborhood developments (good or bad) we should know about?
- What's the average days-on-market for RENTAL listings here right now (not sales)? A rising rental-DOM trend means longer vacancies and softer asking-rent achievability than the comps imply.
- What's the recent tenant-quality profile in this submarket — average credit score on applications, eviction rate, late-payment / NSF rate, and stable-employment percentage? A property-management company in the area should have these aggregated.
- How much new for-sale + rental construction is in the pipeline within 1–3 miles? Heavy new supply typically softens prices + rents 12–24 months out; constrained supply supports both.
Investment metrics
- 1% rule
- 0.63% ✗
- Cap rate
- 4.25%
- Cash-on-cash
- -7.29%
- DSCR
- 0.68
- GRM
- 13.2
CMA / ARV
No comps found within radius.
Projected returns pro-forma
-3.0% appreciation · 3.02% rent growth · sell at horizon
- IRR
- -29.0%
- Equity multiple
- 0.03×
- Total profit
- $-114,674
- Equity at exit
- $63,268
- IRR
- -28.9%
- Equity multiple
- -0.34×
- Total profit
- $-158,873
- Equity at exit
- $36,688
Cash invested: $118,811 (down + closing). Projections, not guarantees.
Landlord ↔ Tenant lean methodology
- Overall (STATE)
- 87 Strongly Landlord-Friendly
- State Florida
- 87 Strongly Landlord-Friendly · R+3
- County
- — inherits STATE
- City
- — inherits STATE
ZIP-level market 34771
- Home prices YoY
- -30.0%
- Rents YoY
- 3.0%
- Active inventory
- 1378
- Price-to-rent
- 13.2×
Monthly cashflow live
- Estimated rent
- $2,682 high interval (Pro) →
- Mortgage (P&I)
- −$2,225
- Tax from tax record
- −$429 /mo · $5,148/yr
- Insurance
- −$177
- HOA
- −$9
- Vacancy / Maint / Mgmt
- −$563
- Net cashflow
- $-722
Break-even live
UW: 25.0% down · 7.5% · 30yr · 1.5% tax · 5.0% vac · 8.0% maint · 8.0% mgmt
Financing live
Cash to close
- Down payment
- $106,081
- Closing costs
- $12,730
- Reserves months
- —
- Total cash needed
- —
Loan-product check · same deal, 3 products live
Conventional
25% down · 7.5% · 30yr
- Down + closing
- —
- Monthly P&I
- —
- Monthly cashflow
- —
- DSCR
- —
- Eligible?
- —
Personal DTI + credit; lowest rate.
DSCR
20% down · 8.5% · 30yr
- Down + closing
- —
- Monthly P&I
- —
- Monthly cashflow
- —
- DSCR
- —
- Eligible?
- —
No personal income docs; deal must DSCR.
Hard money
10% down · 12.0% · 12mo
- Down + closing
- —
- Monthly P&I
- —
- Monthly cashflow
- —
- DSCR
- —
- Eligible?
- —
Short-term bridge; refi at stabilization.
Rent comps 30 comps
| Address | Beds | Baths | Sqft | Rent | $/sqft | DOM | Units | Dist |
|---|---|---|---|---|---|---|---|---|
| 358 Cadberry Pl Saint Cloud, FL | 3.0 | 2.5 | 1594 | $2,200 | $1.38 | 14d | 1 | 0.37mi |
| 551 Windy Willow Way Saint Cloud, FL | 3.0 | 2.5 | 2100 | $2,550 | $1.21 | 23d | 1 | 0.40mi |
| 5788 Freshwater Canyon Dr Saint Cloud, FL | 3.0 | 2.5 | 1705 | $2,250 | $1.32 | 14d | 1 | 0.56mi |
| 5846 Herder Rd Saint Cloud, FL | 4.0 | 2.0 | 1890 | $2,650 | $1.40 | 23d | 1 | 0.59mi |
| 5824 Bullock Pl Saint Cloud, FL | 3.0 | 2.0 | 1663 | $2,149 | $1.29 | 4d | 1 | 0.59mi |
| 5752 Anders Way Saint Cloud, FL | 3.0 | 2.5 | 1700 | $2,500 | $1.47 | 23d | 1 | 0.62mi |
| 5837 Beefmaster Rd Saint Cloud, FL | 3.0 | 2.0 | 1663 | $2,075 | $1.25 | 23d | 1 | 0.63mi |
| 5778 Waterman Path Saint Cloud, FL | 3.0 | 2.5 | 1946 | $2,295 | $1.18 | 23d | 1 | 0.64mi |
| 419 Conway Ave Saint Cloud, FL | 4.0 | 2.0 | 1910 | $2,750 | $1.44 | 7d | 1 | 0.66mi |
| 764 Preston Cove Dr Unit 1 St Cloud, FL | 3.0 | 2.5 | 1463 | $2,100 | $1.44 | 23d | 1 | 0.74mi |
| 588 Preston Cove Dr Saint Cloud, FL | 3.0 | 2.5 | 1553 | $2,250 | $1.45 | 2d | 1 | 0.76mi |
| 564 Preston Cove Dr Saint Cloud, FL | 3.0 | 2.5 | 1551 | $2,080 | $1.34 | 23d | 1 | 0.78mi |
| 1166 Silo Dr Saint Cloud, FL | 3.0 | 3.0 | 1856 | $2,499 | $1.35 | 16d | 1 | 0.80mi |
| 416 Preston Cove Dr Saint Cloud, FL | 3.0 | 2.5 | 2614 | $2,150 | $0.82 | 17d | 1 | 0.92mi |
| 5762 Cattle Ranch Dr Saint Cloud, FL | 3.0 | 2.0 | 2066 | $2,400 | $1.16 | 23d | 1 | 0.98mi |
| 5762 Cattle Ranch Dr Saint Cloud, FL | 3.0 | 2.0 | 2066 | $2,400 | $1.16 | 7d | 1 | 0.98mi |
| 5777 Haystack Dr Saint Cloud, FL | 3.0 | 2.5 | 2226 | $2,400 | $1.08 | 23d | 1 | 0.98mi |
| 1217 Grassland Ave Saint Cloud, FL | 4.0 | 3.0 | 2185 | $2,900 | $1.33 | 23d | 1 | 0.98mi |
| 1479 Silver Maple Dr Saint Cloud, FL | 3.0 | 2.5 | 1654 | $2,312 | $1.40 | 1d | 6 | 0.98mi |
| 5741 Haystack Dr Saint Cloud, FL | 4.0 | 2.0 | 1932 | $2,450 | $1.27 | 2d | 1 | 1.03mi |
| 399 Tanis Ave Saint Cloud, FL | 4.0 | 2.0 | 1846 | $2,375 | $1.29 | 23d | 1 | 1.10mi |
| 600 Talisi Loop Saint Cloud, FL | 3.0 | 2.0 | 1676 | $2,450 | $1.46 | 4d | 1 | 1.14mi |
| 5580 Vigo Loop Saint Cloud, FL | 4.0 | 2.0 | 2021 | $2,849 | $1.41 | 14d | 1 | 1.17mi |
| 5566 Sabal Dr Saint Cloud, FL | 4.0 | 3.0 | 2105 | $2,700 | $1.28 | 14d | 1 | 1.24mi |
| 5566 Sabal Dr Saint Cloud, FL | 4.0 | 3.0 | 2126 | $2,699 | $1.27 | 7d | 1 | 1.24mi |
| 18 Polermo Ave Saint Cloud, FL | 3.0 | 2.5 | 1982 | $2,400 | $1.21 | 21d | 1 | 1.27mi |
| 234 Polermo Ave Saint Cloud, FL | 4.0 | 2.0 | 1825 | $2,490 | $1.36 | 23d | 1 | 1.27mi |
| 504 Enaya St Saint Cloud, FL | 4.0 | 2.0 | 1825 | $3,100 | $1.70 | 23d | 1 | 1.29mi |
| 5686 Stockade Blvd Saint Cloud, FL | 3.0 | 2.5 | 1496 | $2,150 | $1.44 | 7d | 1 | 1.30mi |
| 94 Polermo Ave Saint Cloud, FL | 3.0 | 2.0 | 1990 | $2,450 | $1.23 | 7d | 1 | 1.36mi |
HOA detail
- Monthly dues
- $9 · $108/yr
Listing history 2 events
-
2026-05-08status Pending
-
2026-05-08$424,325 Active
ⓘ Source: listings_history table (triggers on properties + properties_extension) + one-shot
backfill from property_details.listing_events for pre-trigger history.
Tax reassessment forecast FL · Resets to sale price
- Current annual tax
- $5,148 · $429/mo
- Projected year-2 tax
- $5,148 · $429/mo
- Expected delta
- $0/yr ($0/mo · 0.0%)
ⓘ Screening estimate from a state-policy table — verify with the county assessor before closing.
Climate risk First Street
- Flood 1/10 Low FEMA zone X (unshaded) · 0% chance over 30 yrs
- Wildfire 6/10 Major
- Heat 9/10 Extreme 7 d/yr ≥108°F today · 23 d/yr by 30 yrs out
- Wind 9/10 Extreme 99% chance of damaging wind over 30 yrs
- Air quality 2/10 Low 1 unhealthy d/yr today · 1 by 30 yrs out
Nearby sold comps map
Loading sold comps map…
Walkable amenities ~0.75 mi
Loading nearby amenities…
Taxation est. · year 1
- Rental income
- $32,180
- − Mortgage interest
- −$23,769
- − Property taxes
- −$5,148
- − Insurance
- −$2,122
- − Repairs & maintenance
- −$2,574
- − Management
- −$2,574
- − HOA
- −$108
- − Depreciation
- −$12,344
- Taxable loss
- −$16,459
- Est. tax savings @ 24.0%
- +$3,950
- After-tax cash flow
- $-4,708/yr
For passive investors: Depreciation is non-cash, so a rental often shows a tax loss while cash-flowing — sheltering income. Rental losses are passive: they offset passive income freely, and up to $25,000/yr can offset ordinary (W-2) income if you actively participate and your MAGI is under $100k (phasing out to $0 by $150k); unused losses carry forward. On sale, claimed depreciation is recaptured at up to 25%, and gains may owe capital-gains tax (a 1031 exchange can defer both). Figures are a year-1 estimate at your 24.0% rate — not tax advice; consult a CPA.
Schools (NCES district)
- District
- Osceola
- NCES district ID
- 1201470
- Math proficiency
- 39% ▼ -9.00%
- Reading proficiency
- 45% ▼ -4.00%
- Median HH income
- $45,528
- Composite
- 35.7/100
- National rank
- #4865
- State rank
- #60 of 73 in FL
Livability — St. Cloud
No livability data for this city. (Only ~50 U.S. cities are tracked.)
Census & demographics
- County
- Osceola County · 410,217 people
- City population
- 29,247
- Metro
- Orlando-Kissimmee-Sanford, FL
- Population (ZIP)
- 35,257
- Household income
- $97,415
- Rent vs Own
- Severe rent burden
- 338.0
Population outlook (Osceola County) Hauer SSP2
- Today (2025)
- 447,624 people
- By 2030
- 511,823 · +14.3%
- By 2040
- 642,986 · +43.6%
- By 2050
- 774,552 · +73.0%
- By 2075
- 1,078,144 · +140.9%
- By 2100
- 1,269,660 · +183.6%
Race, ethnicity, and origin ACS 2023
- Neighborhood character
- Diverse neighborhood (Simpson 0.62)
- Race & ethnicity
- White 45% Hispanic / Latino 41% Two or more races 20% Black 9% Asian 2%
- Hispanic origin (detail)
- Mexican 3% Puerto Rican 26% Cuban 2% Dominican 4%
- Common ancestry
- Slovak 2% Romanian 2% Lithuanian 1%
- Foreign-born
- 14% · Canada, Jamaica
- Languages at home
- 64% English-only · Spanish 33% Other Indo-European 3%
Political lean MEDSL · Osceola
- 2024 margin
- Toss-up / Even · D 48.7% · R 50.2% · Other 1.1%
- 2008→2024 swing
- -21.2pp toward R · 2008: 19.7pp · 2024: -1.4pp
- All cycles
- 2024: R+1.4 2020: D+13.8 2016: D+25.0 2012: D+24.5 2008: D+19.7
Not yet ingested
- Civics
- —
Market trends
- HPI YoY
- ▼ -124.44%
- Current HPI
- 290.3095
- Rent YoY
- ▲ 3.02%
- Metro
- Orlando-Kissimmee-Sanford, FL
- State GDP YoY
- ▲ 3.28%
- F500 in state
- 36
Industry mix (Fortune 500 HQ in FL)
| Industry | F500 HQs | Revenue |
|---|---|---|
| Industrial Technology | 2 | $29B |
|
||
| Insurance | 2 | $17B |
|
||
| Retail | 1 | $60B |
|
||
| Technology Distribution | 1 | $58B |
|
||
| Homebuilding | 1 | $35B |
|
||
| Technology Manufacturing | 1 | $35B |
|
||
Price history
2 events — show timeline
- 2026-05-08 Pending — Stellar MLS as Distributed by MLS Grid
- 2026-05-08 Listed $424,325 Stellar MLS as Distributed by MLS Grid
Cash-flow waterfall
monthlySold comps — $/sqft
last 12 mo · ≤1 miLoading sold comps…