6726 E Peach Rd · Ridgeway, SC
Flood risk 1/10 · Minimal
- FEMA flood zone
- X (unshaded)
- Chance of flooding over 30 yrs
- 0.0%
- Est. flood insurance / yr
- $507 – $1,088
Fire risk 4/10 · Minor
- Est. fire insurance / yr
- $783 – $1,453
Heat risk 6/10 · Moderate
- Hot days now (above 106°F)
- 7 days/yr
- Hot days in 30 yrs
- 15 days/yr
Wind risk 6/10 · Moderate
- Chance of severe wind over 30 yrs
- 56.0%
Air-quality risk 2/10 · Minimal
- Unhealthy air days now
- 1 days/yr
- Unhealthy air days in 30 yrs
- 1 days/yr
Risk factors via First Street. Map © Google.
Why this score? — see what drove the B- grade
The composite is a weighted blend of 9 inputs, each scored 0–100. Each bar is that input's sub-score; the figure is the points it added to the 100-point composite (weight × sub-score).
- Cash flow +27.0/30.0
- DSCR +9.3/10.0
- ARV discount +7.5/15.0
- 1% rule +6.4/10.0
- Appreciation +5.0/10.0
- Livability +3.1/5.0
- Schools +2.6/10.0
- Rent growth +2.5/5.0
- Condition / age +2.5/5.0
$106,000
🖨 Deal sheet 📄 Offer letter ✓ Due diligence
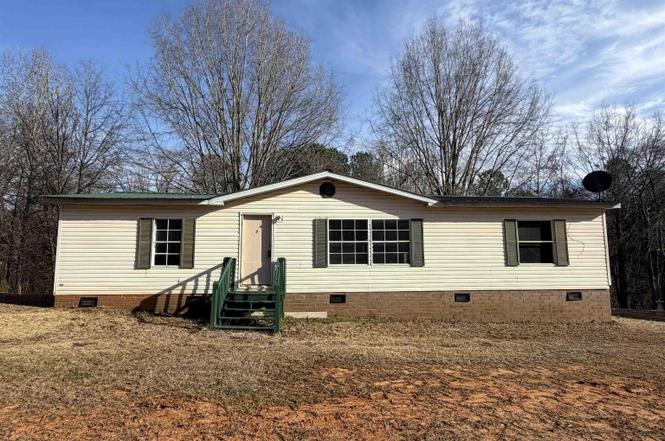
Listing remarks
Detitled mobile home with brick foundation. Updated Vinyl floor in the living room, kitchen and master bed room, the other two bed rooms have brand new carpet. Close to highway 77 and Scott Motors. Perfect for first time home buyer or investor. Come to check this out. Disclaimer: CMLS has not reviewed and, therefore, does not endorse vendors who may appear in listings.
Key facts
- Brick foundation
- New carpet
- Updated vinyl floor
Tags
Property features AI
Finance
- Other: Approximately 0.4-acre lot
Exterior
- Utilities: Public water; Public sewer
- Home design: Single-family property; Entry level on main
- Construction: Crawlspace foundation
- Exterior features: Vinyl exterior; Paved road access
Interior
- Bedrooms: Master bedroom on the main level; Bedroom 2 on the main level; Bedroom 3 on the main level
- Bathrooms: Two full bathrooms
- Heating & cooling: Central heat; Central air
- Interior features: Central heating and central cooling
Neighborhood map
What this means for you Summary
Snapshot
- This is a 3-bed/2.0-bath manufactured listed at $106k.
Deal economics
- At list price, monthly cash flow is $296 ($4k/yr) — positive.
- The deal already cash-flows at list — no discount required.
- Meets the 1% rule at list price ($1k rent vs $106k).
- Recommended offer: $96k (9.0% below list) — sets the bar for market timing.
Location & tenants
- Location reads 62/100 on livability (#199 in SC) — a middle-class / working-renter tenant base. Strengths: cost of living A+, housing B+; Watch: crime C-, employment D, amenities F.
- Fairfield 01 (rural): math 26% / reading 38% proficiency, ranked #53 of 80 in SC (top 66%) — families likely to look elsewhere, expect single-tenant / working-renter base with shorter leases; 80% free/reduced lunch — lower-income household profile, screen leases tightly.
- Zoned schools: Geiger Elementary (math 27% / reading 37%, grade F, #369 of 597 statewide, top 64%, 259 students, 100% FRL); Fairfield Central High (math 37% / reading 77%, grade C, #120 of 196 statewide, top 64%, 662 students, 100% FRL) — zoned schools average 100% FRL vs 80% district-wide (20 pts higher); higher-poverty schools than district average — tighter screening recommended.
- Zoned-school proficiency averages 44% at this address vs 32% district-wide (+12 pts) — the actual schools serving this property are materially stronger than the Fairfield 01 average implies; a family-tenant draw the district grade alone would hide.
- Market conditions: 12 active listings in the ZIP; 91 units permitted in Fairfield County in 2024 (0 in 5+ unit buildings).
Forward outlook
- In year one you build about $4k of equity ($733 loan paydown + $3k appreciation (3.0% local appreciation)).
- Fairfield County population projected at -32% by 2050 — secular population decline; favor cash flow + early exit over multi-decade hold.
- At projected returns (3.0% appreciation + 3.0% rent growth), your $30k cash investment doubles in ~4 years — after that, you're playing with house money.
- By year 9, paydown + projected appreciation supports a ~$33k cash-out refi (75% LTV) — recoverable capital for the next deal without selling this one.
Negotiation context
- It's been on market 114 days — a 9% lower offer ($96k) is reasonable based on typical stale-listing flexibility.
- 2 sale attempts with the ask held roughly flat each time — persistent listings suggest the price (not the market) is what's stuck; bring a comps-based counter.
Risks & watch-outs
- Climate carrying-cost: major wind risk, 56% chance of damaging wind over 30y; extreme-heat days projected 7→15/yr by 2055 (HVAC capex compounding) — expect insurance premiums to compound above CPI over the hold.
Questions for the listing agent
- It's been on market 114 days. Have you received any prior offers? Is the seller open to a 9% concession, seller financing, or rate buy-down credit?
- Why hasn't it sold? Are there any deal-killer items the seller is aware of (foundation, flood, title, zoning, code violations)?
- Is there a deadline driving the sale (1031 exchange, divorce, estate, relocation)? That informs how much negotiation room exists.
- Schools are D-rated, which usually means shorter tenancies and higher turnover. Who's the typical renter profile here, and what's been the actual vacancy rate?
- What's the average days-on-market for RENTAL listings here right now (not sales)? A rising rental-DOM trend means longer vacancies and softer asking-rent achievability than the comps imply.
- What's the recent tenant-quality profile in this submarket — average credit score on applications, eviction rate, late-payment / NSF rate, and stable-employment percentage? A property-management company in the area should have these aggregated.
- How much new for-sale + rental construction is in the pipeline within 1–3 miles? Heavy new supply typically softens prices + rents 12–24 months out; constrained supply supports both.
Investment metrics
- 1% rule
- 1.14% ✓
- Cap rate
- 9.65%
- Cash-on-cash
- 11.98%
- DSCR
- 1.53
- GRM
- 7.3
CMA / ARV
No comps found within radius.
Projected returns pro-forma
3.0% appreciation · 3.0% rent growth · sell at horizon
- IRR
- 18.7%
- Equity multiple
- 2.07×
- Total profit
- $31,619
- Equity at exit
- $47,662
- IRR
- 20.0%
- Equity multiple
- 3.90×
- Total profit
- $86,076
- Equity at exit
- $73,453
Cash invested: $29,680 (down + closing). Projections, not guarantees.
Landlord ↔ Tenant lean methodology
- Overall (STATE)
- 90 Strongly Landlord-Friendly
- State South Carolina
- 90 Strongly Landlord-Friendly · R+6
- County
- — inherits STATE
- City
- — inherits STATE
ZIP-level market 29130-0000
- Active inventory
- 12
- Price-to-rent
- 7.3×
Monthly cashflow live
- Estimated rent
- $1,203 medium interval (Pro) →
- Mortgage (P&I)
- −$556
- Tax from tax record
- −$54 /mo · $650/yr
- Insurance
- −$44
- HOA
- −$0
- Vacancy / Maint / Mgmt
- −$253
- Net cashflow
- $296
Break-even live
UW: 25.0% down · 7.5% · 30yr · 1.5% tax · 5.0% vac · 8.0% maint · 8.0% mgmt
Financing live
Cash to close
- Down payment
- $26,500
- Closing costs
- $3,180
- Reserves months
- —
- Total cash needed
- —
Loan-product check · same deal, 3 products live
Conventional
25% down · 7.5% · 30yr
- Down + closing
- —
- Monthly P&I
- —
- Monthly cashflow
- —
- DSCR
- —
- Eligible?
- —
Personal DTI + credit; lowest rate.
DSCR
20% down · 8.5% · 30yr
- Down + closing
- —
- Monthly P&I
- —
- Monthly cashflow
- —
- DSCR
- —
- Eligible?
- —
No personal income docs; deal must DSCR.
Hard money
10% down · 12.0% · 12mo
- Down + closing
- —
- Monthly P&I
- —
- Monthly cashflow
- —
- DSCR
- —
- Eligible?
- —
Short-term bridge; refi at stabilization.
Listing history 18 events
-
2026-06-18days on market $106,000 Active 114 DOM
-
2026-06-17days on market $106,000 Active 113 DOM
-
2026-06-16days on market $106,000 Active 112 DOM
-
2026-06-15days on market $106,000 Active 111 DOM
-
2026-06-14days on market $106,000 Active 109 DOM
-
2026-06-13days on market $106,000 Active 108 DOM
-
2026-06-10days on market $106,000 Active 106 DOM
-
2026-06-09days on market $106,000 Active 105 DOM
-
2026-06-08days on market $106,000 Active 104 DOM
-
2026-06-07days on market $106,000 Active 103 DOM
-
2026-06-03days on market $106,000 Active 99 DOM
-
2026-06-03days on market $106,000 Active 98 DOM
-
2026-06-01days on market $106,000 Active 97 DOM
-
2026-05-31days on market $106,000 Active 96 DOM
-
2026-02-24$106,000 Active
-
2026-02-15historical
-
2025-09-04price $107,000
-
2025-05-09$117,000 Active
ⓘ Source: listings_history table (triggers on properties + properties_extension) + one-shot
backfill from property_details.listing_events for pre-trigger history.
Tax reassessment forecast SC · Resets to sale price
- Current annual tax
- $650 · $54/mo
- Projected year-2 tax
- $650 · $54/mo
- Expected delta
- $0/yr ($0/mo · 0.0%)
ⓘ Screening estimate from a state-policy table — verify with the county assessor before closing.
Climate risk First Street
- Flood 1/10 Low FEMA zone X (unshaded) · 0% chance over 30 yrs
- Wildfire 4/10 Moderate
- Heat 6/10 Major 7 d/yr ≥106°F today · 15 d/yr by 30 yrs out
- Wind 6/10 Major 56% chance of damaging wind over 30 yrs
- Air quality 2/10 Low 1 unhealthy d/yr today · 1 by 30 yrs out
Nearby sold comps map
Loading sold comps map…
Walkable amenities ~0.75 mi
Loading nearby amenities…
Taxation est. · year 1
- Rental income
- $14,440
- − Mortgage interest
- −$5,938
- − Property taxes
- −$650
- − Insurance
- −$530
- − Repairs & maintenance
- −$1,155
- − Management
- −$1,155
- − Depreciation
- −$3,084
- Taxable income
- $1,928
- Est. tax owed @ 24.0%
- −$463
- After-tax cash flow
- $3,094/yr
For passive investors: Depreciation is non-cash, so a rental often shows a tax loss while cash-flowing — sheltering income. Rental losses are passive: they offset passive income freely, and up to $25,000/yr can offset ordinary (W-2) income if you actively participate and your MAGI is under $100k (phasing out to $0 by $150k); unused losses carry forward. On sale, claimed depreciation is recaptured at up to 25%, and gains may owe capital-gains tax (a 1031 exchange can defer both). Figures are a year-1 estimate at your 24.0% rate — not tax advice; consult a CPA.
Schools (NCES district)
- District
- Fairfield 01
- NCES district ID
- 4502100
- Math proficiency
- 26% ▼ -10.00%
- Reading proficiency
- 38% ▲ 4.00%
- Median HH income
- $34,836
- Composite
- 26.37/100
- National rank
- #7232
- State rank
- #53 of 80 in SC
Livability — Ridgeway
- Score
- 62/100
- State rank
- #199
- US rank
- #17274
Category grades
Schools grade is shown separately in the Schools card above.
Census & demographics
No demographic data for this ZIP.
Market trends
- HPI YoY
- —
- Current HPI
- —
- Rent YoY
- —
- Metro
- —
- State GDP YoY
- ▲ 4.51%
- F500 in state
- 2
Industry mix (Fortune 500 HQ in SC)
| Industry | F500 HQs | Revenue |
|---|---|---|
| Packaging | 1 | $7B |
|
||
Price history
-9.4% since first listed4 events — show timeline
- 2026-02-24 Listed $106,000 Consolidated MLS
- 2026-02-15 Delisted — Consolidated MLS
- 2025-09-04 Price Changed $107,000 Consolidated MLS
- 2025-05-09 Listed $117,000 Consolidated MLS
Property tax history
-1.1%/yrLatest (2022): $650 · -0.1% YoY. Source: county tax records.
Cash-flow waterfall
monthlySold comps — $/sqft
last 12 mo · ≤1 miLoading sold comps…