550 S Spring St Unit F2-6 · Aspen, CO
Flood risk 1/10 · Minimal
- FEMA flood zone
- X (unshaded)
- Chance of flooding over 30 yrs
- 0.0%
- Est. flood insurance / yr
- $473 – $860
Fire risk 4/10 · Minor
- Est. fire insurance / yr
- $939 – $1,743
Heat risk 1/10 · Minimal
- Hot days now (above 76°F)
- 10 days/yr
- Hot days in 30 yrs
- 26 days/yr
Wind risk 1/10 · Minimal
- Chance of severe wind over 30 yrs
- —
Air-quality risk 3/10 · Minor
- Unhealthy air days now
- 2 days/yr
- Unhealthy air days in 30 yrs
- 3 days/yr
Risk factors via First Street. Map © Google.
Why this score? — see what drove the B grade
The composite is a weighted blend of 9 inputs, each scored 0–100. Each bar is that input's sub-score; the figure is the points it added to the 100-point composite (weight × sub-score).
- Cash flow +24.9/30.0
- 1% rule +10.0/10.0
- Appreciation +10.0/10.0
- DSCR +8.1/10.0
- Rent growth +5.0/5.0
- Condition / age +4.8/5.0
- Schools +4.1/10.0
- Livability +3.3/5.0
- ARV discount +0.0/15.0
$525,000
🖨 Deal sheet (PDF) 📄 Offer letter ✓ Due diligence
Listing remarks MLS
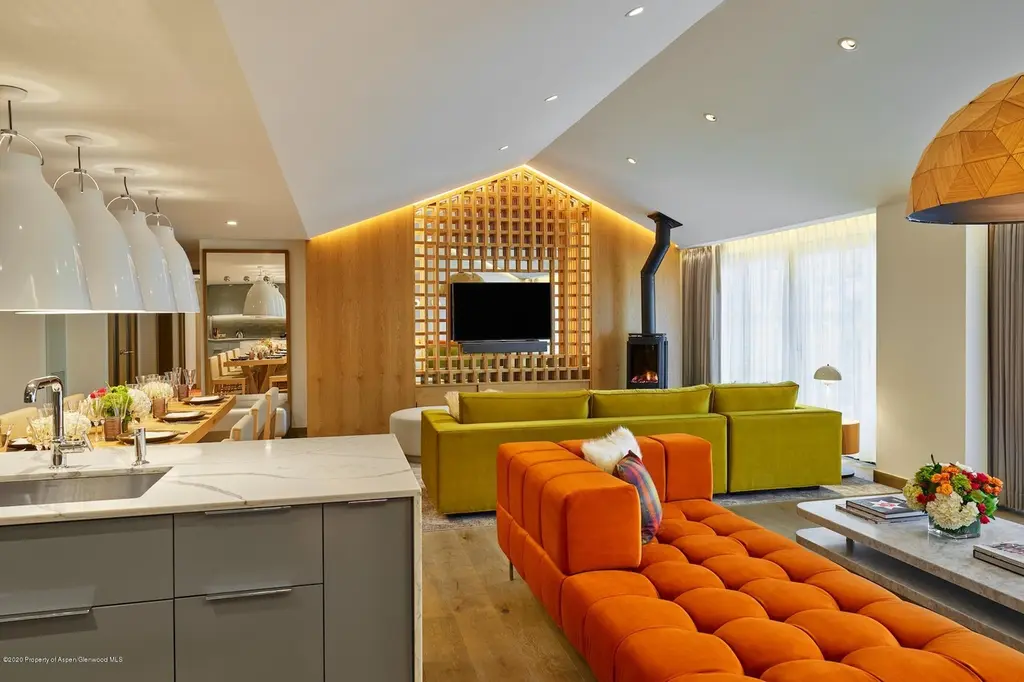
Nestled at the base of Aspen Mountain, the Sky Residences are a collection of two and three-bedroom W‑branded shared ownership Residences within the W Aspen. The Residences are situated on the top two floors of the building and feature spectacular views of Aspen Mountain, downtown Aspen, Red Mountain, and Independence Pass. Owner amenities include access to all W Aspen signature amenities plus a private Residences only roof deck with spa, spacious seating areas, outdoor kitchen, and fire pit. Ownership benefits include garage parking and storage. W Aspen and The Sky Residences at W Aspen were designed by NYC-based nemaworkshop in partnership with Aspen-based Rowland+Broughton Architecture.
Key facts
- Private roof deck
- Fire pit
- Outdoor kitchen
Tags
Neighborhood map
What this means for you Summary
Snapshot
- This is a 3-bed/3.5-bath condo listed at $525k. Condition is rated excellent.
Deal economics
- At list price, monthly cash flow is $1k ($14k/yr) — positive.
- The deal already cash-flows at list — no discount required.
- Meets the 1% rule at list price ($9k rent vs $525k).
- Recommended offer: $462k (12.0% below list) — sets the bar for market timing.
Location & tenants
- Location reads 66/100 on livability (#142 in CO) — a middle-class / working-renter tenant base. Strengths: commute A+, employment A+, schools B+; Watch: amenities F, cost of living F, health & safety F.
- Aspen School District No. 1 In The County Of Pitkin And Sta (rural): math 36% / reading 56% proficiency, ranked #18 of 86 in CO (top 21%) — families likely to look elsewhere, expect single-tenant / working-renter base with shorter leases; only 4% free/reduced lunch — higher-income household profile.
- Market conditions: Rents rising fast (+22.1%/yr); 324 active listings in the ZIP; solid renter incomes; 145 units permitted in Pitkin County in 2024 (89 in 5+ unit buildings).
- At $9,108/mo this rent would consume 132% of the median local household income ($83k/yr) (locally 566% of renters already pay >50% of income on rent) — very limited rent-growth headroom before tenants either downsize or default.
Forward outlook
- In year one you build about $56k of equity ($4k loan paydown + $52k appreciation (10.0% local appreciation)).
- Pitkin County population projected at +20% by 2050 — long-run rental-demand tailwind backs the buy-and-hold thesis.
- At projected returns (10.0% appreciation + 8.0% rent growth), your $147k cash investment doubles in ~2 years — after that, you're playing with house money.
- By year 2, paydown + projected appreciation supports a ~$90k cash-out refi (75% LTV) — recoverable capital for the next deal without selling this one.
Negotiation context
- It's been on market 232 days — a 12% lower offer ($462k) is reasonable based on typical stale-listing flexibility.
Risks & watch-outs
- Watch-outs: HOA is 27% of rent.
Questions for the listing agent
- It's been on market 232 days. Have you received any prior offers? Is the seller open to a 12% concession, seller financing, or rate buy-down credit?
- What does the HOA fee cover, when was the last increase, and are there any pending special assessments or reserve-fund shortfalls?
- Any open or pending special assessments — roof, HVAC, plumbing, elevator, façade? What's the per-unit balance and payoff schedule, and is the seller paying it off at close or rolling it to the buyer?
- Why hasn't it sold? Are there any deal-killer items the seller is aware of (foundation, flood, title, zoning, code violations)?
- Is there a deadline driving the sale (1031 exchange, divorce, estate, relocation)? That informs how much negotiation room exists.
- Schools are B-rated — typically a magnet for longer-tenancy family renters. What's the average tenant stay here, and is there a school-zone premium baked into asking?
- What's the average days-on-market for RENTAL listings here right now (not sales)? A rising rental-DOM trend means longer vacancies and softer asking-rent achievability than the comps imply.
- What's the recent tenant-quality profile in this submarket — average credit score on applications, eviction rate, late-payment / NSF rate, and stable-employment percentage? A property-management company in the area should have these aggregated.
- How much new apartment / multifamily construction is in the pipeline within 1–3 miles? Heavy new supply (>2% of stock underway) typically softens rents 12–24 months out; light construction supports rent growth.
Investment metrics
- 1% rule
- 1.73% ✓
- Cap rate
- 8.87%
- Cash-on-cash
- 9.22%
- DSCR
- 1.41
- GRM
- 4.8
CMA / ARV
- ARV (median comp)
- $433,882
- List price
- $525,000
- Delta
- 21.00%
- Verdict
- OVERPRICED
- Comps
- 20 within 1.0 mi
Projected returns pro-forma
10.0% appreciation · 8.0% rent growth · sell at horizon
- IRR
- 34.4%
- Equity multiple
- 3.77×
- Total profit
- $407,615
- Equity at exit
- $472,962
- IRR
- 32.3%
- Equity multiple
- 9.61×
- Total profit
- $1,266,302
- Equity at exit
- $1,019,960
Cash invested: $147,000 (down + closing). Projections, not guarantees.
Landlord ↔ Tenant lean methodology
- Overall (STATE)
- 38 Tenant-Leaning
- State Colorado
- 38 Tenant-Leaning · D+4
- County
- — inherits STATE
- City
- — inherits STATE
ZIP-level market 81611
- Home prices YoY
- 3.6%
- Rents YoY
- 22.1%
- Active inventory
- 324
- Price-to-rent
- 4.8×
Monthly cashflow live
- Estimated rent
- $9,108 medium interval (Pro) →
- Mortgage (P&I)
- −$2,753
- Tax est. 1.5%
- −$656 /mo · $7,875/yr
- Insurance
- −$219
- HOA
- −$2,438
- Vacancy / Maint / Mgmt
- −$1,913
- Net cashflow
- $1,129
Break-even live
Sensitivity live
| Price | -10% $1,492 | -5% $1,311 | +0% $1,129 | +5% $948 | +10% $766 |
|---|---|---|---|---|---|
| Rent | -10% $410 | -5% $769 | +0% $1,129 | +5% $1,489 | +10% $1,849 |
| Rate | -1.0pp $1,394 | -0.5pp $1,263 | base $1,129 | +0.5pp $993 | +1.0pp $855 |
UW: 25.0% down · 7.5% · 30yr · 1.5% tax · 5.0% vac · 8.0% maint · 8.0% mgmt
Financing live
Cash to close
- Down payment
- $131,250
- Closing costs
- $15,750
- Reserves months
- —
- Total cash needed
- —
Loan-product check · same deal, 3 products live
Conventional
25% down · 7.5% · 30yr
- Down + closing
- —
- Monthly P&I
- —
- Monthly cashflow
- —
- DSCR
- —
- Eligible?
- —
Personal DTI + credit; lowest rate.
DSCR
20% down · 8.5% · 30yr
- Down + closing
- —
- Monthly P&I
- —
- Monthly cashflow
- —
- DSCR
- —
- Eligible?
- —
No personal income docs; deal must DSCR.
Hard money
10% down · 12.0% · 12mo
- Down + closing
- —
- Monthly P&I
- —
- Monthly cashflow
- —
- DSCR
- —
- Eligible?
- —
Short-term bridge; refi at stabilization.
HOA detail condo
- Monthly dues
- $2,438 · $29,256/yr
- Assessments
- None detected in remarks — confirm with the listing agent.
Listing history 18 events
-
2026-06-19days on market $525,000 Active 232 DOM
-
2026-06-18days on market $525,000 Active 231 DOM
-
2026-06-17days on market $525,000 Active 230 DOM
-
2026-06-16days on market $525,000 Active 229 DOM
-
2026-06-15days on market $525,000 Active 228 DOM
-
2026-06-14days on market $525,000 Active 226 DOM
-
2026-06-12days on market $525,000 Active 225 DOM
-
2026-06-09days on market $525,000 Active 222 DOM
-
2026-06-08days on market $525,000 Active 221 DOM
-
2026-06-07days on market $525,000 Active 220 DOM
-
2026-06-05days on market $525,000 Active 217 DOM
-
2026-06-02days on market $525,000 Active 215 DOM
-
2026-06-01days on market $525,000 Active 214 DOM
-
2026-05-31days on market $525,000 Active 213 DOM
-
2026-05-30days on market $525,000 Active 212 DOM
-
2026-04-08price $525,000 702-char remark
Show marketing remark (702 chars)
Nestled at the base of Aspen Mountain, the Sky Residences are a collection of two and three-bedroom W‑branded shared ownership Residences within the W Aspen. The Residences are situated on the top two floors of the building and feature spectacular views of Aspen Mountain, downtown Aspen, Red Mountain, and Independence Pass. Owner amenities include access to all W Aspen signature amenities plus a private Residences only roof deck with spa, spacious seating areas, outdoor kitchen, and fire pit. Ownership benefits include garage parking and storage. W Aspen and The Sky Residences at W Aspen were designed by NYC-based nemaworkshop in partnership with Aspen-based Rowland+Broughton Architecture.
-
2025-12-10price $640,000 702-char remark
Show marketing remark (702 chars)
Nestled at the base of Aspen Mountain, the Sky Residences are a collection of two and three-bedroom W‑branded shared ownership Residences within the W Aspen. The Residences are situated on the top two floors of the building and feature spectacular views of Aspen Mountain, downtown Aspen, Red Mountain, and Independence Pass. Owner amenities include access to all W Aspen signature amenities plus a private Residences only roof deck with spa, spacious seating areas, outdoor kitchen, and fire pit. Ownership benefits include garage parking and storage. W Aspen and The Sky Residences at W Aspen were designed by NYC-based nemaworkshop in partnership with Aspen-based Rowland+Broughton Architecture.
-
2025-10-22$660,000 Active 702-char remark
Show marketing remark (702 chars)
Nestled at the base of Aspen Mountain, the Sky Residences are a collection of two and three-bedroom W‑branded shared ownership Residences within the W Aspen. The Residences are situated on the top two floors of the building and feature spectacular views of Aspen Mountain, downtown Aspen, Red Mountain, and Independence Pass. Owner amenities include access to all W Aspen signature amenities plus a private Residences only roof deck with spa, spacious seating areas, outdoor kitchen, and fire pit. Ownership benefits include garage parking and storage. W Aspen and The Sky Residences at W Aspen were designed by NYC-based nemaworkshop in partnership with Aspen-based Rowland+Broughton Architecture.
ⓘ Source: listings_history table (triggers on properties + properties_extension) + one-shot
backfill from property_details.listing_events for pre-trigger history.
Climate risk First Street
- Flood 1/10 Low FEMA zone X (unshaded) · 0% chance over 30 yrs
- Wildfire 4/10 Moderate
- Heat 1/10 Low 10 d/yr ≥76°F today · 26 d/yr by 30 yrs out
- Wind 1/10 Low
- Air quality 3/10 Moderate 2 unhealthy d/yr today · 3 by 30 yrs out
Nearby sold comps map
Loading sold comps map…
Walkable amenities ~0.75 mi
Loading nearby amenities…
Taxation est. · year 1
- Rental income
- $109,296
- − Mortgage interest
- −$29,408
- − Property taxes
- −$7,875
- − Insurance
- −$2,625
- − Repairs & maintenance
- −$8,744
- − Management
- −$8,744
- − HOA
- −$29,256
- − Depreciation
- −$15,273
- Taxable income
- $7,372
- Est. tax owed @ 24.0%
- −$1,769
- After-tax cash flow
- $11,781/yr
For passive investors: Depreciation is non-cash, so a rental often shows a tax loss while cash-flowing — sheltering income. Rental losses are passive: they offset passive income freely, and up to $25,000/yr can offset ordinary (W-2) income if you actively participate and your MAGI is under $100k (phasing out to $0 by $150k); unused losses carry forward. On sale, claimed depreciation is recaptured at up to 25%, and gains may owe capital-gains tax (a 1031 exchange can defer both). Figures are a year-1 estimate at your 24.0% rate — not tax advice; consult a CPA.
Condition & rehab AI · 9 photos
This luxury condo is in excellent condition with modern amenities, a private roof deck, and stunning mountain views, making it an ideal investment for both resale and rental.
Value-add opportunities
- Both Private roof deck with seating and fire pit — Enhances both resale and rental value due to its unique amenity and scenic views.
- Resale Modern kitchen appliances — Upgrades the kitchen to a more modern standard, enhancing resale value.
- Rental Landscaping and outdoor furniture — Improves curb appeal and outdoor living space, attracting more renters.
Renovation cost estimate screening
Value-add ROI direction
- Both Private roof deck with seating and fire pit — Enhances both resale and rental value due to its unique amenity and scenic views. ↑
- Resale Modern kitchen appliances — Upgrades the kitchen to a more modern standard, enhancing resale value. ↑
- Rental Landscaping and outdoor furniture — Improves curb appeal and outdoor living space, attracting more renters. ↑
ⓘ Cost ranges are severity-bucket heuristics (US national rule-of-thumb). Get contractor quotes + a written scope before underwriting a rehab budget.
Schools (NCES district)
- District
- Aspen School District No. 1 In The County Of Pitkin And Sta
- NCES district ID
- 0802280
- Math proficiency
- 36% ▼ -5.00%
- Reading proficiency
- 56% ▼ -3.00%
- Median HH income
- $66,694
- Composite
- 40.98/100
- National rank
- #3595
- State rank
- #18 of 86 in CO
Livability — Aspen
- Score
- 66/100
- State rank
- #142
- US rank
- #11780
Category grades
Schools grade is shown separately in the Schools card above.
Census & demographics
- Census place
- Aspen, CO
- County
- Pitkin County · 9,068 people
- City population
- 9,068
- Metro
- Glenwood Springs, CO
- Population (ZIP)
- 9,068
- Household income
- $82,664
- Rent vs Own
- Severe rent burden
- 566.0
Population outlook (Pitkin County) Hauer SSP2
- Today (2025)
- 20,121 people
- By 2030
- 21,110 · +4.9%
- By 2040
- 22,707 · +12.9%
- By 2050
- 24,105 · +19.8%
- By 2075
- 27,933 · +38.8%
- By 2100
- 30,018 · +49.2%
Race, ethnicity, and origin ACS 2023
- Neighborhood character
- Predominantly White (81%)
- Race & ethnicity
- White 81% Hispanic / Latino 10% Two or more races 7% Asian 4%
- Hispanic origin (detail)
- Mexican 4% Salvadoran 4%
- Common ancestry
- Slovak 3% Iranian 3% Romanian 3%
- Foreign-born
- 15% · Canada, Dominican Republic, China
- Languages at home
- 82% English-only · Spanish 9% Other Indo-European 2% Chinese 2%
Political lean MEDSL · Pitkin
- 2024 margin
- Solid D (+44.2) · D 71.0% · R 26.8% · Other 2.2%
- 2008→2024 swing
- -4.6pp toward R · 2008: 48.8pp · 2024: 44.2pp
- All cycles
- 2024: D+44.2 2020: D+51.9 2016: D+45.4 2012: D+37.9 2008: D+48.8
Not yet ingested
- Civics
- —
Market trends
- HPI YoY
- ▲ 12.97%
- Current HPI
- 370.9593
- Rent YoY
- ▲ 22.07%
- Metro
- Glenwood Springs, CO
- State GDP YoY
- ▲ 1.95%
- F500 in state
- 14
Industry mix (Fortune 500 HQ in CO)
| Industry | F500 HQs | Revenue |
|---|---|---|
| Technology Distribution | 1 | $31B |
|
||
| Food / Agriculture | 1 | $18B |
|
||
| Packaging | 1 | $14B |
|
||
| Healthcare | 1 | $13B |
|
||
| Energy | 1 | $10B |
|
||
| Technology | 1 | $4B |
|
||
Price history
-20.5% since first listed3 events — show timeline
- 2026-04-08 Price Changed $525,000 AGMLS
- 2025-12-10 Price Changed $640,000 AGMLS
- 2025-10-22 Listed $660,000 AGMLS
Cash-flow waterfall
monthlySold comps — $/sqft
last 12 mo · ≤1 miLoading sold comps…