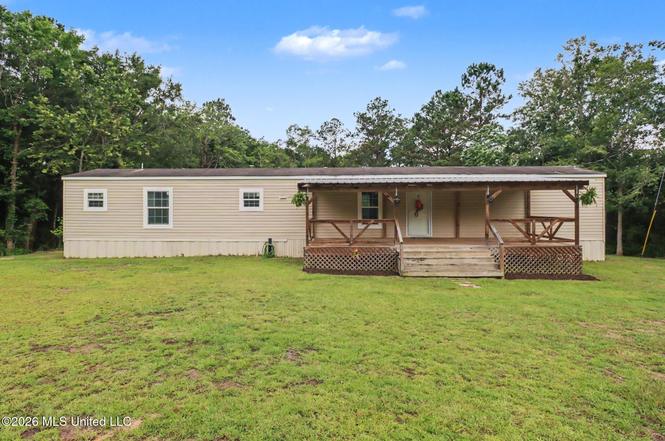
23349 Ramsey Ln · Saucier, MS
Flood risk 1/10 · Minimal
- FEMA flood zone
- X (unshaded)
- Chance of flooding over 30 yrs
- 0.0%
- Est. flood insurance / yr
- $507 – $1,088
Fire risk 8/10 · Major
- Est. fire insurance / yr
- $1,241 – $2,305
Heat risk 9/10 · Severe
- Hot days now (above 109°F)
- 7 days/yr
- Hot days in 30 yrs
- 20 days/yr
Wind risk 9/10 · Severe
- Chance of severe wind over 30 yrs
- 99.0%
Air-quality risk 1/10 · Minimal
- Unhealthy air days now
- 0 days/yr
- Unhealthy air days in 30 yrs
- 0 days/yr
Risk factors via First Street. Map © Google.
Why this score? — see what drove the B grade
The composite is a weighted blend of 9 inputs, each scored 0–100. Each bar is that input's sub-score; the figure is the points it added to the 100-point composite (weight × sub-score).
- Cash flow +29.6/30.0
- ARV discount +15.0/15.0
- DSCR +10.0/10.0
- 1% rule +7.0/10.0
- Schools +4.2/10.0
- Livability +3.3/5.0
- Rent growth +2.5/5.0
- Condition / age +2.5/5.0
- Appreciation +0.0/10.0
$147,000
🖨 Deal sheet 📄 Offer letter ✓ Due diligence
Listing remarks MLS
Great lot with 3.5 acres that is ready for your new home site. At one time there may have been a manufactured home.
Key facts
- Covered front porch
- Split floor plan
- Storage shed
Tags
Property features AI
Finance
- Other: Approximately 3.1 acres; Front yard, wooded lot features
Exterior
- Parking: Gravel parking
- Utilities: Septic tank; Community water; Electricity connected; Water connected; Sewer connected
- Home design: Manufactured home (manufactured house); One level; Move-in ready; Estimated living area
- Construction: Siding exterior; Raised foundation; Shingle roof; Built by builder
- Exterior features: Front porch; Rear porch; Private yard; Partial backyard fencing; Shed(s)
Interior
- Kitchen: Dishwasher; Electric range; Refrigerator; Electric water heater
- Bathrooms: 2 full bathrooms
- Heating & cooling: Central electric heating; Central air (electric)
- Interior features: Ceiling fans; Blinds
- Laundry & utility: Laundry room inside
Neighborhood map
What this means for you Summary
Snapshot
- This is a 3-bed/2.0-bath single-family listed at $147k.
Deal economics
- At list price, monthly cash flow is $528 ($6k/yr) — positive.
- The deal already cash-flows at list — no discount required.
- Meets the 1% rule at list price ($2k rent vs $147k).
- Cap rate 10.6% vs local median 4.4% in Saucier — top-decile yield for the area; either an underpriced asset or a hidden risk that comps aren't pricing in. Stress-test before assuming the spread holds.
Location & tenants
- Location reads 66/100 on livability (#91 in MS) — a middle-class / working-renter tenant base. Strengths: crime A+, cost of living A+; Watch: amenities F, commute F, health & safety F.
- Harrison County School District (rural): math 52% / reading 46% proficiency, ranked #14 of 130 in MS (top 11%) — families likely to look elsewhere, expect single-tenant / working-renter base with shorter leases; 62% free/reduced lunch — lower-income household profile, screen leases tightly.
- Zoned schools: Saucier Elementary School (math 65% / reading 54%, grade B-, #27 of 375 statewide, top 8%, 387 students, 99% FRL); Harrison Central High School (math 38% / reading 38%, grade F, #58 of 197 statewide, top 29%, 1,486 students, 100% FRL) — zoned schools average 100% FRL vs 62% district-wide (37 pts higher); higher-poverty schools than district average — tighter screening recommended.
- Market conditions: 126 active listings in the ZIP; 2,194 units permitted in Harrison County in 2024 (0 in 5+ unit buildings).
Forward outlook
- Local home prices are declining (-3.0%/yr); year-one equity from $1k of loan paydown is wiped out by about $4k of value loss. Plan a longer hold.
- Harrison County population projected at +27% by 2050 — long-run rental-demand tailwind backs the buy-and-hold thesis.
- At projected returns (-3.0% appreciation + 3.0% rent growth), your $41k cash investment doubles in ~8 years — after that, you're playing with house money.
Negotiation context
- Only 3 days on market — expect competitive offers; lowballing is unlikely to land.
- 2 sale attempts since 5y ago with the ask held roughly flat each time — persistent listings suggest the price (not the market) is what's stuck; bring a comps-based counter.
Risks & watch-outs
- Climate carrying-cost: severe wind risk, 99% chance of damaging wind over 30y; severe wildfire risk; extreme-heat days projected 7→20/yr by 2055 (HVAC capex compounding) — expect insurance premiums to compound above CPI over the hold.
Questions for the listing agent
- Is there a deadline driving the sale (1031 exchange, divorce, estate, relocation)? That informs how much negotiation room exists.
- What's the average days-on-market for RENTAL listings here right now (not sales)? A rising rental-DOM trend means longer vacancies and softer asking-rent achievability than the comps imply.
- What's the recent tenant-quality profile in this submarket — average credit score on applications, eviction rate, late-payment / NSF rate, and stable-employment percentage? A property-management company in the area should have these aggregated.
- How much new for-sale + rental construction is in the pipeline within 1–3 miles? Heavy new supply typically softens prices + rents 12–24 months out; constrained supply supports both.
Investment metrics
- 1% rule
- 1.20% ✓
- Cap rate
- 10.61%
- Cash-on-cash
- 15.40%
- DSCR
- 1.69
- GRM
- 6.9
CMA / ARV
- ARV (on-the-fly)
- $217,600
- Comps found
- 2
Show comp detail 2 sales within ~0.75 mi
| Address | Dist | Beds/Ba | Sqft | Sold | Price | $/sf | Match |
|---|---|---|---|---|---|---|---|
| 19685 Amberwood Dr | 0.65mi | 3/2.0 | 1,355 (+6%) | 12mo | $230,000 | $170 | 50 |
| 23273 Autumn Hills Dr | 0.60mi | 3/2.0 | 1,350 (+6%) | 22mo | $219,900 | $163 | 44 |
Match score weights: distance 35% · size 25% · config 20% · recency 20%. Top-matched comps best support the ARV.
Projected returns pro-forma
-3.0% appreciation · 3.0% rent growth · sell at horizon
- IRR
- 6.1%
- Equity multiple
- 1.24×
- Total profit
- $9,762
- Equity at exit
- $21,918
- IRR
- 15.4%
- Equity multiple
- 2.25×
- Total profit
- $51,567
- Equity at exit
- $12,710
Cash invested: $41,160 (down + closing). Projections, not guarantees.
Landlord ↔ Tenant lean methodology
- Overall (STATE)
- 90 Strongly Landlord-Friendly
- State Mississippi
- 90 Strongly Landlord-Friendly · R+11
- County
- — inherits STATE
- City
- — inherits STATE
ZIP-level market 39574
- Home prices YoY
- -23.8%
- Active inventory
- 126
- Price-to-rent
- 6.9×
Monthly cashflow live
- Estimated rent
- $1,769 medium interval (Pro) →
- Mortgage (P&I)
- −$771
- Tax from tax record
- −$37 /mo · $444/yr
- Insurance
- −$61
- HOA
- −$0
- Vacancy / Maint / Mgmt
- −$371
- Net cashflow
- $528
Break-even live
UW: 25.0% down · 7.5% · 30yr · 1.5% tax · 5.0% vac · 8.0% maint · 8.0% mgmt
Financing live
Cash to close
- Down payment
- $36,750
- Closing costs
- $4,410
- Reserves months
- —
- Total cash needed
- —
Loan-product check · same deal, 3 products live
Conventional
25% down · 7.5% · 30yr
- Down + closing
- —
- Monthly P&I
- —
- Monthly cashflow
- —
- DSCR
- —
- Eligible?
- —
Personal DTI + credit; lowest rate.
DSCR
20% down · 8.5% · 30yr
- Down + closing
- —
- Monthly P&I
- —
- Monthly cashflow
- —
- DSCR
- —
- Eligible?
- —
No personal income docs; deal must DSCR.
Hard money
10% down · 12.0% · 12mo
- Down + closing
- —
- Monthly P&I
- —
- Monthly cashflow
- —
- DSCR
- —
- Eligible?
- —
Short-term bridge; refi at stabilization.
Listing history 3 events
-
2026-06-14statusdays on market $147,000 Pending 3 DOM
-
2026-06-13remarks 699-char remark
-
2026-06-13$147,000 Active 2 DOM
ⓘ Source: listings_history table (triggers on properties + properties_extension) + one-shot
backfill from property_details.listing_events for pre-trigger history.
Tax reassessment forecast MS · Resets to sale price
- Current annual tax
- $444 · $37/mo
- Projected year-2 tax
- $1,161 · $97/mo
- Expected delta
- +$718/yr (+$60/mo · 161.7%)
ⓘ Screening estimate from a state-policy table — verify with the county assessor before closing.
Climate risk First Street
- Flood 1/10 Low FEMA zone X (unshaded) · 0% chance over 30 yrs
- Wildfire 8/10 Severe
- Heat 9/10 Extreme 7 d/yr ≥109°F today · 20 d/yr by 30 yrs out
- Wind 9/10 Extreme 99% chance of damaging wind over 30 yrs
- Air quality 1/10 Low 0 unhealthy d/yr today · 0 by 30 yrs out
Nearby sold comps map
Loading sold comps map…
Walkable amenities ~0.75 mi
Loading nearby amenities…
Taxation est. · year 1
- Rental income
- $21,226
- − Mortgage interest
- −$8,234
- − Property taxes
- −$444
- − Insurance
- −$735
- − Repairs & maintenance
- −$1,698
- − Management
- −$1,698
- − Depreciation
- −$4,276
- Taxable income
- $4,140
- Est. tax owed @ 24.0%
- −$994
- After-tax cash flow
- $5,346/yr
For passive investors: Depreciation is non-cash, so a rental often shows a tax loss while cash-flowing — sheltering income. Rental losses are passive: they offset passive income freely, and up to $25,000/yr can offset ordinary (W-2) income if you actively participate and your MAGI is under $100k (phasing out to $0 by $150k); unused losses carry forward. On sale, claimed depreciation is recaptured at up to 25%, and gains may owe capital-gains tax (a 1031 exchange can defer both). Figures are a year-1 estimate at your 24.0% rate — not tax advice; consult a CPA.
Schools (NCES district)
- District
- Harrison County School District
- NCES district ID
- 2801770
- Math proficiency
- 52% ▼ -4.00%
- Reading proficiency
- 46% ▼ -4.00%
- Median HH income
- $46,504
- Composite
- 41.66/100
- National rank
- #3419
- State rank
- #14 of 130 in MS
Livability — Saucier
- Score
- 66/100
- State rank
- #91
- US rank
- #11386
Category grades
Schools grade is shown separately in the Schools card above.
Census & demographics
- Census place
- Saucier, MS
- Population (ZIP)
- 13,830
Population outlook (Harrison County) Hauer SSP2
- Today (2025)
- 228,444 people
- By 2030
- 241,942 · +5.9%
- By 2040
- 267,531 · +17.1%
- By 2050
- 291,062 · +27.4%
- By 2075
- 346,711 · +51.8%
- By 2100
- 378,165 · +65.5%
Race, ethnicity, and origin ACS 2023
- Neighborhood character
- Predominantly White (90%)
- Race & ethnicity
- White 90% Black 5% Two or more races 4%
- Common ancestry
- Lithuanian 10% Italian 5% Romanian 2%
- Foreign-born
- 0%
Political lean MEDSL · Harrison
- 2024 margin
- Strong R (+28.9) · D 35.0% · R 63.9% · Other 1.1%
- 2008→2024 swing
- -2.9pp toward R · 2008: -26.0pp · 2024: -28.9pp
- All cycles
- 2024: R+28.9 2020: R+25.2 2016: R+30.7 2012: R+26.6 2008: R+26.0
Not yet ingested
- Civics
- —
Market trends
- HPI YoY
- ▼ -64.24%
- Current HPI
- 206.218
- Rent YoY
- —
- Metro
- —
- State GDP YoY
- —
- F500 in state
- 0
Price history
+321.2% since first listed3 events — show timeline
- 2026-06-10 Listed $147,000 MLSU
- 2021-10-18 Sold (MLS) — MLSU
- 2021-08-13 Listed $34,900 MLSU
Property tax history
+10.6%/yrLatest (2025): $444 · +10.6% YoY. Source: county tax records.
Cash-flow waterfall
monthlySold comps — $/sqft
last 12 mo · ≤1 miLoading sold comps…