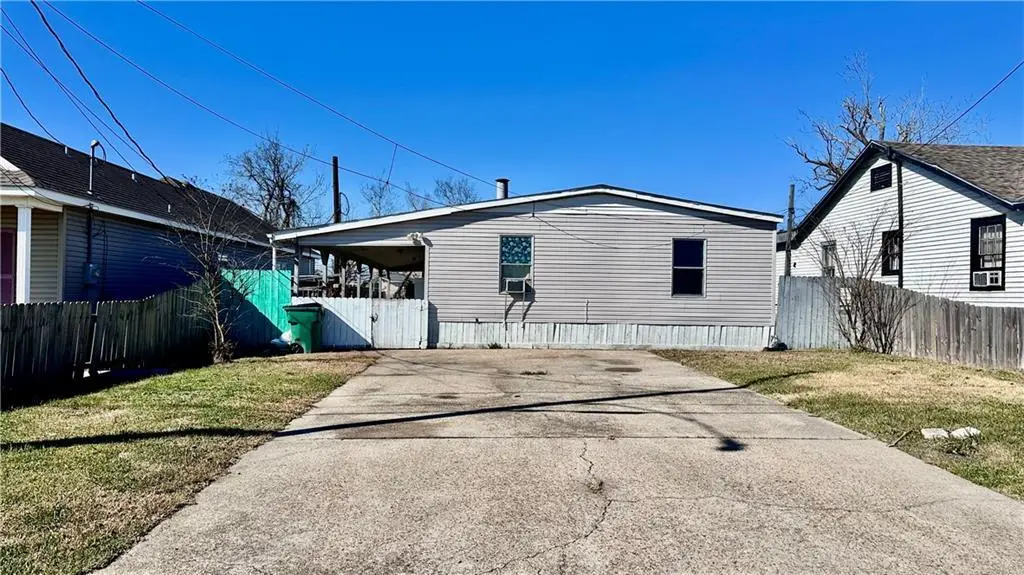
542 Saddler Rd · Marrero, LA
Flood risk 8/10 · Major
- FEMA flood zone
- X
- Chance of flooding over 30 yrs
- 0.6%
- Est. flood insurance / yr
- $507 – $1,088
Fire risk 1/10 · Minimal
- Est. fire insurance / yr
- $1,269 – $2,357
Heat risk 9/10 · Severe
- Hot days now (above 109°F)
- 6 days/yr
- Hot days in 30 yrs
- 16 days/yr
Wind risk 10/10 · Severe
- Chance of severe wind over 30 yrs
- 99.0%
Air-quality risk 3/10 · Minor
- Unhealthy air days now
- 3 days/yr
- Unhealthy air days in 30 yrs
- 4 days/yr
Risk factors via First Street. Map © Google.
Why this score? — see what drove the B- grade
The composite is a weighted blend of 9 inputs, each scored 0–100. Each bar is that input's sub-score; the figure is the points it added to the 100-point composite (weight × sub-score).
- Cash flow +30.0/30.0
- 1% rule +10.0/10.0
- DSCR +10.0/10.0
- ARV discount +7.5/15.0
- Livability +3.4/5.0
- Rent growth +2.8/5.0
- Schools +2.5/10.0
- Condition / age +2.5/5.0
- Appreciation +0.0/10.0
$95,000
🖨 Deal sheet 📄 Offer letter ✓ Due diligence
Key facts
- 3 parking spots
- Built 1950
- Listed 42 days
Property features AI
Exterior
- Parking: Three or more parking spaces
- Utilities: Public water; Public sewer
- Home design: One-story property; Raised foundation; Shingle roof
- Exterior features: City lot; Rectangular lot; Shed(s)
Interior
- Bathrooms: 2 full bathrooms
- Heating & cooling: Window heating units; Window cooling units
- Interior features: Total of 7 rooms; Average condition
Neighborhood map
What this means for you Summary
Snapshot
- This is a 3-bed/2.0-bath manufactured listed at $95k.
Deal economics
- At list price, monthly cash flow is $772 ($9k/yr) — positive.
- The deal already cash-flows at list — no discount required.
- Meets the 1% rule at list price ($2k rent vs $95k).
- Recommended offer: $92k (3.0% below list) — sets the bar for market timing.
- Cap rate 16.9% vs local median 5.9% in Marrero — top-decile yield for the area; either an underpriced asset or a hidden risk that comps aren't pricing in. Stress-test before assuming the spread holds.
Location & tenants
- Location reads 67/100 on livability (#104 in LA) — a middle-class / working-renter tenant base. Strengths: cost of living A+, housing A+, health & safety A+; Watch: crime F, amenities F, commute F.
- Jefferson Parish (suburban): math 24% / reading 34% proficiency, ranked #44 of 98 in LA (top 45%) — low school quality limits family demand, transient renter base, plan for 1-2y turnover; 70% free/reduced lunch — lower-income household profile, screen leases tightly.
- Market conditions: Rents rising (+1.1%/yr); 294 active listings in the ZIP; 23 comparable units currently listed for rent nearby; rentals at typical pace (median 24d on market — plan ~3-4 weeks tenant-placement turnaround); 518 units permitted in Jefferson Parish in 2024 (43 in 5+ unit buildings).
- This rent runs 40% of the median local income ($55k/yr) — at the standard rent-burdened threshold; future hikes will face affordability resistance.
Forward outlook
- Local home prices are declining (-3.0%/yr); year-one equity from $657 of loan paydown is wiped out by about $3k of value loss. Plan a longer hold.
- At projected returns (-3.0% appreciation + 1.1% rent growth), your $27k cash investment doubles in ~4 years — after that, you're playing with house money.
Negotiation context
- It's been on market 42 days — a 3% lower offer ($92k) is reasonable based on typical stale-listing flexibility.
- 2 sale attempts with the ask held roughly flat each time — persistent listings suggest the price (not the market) is what's stuck; bring a comps-based counter.
- Current owner paid $75k; 27% above their basis — modest negotiation headroom, anchor on the comps not their cost.
Risks & watch-outs
- Watch-outs: flood insurance adds $66/mo; built in 1950 — expect roof / HVAC / electrical / plumbing capex.
- Climate carrying-cost: severe flood risk; severe wind risk, 99% chance of damaging wind over 30y; extreme-heat days projected 6→16/yr by 2055 (HVAC capex compounding) — expect insurance premiums to compound above CPI over the hold.
Questions for the listing agent
- It's been on market 42 days. Have you received any prior offers? Is the seller open to a 3% concession, seller financing, or rate buy-down credit?
- Built in 1950 — when were the roof, HVAC, electrical panel, plumbing, and water heater last replaced?
- What's the actual annual flood-insurance premium (NFIP or private), and is the property in a SFHA with mandatory coverage?
- Is there a deadline driving the sale (1031 exchange, divorce, estate, relocation)? That informs how much negotiation room exists.
- Schools are B-rated — typically a magnet for longer-tenancy family renters. What's the average tenant stay here, and is there a school-zone premium baked into asking?
- Crime grade is F in this area — have there been break-ins, vandalism, or insurance claims at this property in the last 3 years? What carrier currently insures it and at what premium?
- What's the average days-on-market for RENTAL listings here right now (not sales)? A rising rental-DOM trend means longer vacancies and softer asking-rent achievability than the comps imply.
- What's the recent tenant-quality profile in this submarket — average credit score on applications, eviction rate, late-payment / NSF rate, and stable-employment percentage? A property-management company in the area should have these aggregated.
- How much new for-sale + rental construction is in the pipeline within 1–3 miles? Heavy new supply typically softens prices + rents 12–24 months out; constrained supply supports both.
Investment metrics
- 1% rule
- 1.92% ✓
- Cap rate
- 16.88%
- Cash-on-cash
- 37.83%
- DSCR
- 2.68
- GRM
- 4.3
CMA / ARV
- ARV (median comp)
- $216,953
- List price
- $95,000
- Delta
- -56.21%
- Verdict
- UNDERPRICED
- Comps
- 20 within 1.0 mi
Projected returns pro-forma
-3.0% appreciation · 1.05% rent growth · sell at horizon
- IRR
- 28.1%
- Equity multiple
- 2.14×
- Total profit
- $30,305
- Equity at exit
- $14,165
- IRR
- 34.4%
- Equity multiple
- 3.86×
- Total profit
- $76,005
- Equity at exit
- $8,214
Cash invested: $26,600 (down + closing). Projections, not guarantees.
Landlord ↔ Tenant lean methodology
- Overall (STATE)
- 90 Strongly Landlord-Friendly
- State Louisiana
- 90 Strongly Landlord-Friendly · R+12
- County
- — inherits STATE
- City
- — inherits STATE
ZIP-level market 70072
- Rents YoY
- 1.1%
- Active inventory
- 294
- Price-to-rent
- 4.3×
Monthly cashflow live
- Estimated rent
- $1,823 high interval (Pro) →
- Mortgage (P&I)
- −$498
- Tax from tax record
- −$64 /mo · $764/yr
- Insurance
- −$40
- Flood insurance flood zone
- −$66 /mo · $798/yr
- HOA
- −$0
- Vacancy / Maint / Mgmt
- −$383
- Net cashflow
- $772
Break-even live
UW: 25.0% down · 7.5% · 30yr · 1.5% tax · 5.0% vac · 8.0% maint · 8.0% mgmt
Financing live
Cash to close
- Down payment
- $23,750
- Closing costs
- $2,850
- Reserves months
- —
- Total cash needed
- —
Loan-product check · same deal, 3 products live
Conventional
25% down · 7.5% · 30yr
- Down + closing
- —
- Monthly P&I
- —
- Monthly cashflow
- —
- DSCR
- —
- Eligible?
- —
Personal DTI + credit; lowest rate.
DSCR
20% down · 8.5% · 30yr
- Down + closing
- —
- Monthly P&I
- —
- Monthly cashflow
- —
- DSCR
- —
- Eligible?
- —
No personal income docs; deal must DSCR.
Hard money
10% down · 12.0% · 12mo
- Down + closing
- —
- Monthly P&I
- —
- Monthly cashflow
- —
- DSCR
- —
- Eligible?
- —
Short-term bridge; refi at stabilization.
Rent comps 23 comps
| Address | Beds | Baths | Sqft | Rent | $/sqft | DOM | Units | Dist |
|---|---|---|---|---|---|---|---|---|
| 512 Avenue G Unit G Marrero, LA | 3.0 | 2.0 | 1418 | $1,995 | $1.41 | 14d | 1 | 0.61mi |
| 539 Avenue G Unit G Marrero, LA | 2.0 | 1.0 | 1105 | $1,400 | $1.27 | 23d | 1 | 0.61mi |
| 508 Avenue G Unit A Marrero, LA | 3.0 | 2.0 | 1062 | $1,550 | $1.46 | 43d | 1 | 0.63mi |
| 4824 4th St Unit A Marrero, LA | 2.0 | 1.5 | 1100 | $1,250 | $1.14 | 43d | 1 | 0.71mi |
| 1100 Avenue A Marrero, LA | 2.0 | 1.0 | 1200 | $1,500 | $1.25 | 43d | 1 | 0.87mi |
| 1028 Gaudet Dr Marrero, LA | 3.0 | 1.5 | 1420 | $1,800 | $1.27 | 43d | 1 | 0.96mi |
| 433 Avenue A Marrero, LA | 3.0 | 2.0 | 1558 | $1,750 | $1.12 | 43d | 1 | 0.98mi |
| 728 Lydia Ct Marrero, LA | 3.0 | 3.5 | 1500 | $2,600 | $1.73 | 4d | 1 | 1.05mi |
| 1510 Javez St Marrero, LA | 3.0 | 2.0 | 1578 | $2,200 | $1.39 | 23d | 1 | 1.08mi |
| 569 Magnolia Dr Marrero, LA | 2.0 | 1.5 | 1450 | $1,500 | $1.03 | 43d | 1 | 1.11mi |
| 1728 Irma St Marrero, LA | 3.0 | 2.0 | 1450 | $1,550 | $1.07 | 23d | 1 | 1.18mi |
| 4029 14th St Marrero, LA | 3.0 | 1.5 | 1511 | $1,650 | $1.09 | 4d | 1 | 1.19mi |
| 4036 14th St Marrero, LA | 4.0 | 2.0 | 1350 | $1,950 | $1.44 | 21d | 1 | 1.20mi |
| 4029 Chestnut St Marrero, LA | 3.0 | 2.0 | 1600 | $2,100 | $1.31 | 4d | 1 | 1.23mi |
| 1124 Orchid Dr Harvey, LA | 4.0 | 2.0 | 2118 | $2,328 | $1.10 | 23d | 1 | 1.25mi |
| 5027 Richland Dr Marrero, LA | 2.0 | 1.5 | 1260 | $1,500 | $1.19 | 4d | 1 | 1.27mi |
| 5119 Oak Dr Marrero, LA | 3.0 | 2.0 | 1624 | $1,750 | $1.08 | 14d | 1 | 1.32mi |
| 517 Bellina Ln Marrero, LA | 2.0 | 1.0 | 1200 | $1,400 | $1.17 | 43d | 1 | 1.40mi |
| 22 Gladiola Ct Marrero, LA | 3.0 | 2.0 | 1933 | $2,200 | $1.14 | 43d | 1 | 1.42mi |
| 520 Bellina Ln Marrero, LA | 2.0 | 1.0 | 1200 | $1,200 | $1.00 | 43d | 1 | 1.42mi |
| 4000 Fir Ct Marrero, LA | 3.0 | 2.0 | 1380 | $1,800 | $1.30 | 4d | 1 | 1.44mi |
| 1520 Orchid Dr Harvey, LA | 3.0 | 1.5 | 1100 | $1,800 | $1.64 | 23d | 1 | 1.50mi |
| 1520 Orchid Dr Harvey, LA | 3.0 | 1.5 | 1100 | $1,650 | $1.50 | 4d | 1 | 1.50mi |
Listing history 19 events
-
2026-06-18days on market $95,000 Active 42 DOM
-
2026-06-17days on market $95,000 Active 41 DOM
-
2026-06-16days on market $95,000 Active 40 DOM
-
2026-06-15days on market $95,000 Active 39 DOM
-
2026-06-13days on market $95,000 Active 37 DOM
-
2026-06-10days on market $95,000 Active 34 DOM
-
2026-06-09days on market $95,000 Active 33 DOM
-
2026-06-08days on market $95,000 Active 32 DOM
-
2026-06-07days on market $95,000 Active 31 DOM
-
2026-06-03days on market $95,000 Active 27 DOM
-
2026-06-02days on market $95,000 Active 26 DOM
-
2026-06-01days on market $95,000 Active 25 DOM
-
2026-05-31days on market $95,000 Active 24 DOM
-
2026-05-07$95,000 Active
-
2026-05-07$95,000 Active
-
2023-07-24soldstatus $75,000
-
2017-09-08soldstatus $70,000
-
2016-03-08soldstatus $58,000
-
2000-07-01soldstatus $44,000
ⓘ Source: listings_history table (triggers on properties + properties_extension) + one-shot
backfill from property_details.listing_events for pre-trigger history.
Tax reassessment forecast LA · Resets to sale price
- Current annual tax
- $764 · $64/mo
- Projected year-2 tax
- $764 · $64/mo
- Expected delta
- $0/yr ($0/mo · 0.0%)
ⓘ Screening estimate from a state-policy table — verify with the county assessor before closing.
Climate risk First Street
- Flood 8/10 Severe FEMA zone X · 60% chance over 30 yrs
- Wildfire 1/10 Low
- Heat 9/10 Extreme 6 d/yr ≥109°F today · 16 d/yr by 30 yrs out
- Wind 10/10 Extreme 99% chance of damaging wind over 30 yrs
- Air quality 3/10 Moderate 3 unhealthy d/yr today · 4 by 30 yrs out
Nearby sold comps map
Loading sold comps map…
Walkable amenities ~0.75 mi
Loading nearby amenities…
Taxation est. · year 1
- Rental income
- $21,872
- − Mortgage interest
- −$5,321
- − Property taxes
- −$764
- − Insurance
- −$1,272
- − Repairs & maintenance
- −$1,750
- − Management
- −$1,750
- − Depreciation
- −$2,764
- Taxable income
- $8,252
- Est. tax owed @ 24.0%
- −$1,980
- After-tax cash flow
- $7,284/yr
For passive investors: Depreciation is non-cash, so a rental often shows a tax loss while cash-flowing — sheltering income. Rental losses are passive: they offset passive income freely, and up to $25,000/yr can offset ordinary (W-2) income if you actively participate and your MAGI is under $100k (phasing out to $0 by $150k); unused losses carry forward. On sale, claimed depreciation is recaptured at up to 25%, and gains may owe capital-gains tax (a 1031 exchange can defer both). Figures are a year-1 estimate at your 24.0% rate — not tax advice; consult a CPA.
Schools (NCES district)
- District
- Jefferson Parish
- NCES district ID
- 2200840
- Math proficiency
- 24% ▼ -36.00%
- Reading proficiency
- 34% ▼ -30.00%
- Median HH income
- $48,421
- Composite
- 25.19/100
- National rank
- #7511
- State rank
- #44 of 98 in LA
Livability — Marrero
- Score
- 67/100
- State rank
- #104
- US rank
- #10146
Category grades
Schools grade is shown separately in the Schools card above.
Census & demographics
- Census place
- Marrero, LA
- County
- Jefferson Parish · 426,999 people
- City population
- 55,693
- Metro
- New Orleans-Metairie, LA
- Population (ZIP)
- 55,693
- Household income
- $54,885
- Rent vs Own
- Severe rent burden
- 1807.0
Population outlook (Jefferson County) Hauer SSP2
- Today (2025)
- 451,696 people
- By 2030
- 455,451 · +0.8%
- By 2040
- 458,308 · +1.5%
- By 2050
- 461,031 · +2.1%
- By 2075
- 476,351 · +5.5%
- By 2100
- 499,377 · +10.6%
Race, ethnicity, and origin ACS 2023
- Neighborhood character
- Diverse neighborhood (Simpson 0.67)
- Race & ethnicity
- Black 40% White 39% Hispanic / Latino 12% Two or more races 7% Asian 5%
- Hispanic origin (detail)
- Mexican 4% Dominican 1%
- Common ancestry
- Lithuanian 12% Hispanic 1%
- Foreign-born
- 10% · Canada, Vietnam, Jamaica
- Languages at home
- 85% English-only · Spanish 8% Vietnamese 4% French/Haitian/Cajun 2%
Political lean MEDSL · Jefferson
- 2024 margin
- R (+12.9) · D 42.5% · R 55.5% · Other 2.1%
- 2008→2024 swing
- +13.6pp toward D · 2008: -26.6pp · 2024: -12.9pp
- All cycles
- 2024: R+12.9 2020: R+11.1 2016: R+14.8 2012: R+18.4 2008: R+26.6
Not yet ingested
- Civics
- —
Market trends
- HPI YoY
- ▼ -89.87%
- Current HPI
- 161.7477
- Rent YoY
- ▲ 1.05%
- Metro
- New Orleans-Metairie, LA
- State GDP YoY
- ▲ 3.29%
- F500 in state
- 10
Industry mix (Fortune 500 HQ in LA)
| Industry | F500 HQs | Revenue |
|---|---|---|
| Telecommunications | 2 | $23B |
|
||
| Utilities | 1 | $12B |
|
||
| Wholesale / Distribution | 1 | $5B |
|
||
| Advertising | 1 | $2B |
|
||
Price history
+115.9% since first listed6 events — show timeline
- 2026-05-07 Listed $95,000 AcadianaMLS
- 2026-05-07 Listed $95,000 GSREIN
- 2023-07-24 Sold (Public Records) $75,000 Public Records
- 2017-09-08 Sold (Public Records) $70,000 Public Records
- 2016-03-08 Sold (Public Records) $58,000 Public Records
- 2000-07-01 Sold (Public Records) $44,000 Public Records
Property tax history
+4.7%/yrLatest (2025): $764 · +0.3% YoY. Source: county tax records.
Cash-flow waterfall
monthlySold comps — $/sqft
last 12 mo · ≤1 miLoading sold comps…