 🏗️ New Construction
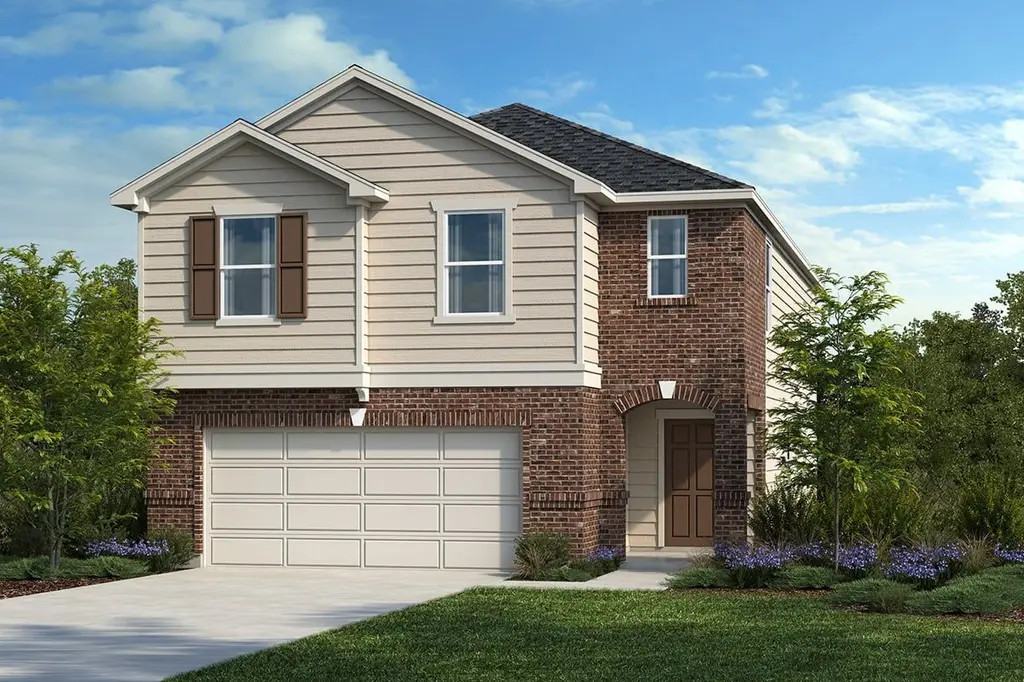
Plan 2348 Plan · Arcola, TX
Flood risk 1/10 · Minimal
- FEMA flood zone
- X (unshaded)
- Chance of flooding over 30 yrs
- 0.0%
- Est. flood insurance / yr
- $507 – $1,088
Fire risk 5/10 · Moderate
- Est. fire insurance / yr
- $1,222 – $2,270
Heat risk 9/10 · Severe
- Hot days now (above 110°F)
- 7 days/yr
- Hot days in 30 yrs
- 24 days/yr
Wind risk 9/10 · Severe
- Chance of severe wind over 30 yrs
- 99.0%
Air-quality risk 2/10 · Minimal
- Unhealthy air days now
- 2 days/yr
- Unhealthy air days in 30 yrs
- 2 days/yr
Risk factors via First Street. Map © Google.
Why this score? — see what drove the D grade
The composite is a weighted blend of 9 inputs, each scored 0–100. Each bar is that input's sub-score; the figure is the points it added to the 100-point composite (weight × sub-score).
- Cash flow +13.8/30.0
- ARV discount +7.5/15.0
- Schools +4.5/10.0
- DSCR +4.2/10.0
- Condition / age +4.0/5.0
- 1% rule +3.9/10.0
- Livability +2.7/5.0
- Rent growth +2.6/5.0
- Appreciation +0.0/10.0
$301,995
🖨 Deal sheet (PDF) 📄 Offer letter ✓ Due diligence
Listing remarks MLS
* Gas range * Dedicated laundry room * Smart thermostat * Kitchen USB charging port * Loft * Low-E windows * Kitchen island * 6-panel interior doors * Granite kitchen countertops * Spacious great room * Walk-in kitchen pantry * ENERGY STAR® certified home * Master-planned community * Swimming pool * Playground * Close to golf courses * Pond * Clubhouse
Key facts
- Loft
- Low-e windows
- Kitchen island
Tags
Neighborhood map
What this means for you Summary
Snapshot
- This is a 4-bed/2.5-bath single-family listed at $302k. Condition is rated good.
Deal economics
- At list price, monthly cash flow is $27 ($325/yr) — positive.
- To cash-flow at today's rent, offer at most $302k (0.1% below list).
- To meet the 1% rule (rent ≥ 1% of price), the offer needs to be $264k (12.6% below list).
- Recommended offer: $264k (12.6% below list) — sets the bar for 1% rule.
- Cap rate 6.4% vs local median 5.0% in Arcola — meaningfully above typical; check what's discounted (condition, days-on-market, listing class) to confirm the premium yield is real.
Location & tenants
- Location reads 53/100 on livability (#1,425 in TX) — a working-class tenant base; expect higher turnover. Strengths: cost of living A+, housing A; Watch: employment C-, crime F, amenities F.
- Fort Bend ISD (suburban): math 44% / reading 53% proficiency, ranked #140 of 826 in TX (top 17%) — families likely to look elsewhere, expect single-tenant / working-renter base with shorter leases.
- Zoned schools: Heritage Rose El (math 29% / reading 28%, grade F, #2,706 of 4,322 statewide, top 63%, 1,209 students, 83% FRL); Billy Baines Middle (math 47% / reading 53%, grade C, #347 of 1,662 statewide, top 21%, 1,296 students, 37% FRL); Ridge Point H S (math 61% / reading 69%, grade B, #198 of 1,632 statewide, top 12%, 3,170 students, 31% FRL) — zoned schools average 50% FRL vs 35% district-wide (15 pts higher); higher-poverty schools than district average — tighter screening recommended.
- Market conditions: Rents flat; 1148 active listings in the ZIP; 9 comparable units currently listed for rent nearby; rentals lingering (median 45d on market — plan ~5-8 weeks vacancy on turnover, expect pricing pressure); 67% of comp listings sitting > 30 days — soft ceiling on asking rent; high-income renter base; 12,093 units permitted in Fort Bend County in 2024 (815 in 5+ unit buildings).
Forward outlook
- Local home prices are declining (-3.0%/yr); year-one equity from $2k of loan paydown is wiped out by about $9k of value loss. Plan a longer hold.
- Fort Bend County population projected at +75% by 2050 — long-run rental-demand tailwind backs the buy-and-hold thesis.
Negotiation context
- It's been on market 275 days — a 12% lower offer ($266k) is reasonable based on typical stale-listing flexibility.
Risks & watch-outs
- Climate carrying-cost: severe wind risk, 99% chance of damaging wind over 30y; moderate wildfire risk; extreme-heat days projected 7→24/yr by 2055 (HVAC capex compounding) — expect insurance premiums to compound above CPI over the hold.
Questions for the listing agent
- It's been on market 275 days. Have you received any prior offers? Is the seller open to a 13% concession, seller financing, or rate buy-down credit?
- Why hasn't it sold? Are there any deal-killer items the seller is aware of (foundation, flood, title, zoning, code violations)?
- Is there a deadline driving the sale (1031 exchange, divorce, estate, relocation)? That informs how much negotiation room exists.
- Schools are F-rated, which usually means shorter tenancies and higher turnover. Who's the typical renter profile here, and what's been the actual vacancy rate?
- Crime grade is F in this area — have there been break-ins, vandalism, or insurance claims at this property in the last 3 years? What carrier currently insures it and at what premium?
- The area grade is low — what's the realistic commute time and amenity access for the typical tenant pool here? Any planned neighborhood developments (good or bad) we should know about?
- What's the average days-on-market for RENTAL listings here right now (not sales)? A rising rental-DOM trend means longer vacancies and softer asking-rent achievability than the comps imply.
- What's the recent tenant-quality profile in this submarket — average credit score on applications, eviction rate, late-payment / NSF rate, and stable-employment percentage? A property-management company in the area should have these aggregated.
- How much new for-sale + rental construction is in the pipeline within 1–3 miles? Heavy new supply typically softens prices + rents 12–24 months out; constrained supply supports both.
Investment metrics
- 1% rule
- 0.89% ✗
- Cap rate
- 6.40%
- Cash-on-cash
- 0.39%
- DSCR
- 1.02
- GRM
- 9.4
CMA / ARV
- ARV (median comp)
- $297,851
- List price
- $301,995
- Delta
- 1.39%
- Verdict
- FAIR
- Comps
- 20 within 1.0 mi
Show comp detail 12 sales within ~0.75 mi
| Address | Dist | Beds/Ba | Sqft | Sold | Price | $/sf | Match |
|---|---|---|---|---|---|---|---|
| 6915 Sunnyvale Ln | 0.08mi | 4/3.5 | 2,501 (+6%) | 2mo | $295,000 | $118 | 79 |
| 219 Murrieta Ln | 0.07mi | 4/2.0 | 2,013 (-14%) | 6mo | $259,000 | $129 | 66 |
| 507 Marley Oak Dr | 0.70mi | 4/3.0 | 2,261 (-4%) | 2mo | $319,900 | $141 | 58 |
| 802 Pismo Ln | 0.53mi | 4/3.5 | 2,495 (+6%) | 8mo | $339,900 | $136 | 55 |
| 207 William Ln | 0.74mi | 4/3.0 | 2,214 (-6%) | 2mo | $325,000 | $147 | 52 |
| 818 Pismo Ln | 0.55mi | 4/3.5 | 2,508 (+7%) | 12mo | $319,900 | $128 | 49 |
| 7714 Cattleman Valley Dr | 0.72mi | 4/2.5 | 2,561 (+9%) | 8mo | $329,900 | $129 | 44 |
| 6434 Downey Ln | 0.67mi | 4/3.5 | 2,064 (-12%) | 2mo | $349,900 | $170 | 43 |
| 6414 Downey Ln | 0.70mi | 4/3.5 | 2,154 (-8%) | 11mo | $369,900 | $172 | 40 |
| 6514 Downey Ln | 0.64mi | 4/3.5 | 2,064 (-12%) | 8mo | $349,888 | $170 | 39 |
| 8527 Tropical Breeze | 0.73mi | 4/2.0 | 2,035 (-13%) | 12mo | $304,990 | $150 | 32 |
| 1115 Lipizzan Ln | 0.75mi | 5/2.0 (+1) | 2,004 (-15%) | 5mo | $275,000 | $137 | 30 |
Match score weights: distance 35% · size 25% · config 20% · recency 20%. Top-matched comps best support the ARV.
Projected returns pro-forma
-3.0% appreciation · 0.44% rent growth · sell at horizon
- IRR
- -18.6%
- Equity multiple
- 0.36×
- Total profit
- $-53,130
- Equity at exit
- $44,411
- IRR
- -17.1%
- Equity multiple
- 0.16×
- Total profit
- $-69,728
- Equity at exit
- $25,753
Cash invested: $83,398 (down + closing). Projections, not guarantees.
Landlord ↔ Tenant lean methodology
- Overall (STATE)
- 87 Strongly Landlord-Friendly
- State Texas
- 87 Strongly Landlord-Friendly · R+5
- County
- — inherits STATE
- City
- — inherits STATE
ZIP-level market 77583
- Rents YoY
- 0.4%
- Active inventory
- 1148
- Price-to-rent
- 9.5×
Monthly cashflow live
- Estimated rent
- $2,640 high interval (Pro) →
- Mortgage (P&I)
- −$1,562
- Tax est. 1.5%
- −$372 /mo · $4,468/yr
- Insurance
- −$124
- HOA
- −$0
- Vacancy / Maint / Mgmt
- −$554
- Net cashflow
- $27
Break-even live
Sensitivity live
| Price | -10% $233 | -5% $130 | +0% $27 | +5% $-76 | +10% $-179 |
|---|---|---|---|---|---|
| Rent | -10% $-181 | -5% $-77 | +0% $27 | +5% $131 | +10% $236 |
| Rate | -1.0pp $177 | -0.5pp $103 | base $27 | +0.5pp $-50 | +1.0pp $-129 |
UW: 25.0% down · 7.5% · 30yr · 1.5% tax · 5.0% vac · 8.0% maint · 8.0% mgmt
Financing live
Cash to close
- Down payment
- $74,463
- Closing costs
- $8,936
- Reserves months
- —
- Total cash needed
- —
Loan-product check · same deal, 3 products live
Conventional
25% down · 7.5% · 30yr
- Down + closing
- —
- Monthly P&I
- —
- Monthly cashflow
- —
- DSCR
- —
- Eligible?
- —
Personal DTI + credit; lowest rate.
DSCR
20% down · 8.5% · 30yr
- Down + closing
- —
- Monthly P&I
- —
- Monthly cashflow
- —
- DSCR
- —
- Eligible?
- —
No personal income docs; deal must DSCR.
Hard money
10% down · 12.0% · 12mo
- Down + closing
- —
- Monthly P&I
- —
- Monthly cashflow
- —
- DSCR
- —
- Eligible?
- —
Short-term bridge; refi at stabilization.
Rent comps 9 comps
| Address | Beds | Baths | Sqft | Rent | $/sqft | DOM | Units | Dist |
|---|---|---|---|---|---|---|---|---|
| 6911 Rosemont Ct Rosharon, TX | 4.0 | 2.0 | 1719 | $1,750 | $1.02 | 14d | 1 | 0.14mi |
| 7711 Sleek Flock Ln Rosharon, TX | 4.0 | 3.0 | 2492 | $2,850 | $1.14 | 26d | 1 | 0.81mi |
| 7218 Bakersfield Ct Rosharon, TX | 3.0 | 2.5 | 2004 | $2,200 | $1.10 | 45d | 1 | 0.84mi |
| 6927 Ventura Dr Rosharon, TX | 5.0 | 4.0 | 2771 | $3,300 | $1.19 | 45d | 1 | 0.96mi |
| 8210 Radial Ct Rosharon, TX | 5.0 | 2.5 | 2506 | $2,550 | $1.02 | 45d | 1 | 1.27mi |
| 8310 Rose Petals Ln Rosharon, TX | 4.0 | 2.0 | 1833 | $2,300 | $1.25 | 45d | 1 | 1.33mi |
| 8043 House Bank Ln Rosharon, TX | 4.0 | 3.0 | 2512 | $2,550 | $1.02 | 20d | 1 | 1.35mi |
| 318 Manor Ave Rosharon, TX | 3.0 | 3.0 | 1924 | $2,400 | $1.25 | 45d | 1 | 1.38mi |
| 8414 Aster Glen Way Rosharon, TX | 4.0 | 2.5 | 2588 | $2,650 | $1.02 | 45d | 1 | 1.41mi |
Listing history 14 events
-
2026-06-21days on market $301,995 Active 275 DOM
-
2026-06-18days on market $301,995 Active 272 DOM
-
2026-06-17days on market $301,995 Active 271 DOM
-
2026-06-16days on market $301,995 Active 270 DOM
-
2026-06-15days on market $301,995 Active 269 DOM
-
2026-06-13days on market $301,995 Active 267 DOM
-
2026-06-09days on market $301,995 Active 263 DOM
-
2026-06-07days on market $301,995 Active 261 DOM
-
2026-06-04days on market $301,995 Active 258 DOM
-
2026-06-03days on market $301,995 Active 257 DOM
-
2026-06-02days on market $301,995 Active 256 DOM
-
2026-06-01days on market $301,995 Active 255 DOM
-
2026-05-31days on market $301,995 Active 254 DOM
-
2025-09-20$301,995 Active 393-char remark
Show marketing remark (393 chars)
* Gas range * Dedicated laundry room * Smart thermostat * Kitchen USB charging port * Loft * Low-E windows * Kitchen island * 6-panel interior doors * Granite kitchen countertops * Spacious great room * Walk-in kitchen pantry * ENERGY STAR® certified home * Master-planned community * Swimming pool * Playground * Close to golf courses * Pond * Clubhouse
ⓘ Source: listings_history table (triggers on properties + properties_extension) + one-shot
backfill from property_details.listing_events for pre-trigger history.
Climate risk First Street
- Flood 1/10 Low FEMA zone X (unshaded) · 0% chance over 30 yrs
- Wildfire 5/10 Major
- Heat 9/10 Extreme 7 d/yr ≥110°F today · 24 d/yr by 30 yrs out
- Wind 9/10 Extreme 99% chance of damaging wind over 30 yrs
- Air quality 2/10 Low 2 unhealthy d/yr today · 2 by 30 yrs out
Nearby sold comps map
Loading sold comps map…
Walkable amenities ~0.75 mi
Loading nearby amenities…
Taxation est. · year 1
- Rental income
- $31,678
- − Mortgage interest
- −$16,684
- − Property taxes
- −$4,468
- − Insurance
- −$1,489
- − Repairs & maintenance
- −$2,534
- − Management
- −$2,534
- − Depreciation
- −$8,665
- Taxable loss
- −$4,696
- Est. tax savings @ 24.0%
- +$1,127
- After-tax cash flow
- $1,452/yr
For passive investors: Depreciation is non-cash, so a rental often shows a tax loss while cash-flowing — sheltering income. Rental losses are passive: they offset passive income freely, and up to $25,000/yr can offset ordinary (W-2) income if you actively participate and your MAGI is under $100k (phasing out to $0 by $150k); unused losses carry forward. On sale, claimed depreciation is recaptured at up to 25%, and gains may owe capital-gains tax (a 1031 exchange can defer both). Figures are a year-1 estimate at your 24.0% rate — not tax advice; consult a CPA.
Condition & rehab AI · 12 photos
This home is in excellent condition with no major repairs needed. It's located in a master-planned community with amenities like a swimming pool and playground, making it a great investment.
Value-add opportunities
- Both landscaping — enhances curb appeal and adds value
- Both smart home integration — increases home's appeal and marketability
Renovation cost estimate screening
Value-add ROI direction
- Both landscaping — enhances curb appeal and adds value ↑
- Both smart home integration — increases home's appeal and marketability ↑
ⓘ Cost ranges are severity-bucket heuristics (US national rule-of-thumb). Get contractor quotes + a written scope before underwriting a rehab budget.
Schools (NCES district)
- District
- Fort Bend ISD
- NCES district ID
- 4819650
- Math proficiency
- 44% ▼ -15.00%
- Reading proficiency
- 53% ▼ -4.00%
- Median HH income
- $82,360
- Composite
- 44.61/100
- National rank
- #2779
- State rank
- #140 of 826 in TX
Livability — Arcola
- Score
- 53/100
- State rank
- #1425
- US rank
- #24358
Category grades
Schools grade is shown separately in the Schools card above.
Census & demographics
- County
- Brazoria County · 374,982 people
- Metro
- Houston-The Woodlands-Sugar Land, TX
- Population (ZIP)
- 52,747
- Household income
- $119,287
- Rent vs Own
- Severe rent burden
- 251.0
Population outlook (Fort Bend County) Hauer SSP2
- Today (2025)
- 1,004,526 people
- By 2030
- 1,153,104 · +14.8%
- By 2040
- 1,453,718 · +44.7%
- By 2050
- 1,753,781 · +74.6%
- By 2075
- 2,455,772 · +144.5%
- By 2100
- 2,930,528 · +191.7%
Race, ethnicity, and origin ACS 2023
- Neighborhood character
- Highly diverse neighborhood (Simpson 0.70)
- Race & ethnicity
- Hispanic / Latino 38% Black 34% White 20% Two or more races 18% Asian 5%
- Hispanic origin (detail)
- Mexican 31% Puerto Rican 2%
- Common ancestry
- Lithuanian 1% Slovak 1% Romanian 1%
- Foreign-born
- 16% · Canada, Vietnam, China
- Languages at home
- 64% English-only · Spanish 28% Other Asian/Pacific 2% Vietnamese 1%
Political lean MEDSL · Fort Bend
- 2024 margin
- Toss-up / Even · D 49.5% · R 47.9% · Other 2.6%
- 2008→2024 swing
- +4.0pp toward D · 2008: -2.4pp · 2024: 1.6pp
- All cycles
- 2024: D+1.6 2020: D+10.6 2016: D+6.6 2012: R+6.8 2008: R+2.4
Not yet ingested
- Civics
- —
Market trends
- HPI YoY
- ▼ -120.19%
- Current HPI
- 198.6559
- Rent YoY
- ▲ 0.44%
- Metro
- Houston-The Woodlands-Sugar Land, TX
- State GDP YoY
- ▲ 3.95%
- F500 in state
- 110
Industry mix (Fortune 500 HQ in TX)
| Industry | F500 HQs | Revenue |
|---|---|---|
| Energy | 16 | $1,198B |
|
||
| Technology | 5 | $198B |
|
||
| Engineering / Construction | 4 | $72B |
|
||
| Energy Services | 3 | $60B |
|
||
| Utilities | 3 | $41B |
|
||
| Healthcare | 2 | $330B |
|
||
Price history
1 event — show timeline
- 2025-09-20 Listed $301,995 Zillow
Cash-flow waterfall
monthlySold comps — $/sqft
last 12 mo · ≤1 miLoading sold comps…