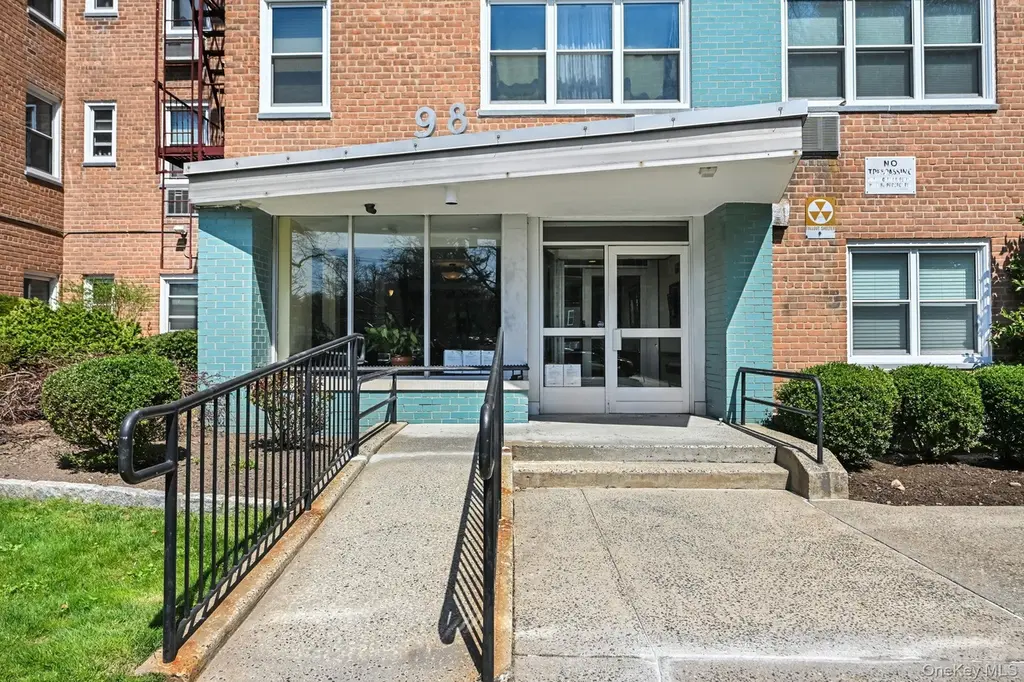
98 Dehaven Dr Unit 2B · Yonkers, NY
Flood risk 1/10 · Minimal
- FEMA flood zone
- X (unshaded)
- Chance of flooding over 30 yrs
- 0.0%
- Est. flood insurance / yr
- $473 – $860
Fire risk 3/10 · Minor
- Est. fire insurance / yr
- $691 – $1,283
Heat risk 5/10 · Moderate
- Hot days now (above 99°F)
- 7 days/yr
- Hot days in 30 yrs
- 15 days/yr
Wind risk 6/10 · Moderate
- Chance of severe wind over 30 yrs
- 27.0%
Air-quality risk 4/10 · Minor
- Unhealthy air days now
- 4 days/yr
- Unhealthy air days in 30 yrs
- 6 days/yr
Risk factors via First Street. Map © Google.
Why this score? — see what drove the B- grade
The composite is a weighted blend of 9 inputs, each scored 0–100. Each bar is that input's sub-score; the figure is the points it added to the 100-point composite (weight × sub-score).
- Cash flow +28.6/30.0
- DSCR +10.0/10.0
- ARV discount +9.7/15.0
- 1% rule +7.9/10.0
- Schools +4.1/10.0
- Livability +3.4/5.0
- Rent growth +2.5/5.0
- Condition / age +2.2/5.0
- Appreciation +0.0/10.0
$185,000
🖨 Deal sheet 📄 Offer letter ✓ Due diligence
Listing remarks
Tudor Woods Cooperative - North Yonkers | One Bed Room One Bath Unit Bonus Room Currently Used as an Office| Assigned Parking - Wait List For Garage | Updated Common Laundry | California Closet Updates | Elevator | Easy Access To All Major Roadways, Shopping, Dining and Entertainment | Near Untermyer Park, Saint John's Riverside Hospital and Executive Blvd |
Key facts
- Garage
- Built 1960
- Listed 52 days
Neighborhood map
What this means for you Summary
Snapshot
- This is a 1-bed/1.0-bath condo listed at $185k. Condition is rated fair.
Deal economics
- At list price, monthly cash flow is $610 ($7k/yr) — positive.
- The deal already cash-flows at list — no discount required.
- Meets the 1% rule at list price ($2k rent vs $185k).
- Recommended offer: $179k (3.0% below list) — sets the bar for market timing.
- Cap rate 10.2% vs local median 5.3% in Yonkers — top-decile yield for the area; either an underpriced asset or a hidden risk that comps aren't pricing in. Stress-test before assuming the spread holds.
Location & tenants
- Location reads 68/100 on livability (#528 in NY) — a middle-class / working-renter tenant base. Strengths: employment A, commute B; Watch: amenities F, cost of living F.
- Yonkers City School District (suburban): math 41% / reading 54% proficiency, ranked #413 of 590 in NY (top 70%) — families likely to look elsewhere, expect single-tenant / working-renter base with shorter leases; 64% free/reduced lunch — lower-income household profile, screen leases tightly.
- Market conditions: 75 active listings in the ZIP; 16 comparable units currently listed for rent nearby; rentals lingering (median 44d on market — plan ~5-8 weeks vacancy on turnover, expect pricing pressure); 56% of comp listings sitting > 30 days — soft ceiling on asking rent; solid renter incomes; 954 units permitted in Westchester County in 2024 (649 in 5+ unit buildings).
- This rent runs 32% of the median local income ($90k/yr) — at the standard rent-burdened threshold; future hikes will face affordability resistance.
Forward outlook
- Local home prices are declining (-3.0%/yr); year-one equity from $1k of loan paydown is wiped out by about $6k of value loss. Plan a longer hold.
- Westchester County population projected at +10% by 2050 — modest demand growth; plan on rents tracking national, not racing it.
- At projected returns (-3.0% appreciation + 3.0% rent growth), your $52k cash investment doubles in ~9 years — after that, you're playing with house money.
Negotiation context
- It's been on market 52 days — a 3% lower offer ($179k) is reasonable based on typical stale-listing flexibility.
- 2 sale attempts with the ask held roughly flat each time — persistent listings suggest the price (not the market) is what's stuck; bring a comps-based counter.
Risks & watch-outs
- Climate carrying-cost: major wind risk, 27% chance of damaging wind over 30y; extreme-heat days projected 7→15/yr by 2055 (HVAC capex compounding) — expect insurance premiums to compound above CPI over the hold.
Questions for the listing agent
- It's been on market 52 days. Have you received any prior offers? Is the seller open to a 3% concession, seller financing, or rate buy-down credit?
- Have any recent inspections been done? Can we get a copy of the seller's disclosures and any deferred-maintenance estimates?
- Built in 1960 — when were the roof, HVAC, electrical panel, plumbing, and water heater last replaced?
- Any open or pending special assessments — roof, HVAC, plumbing, elevator, façade? What's the per-unit balance and payoff schedule, and is the seller paying it off at close or rolling it to the buyer?
- Is there a deadline driving the sale (1031 exchange, divorce, estate, relocation)? That informs how much negotiation room exists.
- What's the average days-on-market for RENTAL listings here right now (not sales)? A rising rental-DOM trend means longer vacancies and softer asking-rent achievability than the comps imply.
- What's the recent tenant-quality profile in this submarket — average credit score on applications, eviction rate, late-payment / NSF rate, and stable-employment percentage? A property-management company in the area should have these aggregated.
- How much new apartment / multifamily construction is in the pipeline within 1–3 miles? Heavy new supply (>2% of stock underway) typically softens rents 12–24 months out; light construction supports rent growth.
Investment metrics
- 1% rule
- 1.29% ✓
- Cap rate
- 10.25%
- Cash-on-cash
- 14.13%
- DSCR
- 1.63
- GRM
- 6.4
CMA / ARV
- ARV (median comp)
- $194,668
- List price
- $185,000
- Delta
- -4.97%
- Verdict
- FAIR
- Comps
- 20 within 1.0 mi
Projected returns pro-forma
-3.0% appreciation · 3.0% rent growth · sell at horizon
- IRR
- 4.4%
- Equity multiple
- 1.17×
- Total profit
- $8,898
- Equity at exit
- $27,584
- IRR
- 13.9%
- Equity multiple
- 2.12×
- Total profit
- $57,907
- Equity at exit
- $15,995
Cash invested: $51,800 (down + closing). Projections, not guarantees.
Landlord ↔ Tenant lean methodology
- Overall (CITY)
- 5 Strongly Tenant-Friendly
- State New York
- 15 Strongly Tenant-Friendly · D+10
- County
- — inherits STATE
- City Yonkers
- 5 Strongly Tenant-Friendly · D+20
ZIP-level market 10703
- Home prices YoY
- -13.2%
- Active inventory
- 75
- Price-to-rent
- 6.4×
Monthly cashflow live
- Estimated rent
- $2,390 high interval (Pro) →
- Mortgage (P&I)
- −$970
- Tax est. 1.5%
- −$231 /mo · $2,775/yr
- Insurance
- −$77
- HOA
- −$0
- Vacancy / Maint / Mgmt
- −$502
- Net cashflow
- $610
Break-even live
UW: 25.0% down · 7.5% · 30yr · 1.5% tax · 5.0% vac · 8.0% maint · 8.0% mgmt
Financing live
Cash to close
- Down payment
- $46,250
- Closing costs
- $5,550
- Reserves months
- —
- Total cash needed
- —
Loan-product check · same deal, 3 products live
Conventional
25% down · 7.5% · 30yr
- Down + closing
- —
- Monthly P&I
- —
- Monthly cashflow
- —
- DSCR
- —
- Eligible?
- —
Personal DTI + credit; lowest rate.
DSCR
20% down · 8.5% · 30yr
- Down + closing
- —
- Monthly P&I
- —
- Monthly cashflow
- —
- DSCR
- —
- Eligible?
- —
No personal income docs; deal must DSCR.
Hard money
10% down · 12.0% · 12mo
- Down + closing
- —
- Monthly P&I
- —
- Monthly cashflow
- —
- DSCR
- —
- Eligible?
- —
Short-term bridge; refi at stabilization.
Rent comps 16 comps
| Address | Beds | Baths | Sqft | Rent | $/sqft | DOM | Units | Dist |
|---|---|---|---|---|---|---|---|---|
| 7 Corbalis Pl Yonkers, NY | 2.0 | 1.0 | 900 | $2,500 | $2.78 | 43d | 1 | 0.26mi |
| 703 Palisade Ave Unit Third Floor Yonkers, NY | 2.0 | 1.0 | 900 | $2,000 | $2.22 | 3d | 1 | 0.57mi |
| 737 Warburton Ave Unit 1L Yonkers, NY | 1.0 | 1.0 | 900 | $2,100 | $2.33 | 43d | 1 | 0.65mi |
| 1133 Warburton Ave Yonkers, NY | 2.0 | 1.0–2.0 | 827 | $3,375 | $4.08 | 2d | 7 | 0.71mi |
| 160 Amackassin Ter Yonkers, NY | 1.0 | 1.0 | 600 | $1,500 | $2.50 | 43d | 1 | 0.80mi |
| 23 Belknap Ave Yonkers, NY | 1.0 | 1.0 | 700 | $2,300 | $3.29 | 24d | 1 | 0.92mi |
| 596 Warburton Ave Yonkers, NY | 1.0 | 1.0 | 650 | $1,800 | $2.77 | 24d | 1 | 0.93mi |
| 237 Woodland Ave Unit 2 Yonkers, NY | 2.0 | 1.0 | 970 | $2,600 | $2.68 | 43d | 1 | 0.99mi |
| 103 Burhans Ave Yonkers, NY | 2.0 | 1.0 | 894 | $2,000 | $2.24 | 43d | 1 | 1.01mi |
| 703 Nepperhan Ave Unit 2 Yonkers, NY | 2.0 | 1.0 | 850 | $2,450 | $2.88 | 43d | 1 | 1.08mi |
| 23 Colin St Yonkers, NY | 2.0 | 1.0 | 750 | $2,500 | $3.33 | 15d | 1 | 1.18mi |
| 601 Ridge Hill Blvd Yonkers, NY | 2.0 | 1.0–2.0 | 819 | $3,500 | $4.27 | 7d | 14 | 1.22mi |
| 137 Lake Ave Unit 3W Yonkers, NY | 1.0 | 1.0 | 650 | $1,700 | $2.62 | 19d | 1 | 1.27mi |
| 59 Glenwood Ave Unit 1FF Yonkers, NY | 2.0 | 1.0 | 700 | $2,375 | $3.39 | 43d | 1 | 1.37mi |
| 369 Warburton Ave Unit 2B Yonkers, NY | 2.0 | 1.0 | 930 | $2,650 | $2.85 | 43d | 1 | 1.40mi |
| 150 Glenwood Ave Apt G1 Yonkers, NY | 1.0 | 1.0 | 850 | $2,000 | $2.35 | 43d | 1 | 1.41mi |
HOA detail condo
- Monthly dues
- $0 · $0/yr
- Likely covers
- parking
- Assessments
- None detected in remarks — confirm with the listing agent.
Listing history 15 events
-
2026-06-18days on market $185,000 Active 52 DOM
-
2026-06-17days on market $185,000 Active 51 DOM
-
2026-06-16days on market $185,000 Active 50 DOM
-
2026-06-15days on market $185,000 Active 49 DOM
-
2026-06-13days on market $185,000 Active 47 DOM
-
2026-06-09days on market $185,000 Active 43 DOM
-
2026-06-08days on market $185,000 Active 42 DOM
-
2026-06-07days on market $185,000 Active 41 DOM
-
2026-06-04days on market $185,000 Active 38 DOM
-
2026-06-03days on market $185,000 Active 37 DOM
-
2026-06-02days on market $185,000 Active 36 DOM
-
2026-06-01days on market $185,000 Active 35 DOM
-
2026-05-31days on market $185,000 Active 34 DOM
-
2026-05-04status Active
-
2026-04-11$185,000 Active
ⓘ Source: listings_history table (triggers on properties + properties_extension) + one-shot
backfill from property_details.listing_events for pre-trigger history.
Climate risk First Street
- Flood 1/10 Low FEMA zone X (unshaded) · 0% chance over 30 yrs
- Wildfire 3/10 Moderate
- Heat 5/10 Major 7 d/yr ≥99°F today · 15 d/yr by 30 yrs out
- Wind 6/10 Major 27% chance of damaging wind over 30 yrs
- Air quality 4/10 Moderate 4 unhealthy d/yr today · 6 by 30 yrs out
Nearby sold comps map
Loading sold comps map…
Walkable amenities ~0.75 mi
Loading nearby amenities…
Taxation est. · year 1
- Rental income
- $28,683
- − Mortgage interest
- −$10,363
- − Property taxes
- −$2,775
- − Insurance
- −$925
- − Repairs & maintenance
- −$2,295
- − Management
- −$2,295
- − Depreciation
- −$5,382
- Taxable income
- $4,649
- Est. tax owed @ 24.0%
- −$1,116
- After-tax cash flow
- $6,202/yr
For passive investors: Depreciation is non-cash, so a rental often shows a tax loss while cash-flowing — sheltering income. Rental losses are passive: they offset passive income freely, and up to $25,000/yr can offset ordinary (W-2) income if you actively participate and your MAGI is under $100k (phasing out to $0 by $150k); unused losses carry forward. On sale, claimed depreciation is recaptured at up to 25%, and gains may owe capital-gains tax (a 1031 exchange can defer both). Figures are a year-1 estimate at your 24.0% rate — not tax advice; consult a CPA.
Condition & rehab AI · 12 photos
The property requires moderate renovations, focusing on updating the kitchen and bathrooms, and freshening the paint and flooring. This would significantly enhance its resale and rental value.
Repairs flagged
- Minor Kitchen cabinets — Slight wear
- Minor Kitchen appliances — Standard, dated models
- Minor Bathroom fixtures — Standard, dated models
- Minor Paint — Some scuff marks
Value-add opportunities
- Both Paint job — Fresh paint enhances curb appeal and interior
- Both New flooring — New hardwood floors improve aesthetics and value
- Both Kitchen appliances — Modern appliances increase appeal and functionality
- Both Bathroom fixtures — Updated fixtures improve functionality and aesthetics
Renovation cost estimate screening
| Repair item | Severity | Est. cost |
|---|---|---|
| Kitchen cabinets · Slight wear | Minor | $500–3,000 |
| Kitchen appliances · Standard, dated models | Minor | $500–3,000 |
| Bathroom fixtures · Standard, dated models | Minor | $500–3,000 |
| Paint · Some scuff marks | Minor | $500–3,000 |
| Total estimated repair cost · 4 items | $2,000–12,000 |
Value-add ROI direction
- Both Paint job — Fresh paint enhances curb appeal and interior ↑
- Both New flooring — New hardwood floors improve aesthetics and value ↑
- Both Kitchen appliances — Modern appliances increase appeal and functionality ↑
- Both Bathroom fixtures — Updated fixtures improve functionality and aesthetics ↑
ⓘ Cost ranges are severity-bucket heuristics (US national rule-of-thumb). Get contractor quotes + a written scope before underwriting a rehab budget.
Schools (NCES district)
- District
- Yonkers City School District
- NCES district ID
- 3631920
- Math proficiency
- 41% ▼ -1.00%
- Reading proficiency
- 54% ▲ 14.00%
- Median HH income
- $58,042
- Composite
- 41.43/100
- National rank
- #3471
- State rank
- #413 of 590 in NY
Livability — Yonkers
- Score
- 68/100
- State rank
- #528
- US rank
- #9394
Category grades
Schools grade is shown separately in the Schools card above.
Census & demographics
- Census place
- Yonkers, NY
- County
- Westchester County · 709,332 people
- City population
- 212,407
- Metro
- New York-Newark-Jersey City, NY-NJ-PA
- Population (ZIP)
- 22,586
- Household income
- $89,773
- Rent vs Own
- Severe rent burden
- 1216.0
Population outlook (Westchester County) Hauer SSP2
- Today (2025)
- 1,028,035 people
- By 2030
- 1,051,636 · +2.3%
- By 2040
- 1,098,520 · +6.9%
- By 2050
- 1,136,044 · +10.5%
- By 2075
- 1,196,925 · +16.4%
- By 2100
- 1,175,147 · +14.3%
Race, ethnicity, and origin ACS 2023
- Neighborhood character
- Diverse neighborhood (Simpson 0.69)
- Race & ethnicity
- Hispanic / Latino 43% White 30% Black 19% Two or more races 16% Asian 5%
- Hispanic origin (detail)
- Mexican 5% Puerto Rican 9% Dominican 13%
- Common ancestry
- Romanian 4% Russian 2% Subsaharan African 1%
- Foreign-born
- 32% · Canada, Jamaica, China
- Languages at home
- 50% English-only · Spanish 37% Other Indo-European 5% Russian/Polish/Slavic 2%
Political lean MEDSL · Westchester
- 2024 margin
- Strong D (+26.3) · D 63.1% · R 36.9%
- 2008→2024 swing
- -1.3pp toward R · 2008: 27.6pp · 2024: 26.3pp
- All cycles
- 2024: D+26.3 2020: D+36.3 2016: D+32.8 2012: D+22.2 2008: D+27.6
Not yet ingested
- Civics
- —
Market trends
- HPI YoY
- ▼ -47.22%
- Current HPI
- 311.0396
- Rent YoY
- —
- Metro
- New York-Newark-Jersey City, NY-NJ-PA
- State GDP YoY
- ▲ 2.60%
- F500 in state
- 92
Industry mix (Fortune 500 HQ in NY)
| Industry | F500 HQs | Revenue |
|---|---|---|
| Financial Services | 10 | $950B |
|
||
| Consumer Goods | 9 | $162B |
|
||
| Insurance | 4 | $225B |
|
||
| Telecommunications | 2 | $144B |
|
||
| Pharmaceuticals | 2 | $112B |
|
||
| Media / Entertainment | 2 | $69B |
|
||
Price history
2 events — show timeline
- 2026-05-04 Relisted — OneKey® MLS as Distributed by MLS Grid
- 2026-04-11 Listed $185,000 OneKey® MLS as Distributed by MLS Grid
Cash-flow waterfall
monthlySold comps — $/sqft
last 12 mo · ≤1 miLoading sold comps…