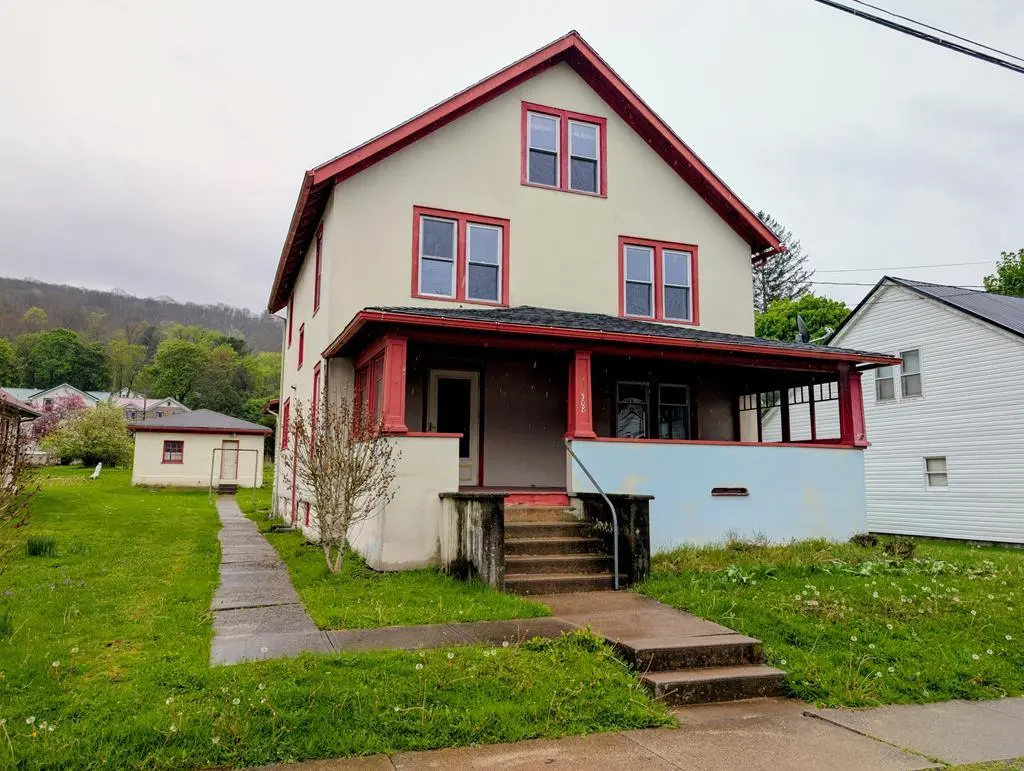
308 Williams St · Tionesta, PA
Flood risk 9/10 · Severe
- FEMA flood zone
- X (unshaded)
- Chance of flooding over 30 yrs
- 0.99%
- Est. flood insurance / yr
- $473 – $860
Fire risk 1/10 · Minimal
- Est. fire insurance / yr
- $511 – $949
Heat risk 3/10 · Minor
- Hot days now (above 92°F)
- 8 days/yr
- Hot days in 30 yrs
- 20 days/yr
Wind risk 1/10 · Minimal
- Chance of severe wind over 30 yrs
- —
Air-quality risk 2/10 · Minimal
- Unhealthy air days now
- 0 days/yr
- Unhealthy air days in 30 yrs
- 1 days/yr
Risk factors via First Street. Map © Google.
Why this score? — see what drove the B- grade
The composite is a weighted blend of 9 inputs, each scored 0–100. Each bar is that input's sub-score; the figure is the points it added to the 100-point composite (weight × sub-score).
- Cash flow +26.3/30.0
- DSCR +8.9/10.0
- Appreciation +7.9/10.0
- 1% rule +6.7/10.0
- ARV discount +6.1/15.0
- Schools +4.4/10.0
- Livability +3.4/5.0
- Rent growth +2.5/5.0
- Condition / age +2.5/5.0
$105,000
🖨 Deal sheet (PDF) 📄 Offer letter ✓ Due diligence
Listing remarks
Located in town for everyday convenience, this spacious home offers public water and sewer along with larger-than-expected room sizes throughout. The interior provides a solid layout with plenty of space to work with, making it a great opportunity for buyers looking to update and personalize a home to their style. An easily accessible attic room adds additional potential for living space, office, or storage. With its in-town setting, you'll enjoy close proximity to local amenities while having the chance to create value with the right improvements. Whether you're looking for a primary residence, rental, or project property, this home offers a strong foundation and room to grow.
Key facts
- Public sewer
- Strong foundation
- Attic room
Tags
Property features AI
Exterior
- Parking: Detached garage (1 garage space); 1 covered parking space (1 total parking space)
- Utilities: Public water; Public sewer; 100 amp electric service; Natural gas connected/available
- Home design: Residential property; Two-story
- Construction: Frame construction; Other construction materials; Full basement; Built on a composition roof
- Exterior features: Front porch; Composition roof
Interior
- Kitchen: Range
- Bathrooms: 1 full bathroom; 1 half bathroom
- Heating & cooling: Forced air heating; Cooling system present (no central cooling specified)
- Interior features: Gas water heater; Range (gas or electric)
Neighborhood map
What this means for you Summary
Snapshot
- This is a 3-bed/1.5-bath other listed at $105k.
Deal economics
- At list price, monthly cash flow is $217 ($3k/yr) — positive.
- The deal already cash-flows at list — no discount required.
- Meets the 1% rule at list price ($1k rent vs $105k).
- Recommended offer: $102k (3.0% below list) — sets the bar for market timing.
Location & tenants
- Location reads 67/100 on livability (#924 in PA) — a middle-class / working-renter tenant base. Strengths: cost of living A+, health & safety A+, housing A-; Watch: employment D, amenities F, commute F.
- Forest Area SD (rural): math 41% / reading 59% proficiency, ranked #415 of 658 in PA (top 63%) — acceptable for families but not a draw, mixed tenant base, ~2y average lease.
- Market conditions: 28 active listings in the ZIP; 6 units permitted in Forest County in 2024 (0 in 5+ unit buildings).
Forward outlook
- In year one you build about $7k of equity ($726 loan paydown + $6k appreciation (5.9% local appreciation)).
- Forest County population projected to shrink 5% by 2050 — rents likely to lag national; underwrite the cash flow, not the appreciation.
- At projected returns (5.9% appreciation + 3.0% rent growth), your $29k cash investment doubles in ~3 years — after that, you're playing with house money.
- By year 5, paydown + projected appreciation supports a ~$30k cash-out refi (75% LTV) — recoverable capital for the next deal without selling this one.
Negotiation context
- It's been on market 49 days — a 3% lower offer ($102k) is reasonable based on typical stale-listing flexibility.
Risks & watch-outs
- Watch-outs: flood insurance adds $56/mo.
- Climate carrying-cost: severe flood risk — expect insurance premiums to compound above CPI over the hold.
Questions for the listing agent
- It's been on market 49 days. Have you received any prior offers? Is the seller open to a 3% concession, seller financing, or rate buy-down credit?
- What's the actual annual flood-insurance premium (NFIP or private), and is the property in a SFHA with mandatory coverage?
- Is there a deadline driving the sale (1031 exchange, divorce, estate, relocation)? That informs how much negotiation room exists.
- Schools are B-rated — typically a magnet for longer-tenancy family renters. What's the average tenant stay here, and is there a school-zone premium baked into asking?
- What's the average days-on-market for RENTAL listings here right now (not sales)? A rising rental-DOM trend means longer vacancies and softer asking-rent achievability than the comps imply.
- What's the recent tenant-quality profile in this submarket — average credit score on applications, eviction rate, late-payment / NSF rate, and stable-employment percentage? A property-management company in the area should have these aggregated.
- How much new for-sale + rental construction is in the pipeline within 1–3 miles? Heavy new supply typically softens prices + rents 12–24 months out; constrained supply supports both.
Investment metrics
- 1% rule
- 1.17% ✓
- Cap rate
- 9.40%
- Cash-on-cash
- 11.11%
- DSCR
- 1.49
- GRM
- 7.1
CMA / ARV
- ARV (median comp)
- $101,844
- List price
- $105,000
- Delta
- 3.10%
- Verdict
- FAIR
- Comps
- 7 within 1.0 mi
Projected returns pro-forma
5.89% appreciation · 3.0% rent growth · sell at horizon
- IRR
- 22.4%
- Equity multiple
- 2.48×
- Total profit
- $43,466
- Equity at exit
- $65,281
- IRR
- 21.4%
- Equity multiple
- 4.99×
- Total profit
- $117,309
- Equity at exit
- $117,763
Cash invested: $29,400 (down + closing). Projections, not guarantees.
Landlord ↔ Tenant lean methodology
- Overall (STATE)
- 62 Landlord-Friendly
- State Pennsylvania
- 62 Landlord-Friendly · EVEN
- County
- — inherits STATE
- City
- — inherits STATE
ZIP-level market 16353
- Home prices YoY
- 4.2%
- Active inventory
- 28
- Price-to-rent
- 7.1×
Monthly cashflow live
- Estimated rent
- $1,232 medium interval (Pro) →
- Mortgage (P&I)
- −$551
- Tax from tax record
- −$107 /mo · $1,279/yr
- Insurance
- −$44
- Flood insurance flood zone
- −$56 /mo · $666/yr
- HOA
- −$0
- Vacancy / Maint / Mgmt
- −$259
- Net cashflow
- $217
Break-even live
Sensitivity live
| Price | -10% $276 | -5% $246 | +0% $217 | +5% $187 | +10% $157 |
|---|---|---|---|---|---|
| Rent | -10% $119 | -5% $168 | +0% $217 | +5% $265 | +10% $314 |
| Rate | -1.0pp $269 | -0.5pp $243 | base $217 | +0.5pp $189 | +1.0pp $162 |
UW: 25.0% down · 7.5% · 30yr · 1.5% tax · 5.0% vac · 8.0% maint · 8.0% mgmt
Financing live
Cash to close
- Down payment
- $26,250
- Closing costs
- $3,150
- Reserves months
- —
- Total cash needed
- —
Loan-product check · same deal, 3 products live
Conventional
25% down · 7.5% · 30yr
- Down + closing
- —
- Monthly P&I
- —
- Monthly cashflow
- —
- DSCR
- —
- Eligible?
- —
Personal DTI + credit; lowest rate.
DSCR
20% down · 8.5% · 30yr
- Down + closing
- —
- Monthly P&I
- —
- Monthly cashflow
- —
- DSCR
- —
- Eligible?
- —
No personal income docs; deal must DSCR.
Hard money
10% down · 12.0% · 12mo
- Down + closing
- —
- Monthly P&I
- —
- Monthly cashflow
- —
- DSCR
- —
- Eligible?
- —
Short-term bridge; refi at stabilization.
Listing history 16 events
-
2026-06-21days on market $105,000 Active 49 DOM
-
2026-06-18days on market $105,000 Active 47 DOM
-
2026-06-17days on market $105,000 Active 46 DOM
-
2026-06-16days on market $105,000 Active 45 DOM
-
2026-06-15days on market $105,000 Active 44 DOM
-
2026-06-13days on market $105,000 Active 42 DOM
-
2026-06-12days on market $105,000 Active 41 DOM
-
2026-06-09days on market $105,000 Active 38 DOM
-
2026-06-08days on market $105,000 Active 37 DOM
-
2026-06-08days on market $105,000 Active 36 DOM
-
2026-06-07days on market $105,000 Active 35 DOM
-
2026-06-04days on market $105,000 Active 32 DOM
-
2026-06-02days on market $105,000 Active 31 DOM
-
2026-06-01days on market $105,000 Active 30 DOM
-
2026-05-31days on market $105,000 Active 29 DOM
-
2026-05-02$105,000 Active 686-char remark
ⓘ Source: listings_history table (triggers on properties + properties_extension) + one-shot
backfill from property_details.listing_events for pre-trigger history.
Tax reassessment forecast PA · Partial reset (capped growth)
- Current annual tax
- $1,279 · $107/mo
- Projected year-2 tax
- $1,469 · $122/mo
- Expected delta
- +$190/yr (+$16/mo · 14.9%)
ⓘ Screening estimate from a state-policy table — verify with the county assessor before closing.
Climate risk First Street
- Flood 9/10 Extreme FEMA zone X (unshaded) · 99% chance over 30 yrs
- Wildfire 1/10 Low
- Heat 3/10 Moderate 8 d/yr ≥92°F today · 20 d/yr by 30 yrs out
- Wind 1/10 Low
- Air quality 2/10 Low 0 unhealthy d/yr today · 1 by 30 yrs out
Nearby sold comps map
Loading sold comps map…
Walkable amenities ~0.75 mi
Loading nearby amenities…
Taxation est. · year 1
- Rental income
- $14,781
- − Mortgage interest
- −$5,882
- − Property taxes
- −$1,279
- − Insurance
- −$1,192
- − Repairs & maintenance
- −$1,183
- − Management
- −$1,183
- − Depreciation
- −$3,055
- Taxable income
- $1,010
- Est. tax owed @ 24.0%
- −$242
- After-tax cash flow
- $2,357/yr
For passive investors: Depreciation is non-cash, so a rental often shows a tax loss while cash-flowing — sheltering income. Rental losses are passive: they offset passive income freely, and up to $25,000/yr can offset ordinary (W-2) income if you actively participate and your MAGI is under $100k (phasing out to $0 by $150k); unused losses carry forward. On sale, claimed depreciation is recaptured at up to 25%, and gains may owe capital-gains tax (a 1031 exchange can defer both). Figures are a year-1 estimate at your 24.0% rate — not tax advice; consult a CPA.
Schools (NCES district)
- District
- Forest Area SD
- NCES district ID
- 4208280
- Math proficiency
- 41% ▲ 4.00%
- Reading proficiency
- 59% ▲ 3.00%
- Median HH income
- $37,002
- Composite
- 43.52/100
- National rank
- #6452
- State rank
- #415 of 658 in PA
Livability — Tionesta
- Score
- 67/100
- State rank
- #924
- US rank
- #10230
Category grades
Schools grade is shown separately in the Schools card above.
Census & demographics
- Census place
- Tionesta, PA
- Population (ZIP)
- 2,459
Population outlook (Forest County) Hauer SSP2
- Today (2025)
- 7,354 people
- By 2030
- 7,340 · -0.2%
- By 2040
- 7,255 · -1.3%
- By 2050
- 6,992 · -4.9%
- By 2075
- 5,878 · -20.1%
- By 2100
- 4,869 · -33.8%
Race, ethnicity, and origin ACS 2023
- Neighborhood character
- Predominantly White (98%)
- Race & ethnicity
- White 98% Two or more races 1%
- Common ancestry
- Romanian 5% Lithuanian 2% Iranian 2%
- Foreign-born
- 1%
- Languages at home
- 96% English-only · German/W. Germanic 4%
Political lean MEDSL · Forest
- 2024 margin
- Solid R (+44.5) · D 27.3% · R 71.8%
- 2008→2024 swing
- -31.0pp toward R · 2008: -13.4pp · 2024: -44.5pp
- All cycles
- 2024: R+44.5 2020: R+43.6 2016: R+44.0 2012: R+21.1 2008: R+13.4
Not yet ingested
- Civics
- —
Market trends
- HPI YoY
- ▲ 5.89%
- Current HPI
- 146.6533
- Rent YoY
- —
- Metro
- —
- State GDP YoY
- ▲ 1.68%
- F500 in state
- 34
Industry mix (Fortune 500 HQ in PA)
| Industry | F500 HQs | Revenue |
|---|---|---|
| Healthcare | 2 | $309B |
|
||
| Insurance | 2 | $27B |
|
||
| Telecommunications / Media | 1 | $124B |
|
||
| Industrial Distribution | 1 | $22B |
|
||
| Financial Services | 1 | $20B |
|
||
| Chemicals / Materials | 1 | $18B |
|
||
Price history
1 event — show timeline
- 2026-05-02 Listed $105,000 AVBREALTORS
Property tax history
+2.0%/yrLatest (2026): $1,279 · +3.6% YoY. Source: county tax records.
Cash-flow waterfall
monthlySold comps — $/sqft
last 12 mo · ≤1 miLoading sold comps…