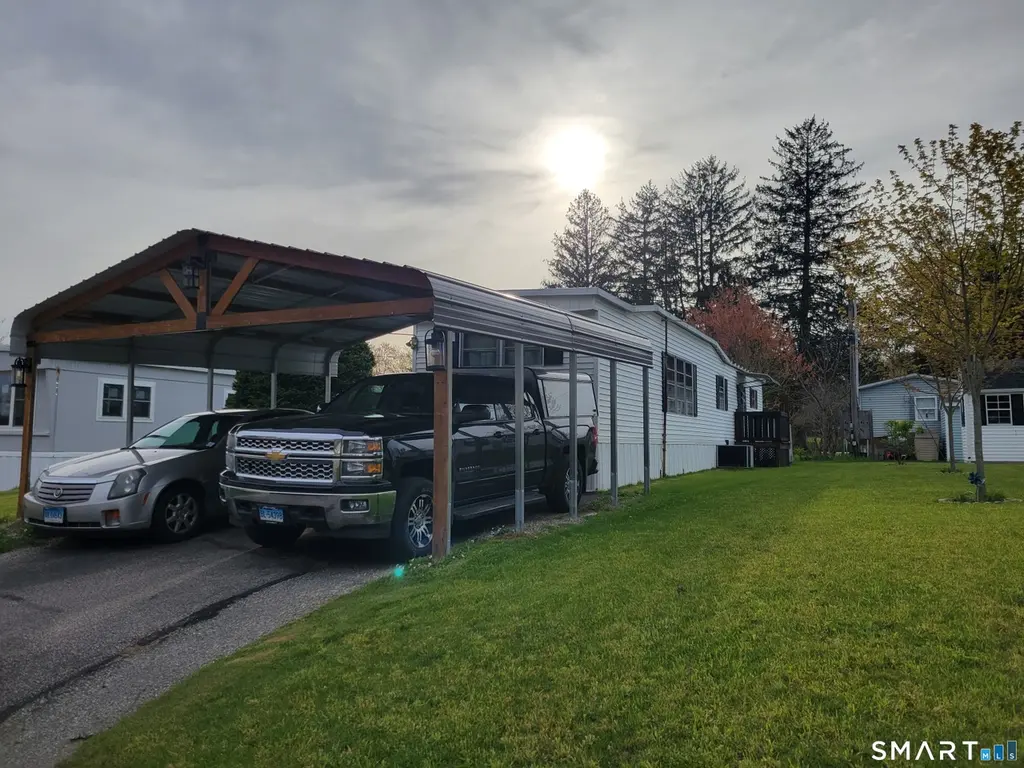
80 Sheldon Rd Lot 12 · Griswold, CT
Flood risk 1/10 · Minimal
- FEMA flood zone
- X (unshaded)
- Chance of flooding over 30 yrs
- 0.0%
- Est. flood insurance / yr
- $507 – $1,088
Fire risk 2/10 · Minimal
- Est. fire insurance / yr
- $829 – $1,539
Heat risk 4/10 · Minor
- Hot days now (above 95°F)
- 7 days/yr
- Hot days in 30 yrs
- 16 days/yr
Wind risk 6/10 · Moderate
- Chance of severe wind over 30 yrs
- 77.0%
Air-quality risk 3/10 · Minor
- Unhealthy air days now
- 2 days/yr
- Unhealthy air days in 30 yrs
- 3 days/yr
Risk factors via First Street. Map © Google.
Why this score? — see what drove the C+ grade
The composite is a weighted blend of 9 inputs, each scored 0–100. Each bar is that input's sub-score; the figure is the points it added to the 100-point composite (weight × sub-score).
- Cash flow +27.3/30.0
- DSCR +9.5/10.0
- ARV discount +7.1/15.0
- 1% rule +6.1/10.0
- Schools +3.2/10.0
- Rent growth +2.5/5.0
- Livability +2.5/5.0
- Condition / age +2.5/5.0
- Appreciation +0.0/10.0
$140,000
🖨 Deal sheet 📄 Offer letter ✓ Due diligence
Listing remarks
Back on the market. This charming manufactured home is located only 1 minute to the water. Enjoy swimming, boating, and fishing. Included are front and rear bedrooms, 1 1/2 baths, an open floor plan and so much more. All appliances are included including central air. Main entry is through and enclosed 3 season porch which also leads to a really nice pack yard. Rear deck, trellaced sitting are and also a lounge for it's own firepit. Land is is $625 includes water, septic and trash. Paark application is attached.
Key facts
- Lounge for firepit
- Rear deck
- Nice back yard
Tags
Property features AI
Finance
- HOA & community: Located in Griswold Mobile Home Park
Exterior
- Parking: Carport; Off-street parking; 2 garage spaces (total parking for 2)
- Utilities: Private water system; Septic system; Above-ground fuel tank; Storm doors (energy feature)
- Home design: Single-family home; On leased land; Prefab construction; White exterior
- Construction: Metal roof; Vinyl siding; No basement; Foundation: None
- Exterior features: Enclosed porch; Open porch; Covered deck; Deck; Patio; Awnings; Sidewalk; Shed; Walk-to-water access
Interior
- Kitchen: Oven/Range; Range hood; Refrigerator
- Bedrooms: 2 bedrooms
- Bathrooms: 1 full bathroom; 1 half bathroom
- Heating & cooling: Central air; Hot air heating (kerosene fuel); 30-gallon electric hot water tank
- Interior features: Pre-wired for cable; Open floor plan
- Laundry & utility: Washer and dryer located in the full bathroom on the main level
Neighborhood map
What this means for you Summary
Snapshot
- This is a 2-bed/1.5-bath manufactured listed at $140k.
Deal economics
- At list price, monthly cash flow is $407 ($5k/yr) — positive.
- The deal already cash-flows at list — no discount required.
- Meets the 1% rule at list price ($2k rent vs $140k).
- Recommended offer: $136k (3.0% below list) — sets the bar for market timing.
Location & tenants
- Location reads: area grade C — affects rentability + tenant quality, not the cash-flow math above.
- Griswold School District (rural): math 29% / reading 42% proficiency, ranked #111 of 153 in CT (top 72%) — families likely to look elsewhere, expect single-tenant / working-renter base with shorter leases.
- Zoned schools: Griswold High School (math 32% / reading 47%, grade F, #107 of 194 statewide, top 56%, 533 students, 46% FRL) — zoned schools average 46% FRL vs 31% district-wide (16 pts higher); higher-poverty schools than district average — tighter screening recommended.
- Market conditions: 75 active listings in the ZIP; 487 units permitted in Southeastern Connecticut Planning Region in 2024 (244 in 5+ unit buildings).
Forward outlook
- Local home prices are declining (-3.0%/yr); year-one equity from $968 of loan paydown is wiped out by about $4k of value loss. Plan a longer hold.
- At projected returns (-3.0% appreciation + 3.0% rent growth), your $39k cash investment doubles in ~10 years — after that, you're playing with house money.
Negotiation context
- It's been on market 50 days — a 3% lower offer ($136k) is reasonable based on typical stale-listing flexibility.
- 4 sale attempts with the ask held roughly flat each time — persistent listings suggest the price (not the market) is what's stuck; bring a comps-based counter.
Risks & watch-outs
- Climate carrying-cost: major wind risk, 77% chance of damaging wind over 30y — expect insurance premiums to compound above CPI over the hold.
Questions for the listing agent
- It's been on market 50 days. Have you received any prior offers? Is the seller open to a 3% concession, seller financing, or rate buy-down credit?
- Built in 1969 — when were the roof, HVAC, electrical panel, plumbing, and water heater last replaced?
- Is there a deadline driving the sale (1031 exchange, divorce, estate, relocation)? That informs how much negotiation room exists.
- What's the average days-on-market for RENTAL listings here right now (not sales)? A rising rental-DOM trend means longer vacancies and softer asking-rent achievability than the comps imply.
- What's the recent tenant-quality profile in this submarket — average credit score on applications, eviction rate, late-payment / NSF rate, and stable-employment percentage? A property-management company in the area should have these aggregated.
- How much new for-sale + rental construction is in the pipeline within 1–3 miles? Heavy new supply typically softens prices + rents 12–24 months out; constrained supply supports both.
Investment metrics
- 1% rule
- 1.11% ✓
- Cap rate
- 9.78%
- Cash-on-cash
- 12.46%
- DSCR
- 1.55
- GRM
- 7.5
CMA / ARV
- ARV (median comp)
- $138,623
- List price
- $140,000
- Delta
- 0.99%
- Verdict
- FAIR
- Comps
- 20 within 1.0 mi
Projected returns pro-forma
-3.0% appreciation · 3.0% rent growth · sell at horizon
- IRR
- 2.1%
- Equity multiple
- 1.08×
- Total profit
- $3,178
- Equity at exit
- $20,874
- IRR
- 11.7%
- Equity multiple
- 1.92×
- Total profit
- $35,892
- Equity at exit
- $12,105
Cash invested: $39,200 (down + closing). Projections, not guarantees.
Landlord ↔ Tenant lean methodology
- Overall (STATE)
- 27 Tenant-Leaning
- State Connecticut
- 27 Tenant-Leaning · D+7
- County
- — inherits STATE
- City
- — inherits STATE
ZIP-level market 06351
- Home prices YoY
- -22.8%
- Active inventory
- 75
- Price-to-rent
- 7.5×
Monthly cashflow live
- Estimated rent
- $1,558 medium interval (Pro) →
- Mortgage (P&I)
- −$734
- Tax from tax record
- −$31 /mo · $377/yr
- Insurance
- −$58
- HOA
- −$0
- Vacancy / Maint / Mgmt
- −$327
- Net cashflow
- $407
Break-even live
UW: 25.0% down · 7.5% · 30yr · 1.5% tax · 5.0% vac · 8.0% maint · 8.0% mgmt
Financing live
Cash to close
- Down payment
- $35,000
- Closing costs
- $4,200
- Reserves months
- —
- Total cash needed
- —
Loan-product check · same deal, 3 products live
Conventional
25% down · 7.5% · 30yr
- Down + closing
- —
- Monthly P&I
- —
- Monthly cashflow
- —
- DSCR
- —
- Eligible?
- —
Personal DTI + credit; lowest rate.
DSCR
20% down · 8.5% · 30yr
- Down + closing
- —
- Monthly P&I
- —
- Monthly cashflow
- —
- DSCR
- —
- Eligible?
- —
No personal income docs; deal must DSCR.
Hard money
10% down · 12.0% · 12mo
- Down + closing
- —
- Monthly P&I
- —
- Monthly cashflow
- —
- DSCR
- —
- Eligible?
- —
Short-term bridge; refi at stabilization.
Listing history 26 events
-
2026-06-18days on market $140,000 Active 50 DOM
-
2026-06-17days on market $140,000 Active 49 DOM
-
2026-06-16days on market $140,000 Active 48 DOM
-
2026-06-15days on market $140,000 Active 47 DOM
-
2026-06-13days on market $140,000 Active 45 DOM
-
2026-06-12days on market $140,000 Active 44 DOM
-
2026-06-09days on market $140,000 Active 41 DOM
-
2026-06-08days on market $140,000 Active 40 DOM
-
2026-06-07days on market $140,000 Active 39 DOM
-
2026-06-07days on market $140,000 Active 38 DOM
-
2026-06-04days on market $140,000 Active 35 DOM
-
2026-06-02days on market $140,000 Active 34 DOM
-
2026-06-01days on market $140,000 Active 33 DOM
-
2026-05-31days on market $140,000 Active 32 DOM
-
2026-05-31days on market $140,000 Active 31 DOM
-
2026-04-29$140,000 Active 516-char remark
-
2026-01-02historical
-
2025-10-01price $139,900
-
2025-08-02$149,900 Active
-
2025-08-01historical
-
2025-07-08historical
-
2025-07-08$158,000 Active
-
2025-06-24price $158,000
-
2025-06-23price $150,000
-
2025-06-18price $168,000
-
2025-06-05$184,900 Active
ⓘ Source: listings_history table (triggers on properties + properties_extension) + one-shot
backfill from property_details.listing_events for pre-trigger history.
Tax reassessment forecast CT · Partial reset (capped growth)
- Current annual tax
- $377 · $31/mo
- Projected year-2 tax
- $1,686 · $141/mo
- Expected delta
- +$1,310/yr (+$109/mo · 347.3%)
ⓘ Screening estimate from a state-policy table — verify with the county assessor before closing.
Climate risk First Street
- Flood 1/10 Low FEMA zone X (unshaded) · 0% chance over 30 yrs
- Wildfire 2/10 Low
- Heat 4/10 Moderate 7 d/yr ≥95°F today · 16 d/yr by 30 yrs out
- Wind 6/10 Major 77% chance of damaging wind over 30 yrs
- Air quality 3/10 Moderate 2 unhealthy d/yr today · 3 by 30 yrs out
Nearby sold comps map
Loading sold comps map…
Walkable amenities ~0.75 mi
Loading nearby amenities…
Taxation est. · year 1
- Rental income
- $18,699
- − Mortgage interest
- −$7,842
- − Property taxes
- −$377
- − Insurance
- −$700
- − Repairs & maintenance
- −$1,496
- − Management
- −$1,496
- − Depreciation
- −$4,073
- Taxable income
- $2,715
- Est. tax owed @ 24.0%
- −$652
- After-tax cash flow
- $4,234/yr
For passive investors: Depreciation is non-cash, so a rental often shows a tax loss while cash-flowing — sheltering income. Rental losses are passive: they offset passive income freely, and up to $25,000/yr can offset ordinary (W-2) income if you actively participate and your MAGI is under $100k (phasing out to $0 by $150k); unused losses carry forward. On sale, claimed depreciation is recaptured at up to 25%, and gains may owe capital-gains tax (a 1031 exchange can defer both). Figures are a year-1 estimate at your 24.0% rate — not tax advice; consult a CPA.
Schools (NCES district)
- District
- Griswold School District
- NCES district ID
- 0901740
- Math proficiency
- 29% ▼ -22.00%
- Reading proficiency
- 42% ▼ -13.00%
- Median HH income
- $59,711
- Composite
- 31.64/100
- National rank
- #5932
- State rank
- #111 of 153 in CT
Livability — Griswold
No livability data for this city. (Only ~50 U.S. cities are tracked.)
Census & demographics
- Population (ZIP)
- 15,697
Population outlook (Southeastern Connecticut County) Hauer SSP2
- By 2040
- 293,442
Race, ethnicity, and origin ACS 2023
- Neighborhood character
- Predominantly White (89%)
- Race & ethnicity
- White 89% Two or more races 7% Hispanic / Latino 4% Native American 1%
- Common ancestry
- Lithuanian 15% Romanian 10% Slovak 2%
- Foreign-born
- 2% · Canada
- Languages at home
- 97% English-only · Spanish 1% French/Haitian/Cajun 1%
Political lean MEDSL · Southeastern Connecticut
- 2024 margin
- D (+13.0) · D 55.6% · R 42.6% · Other 1.8%
- All cycles
- 2024: D+13.0
Not yet ingested
- Civics
- —
Market trends
- HPI YoY
- ▼ -67.06%
- Current HPI
- 227.571
- Rent YoY
- —
- Metro
- —
- State GDP YoY
- ▲ 1.06%
- F500 in state
- 38
Industry mix (Fortune 500 HQ in CT)
| Industry | F500 HQs | Revenue |
|---|---|---|
| Industrial Machinery | 4 | $38B |
|
||
| Insurance | 3 | $71B |
|
||
| Financial Services | 2 | $25B |
|
||
| Transportation / Logistics | 2 | $18B |
|
||
| Healthcare | 1 | $247B |
|
||
| Telecommunications | 1 | $55B |
|
||
Price history
-24.3% since first listed11 events — show timeline
- 2026-04-29 Listed $140,000 Smart MLS
- 2026-01-02 Listing Removed — Smart MLS
- 2025-10-01 Price Changed $139,900 Smart MLS
- 2025-08-02 Listed $149,900 Smart MLS
- 2025-08-01 Listing Removed — Smart MLS
- 2025-07-08 Listing Removed — Smart MLS
- 2025-07-08 Listed $158,000 Smart MLS
- 2025-06-24 Price Changed $158,000 Smart MLS
- 2025-06-23 Price Changed $150,000 Smart MLS
- 2025-06-18 Price Changed $168,000 Smart MLS
- 2025-06-05 Listed $184,900 Smart MLS
Property tax history
+7.7%/yrLatest (2023): $377 · +0.0% YoY. Source: county tax records.
Cash-flow waterfall
monthlySold comps — $/sqft
last 12 mo · ≤1 miLoading sold comps…