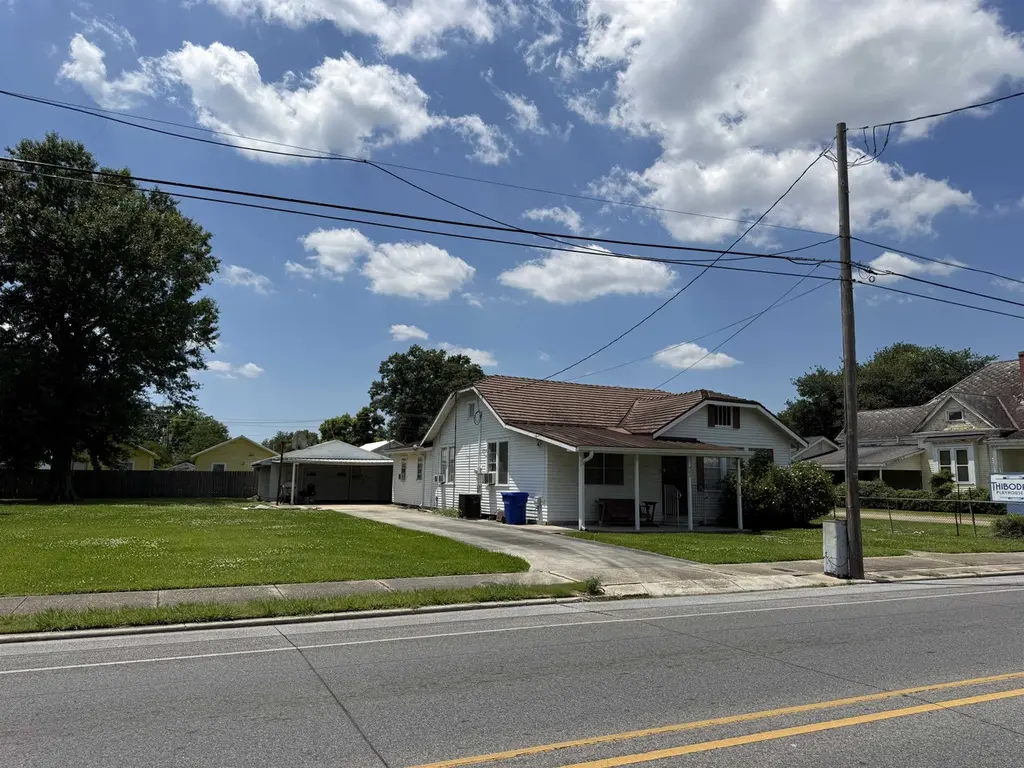
906 Jackson St · Thibodaux, LA
Flood risk 1/10 · Minimal
- FEMA flood zone
- X
- Chance of flooding over 30 yrs
- 0.0%
- Est. flood insurance / yr
- $507 – $1,088
Fire risk 1/10 · Minimal
- Est. fire insurance / yr
- $1,269 – $2,357
Heat risk 9/10 · Severe
- Hot days now (above 108°F)
- 7 days/yr
- Hot days in 30 yrs
- 22 days/yr
Wind risk 9/10 · Severe
- Chance of severe wind over 30 yrs
- 99.0%
Air-quality risk 1/10 · Minimal
- Unhealthy air days now
- 0 days/yr
- Unhealthy air days in 30 yrs
- 0 days/yr
Risk factors via First Street. Map © Google.
Why this score? — see what drove the C- grade
The composite is a weighted blend of 9 inputs, each scored 0–100. Each bar is that input's sub-score; the figure is the points it added to the 100-point composite (weight × sub-score).
- Cash flow +19.0/30.0
- ARV discount +9.1/15.0
- DSCR +6.0/10.0
- Livability +4.2/5.0
- 1% rule +3.9/10.0
- Schools +3.4/10.0
- Rent growth +3.2/5.0
- Condition / age +2.5/5.0
- Appreciation +0.0/10.0
$195,000
🖨 Deal sheet 📄 Offer letter ✓ Due diligence
Listing remarks MLS
This 4-bedroom, 3-bath home located in the heart of Thibodaux offers plenty of space and potential. This spacious home is waiting for the right person to give it a little TLC and make it truly shine. Situated on a large double lot, the property provides ample outdoor space for entertaining, gardening, or future additions. With its convenient location and generous layout, this home is a great opportunity for someone looking to add their personal touch and create a beautiful place to call home.
Key facts
- Ample outdoor space
- Large double lot
- 0.37 acre lot
Tags
Property features AI
Exterior
- Parking: Garage; Carport; Off-street parking
- Utilities: Public water; Public sewer
- Home design: Single-family detached residence; One story
- Construction: Vinyl siding and frame construction; Slab foundation
- Exterior features: Carport; Garage; Off-street parking; Frontage approximately 117'; Lot dimensions about 116.8' x 135.8'; Lot about 0.37 acres
Interior
- Bathrooms: Three full bathrooms
- Heating & cooling: Central heating; Central air conditioning
- Interior features: Wood-burning fireplace (1)
Neighborhood map
What this means for you Summary
Snapshot
- This is a 4-bed/3.0-bath single-family listed at $195k.
Deal economics
- At list price, monthly cash flow is $203 ($2k/yr) — positive.
- The deal already cash-flows at list — no discount required.
- To meet the 1% rule (rent ≥ 1% of price), the offer needs to be $174k (10.7% below list).
- Recommended offer: $174k (10.7% below list) — sets the bar for 1% rule.
- Cap rate 7.5% vs local median 3.8% in Thibodaux — top-decile yield for the area; either an underpriced asset or a hidden risk that comps aren't pricing in. Stress-test before assuming the spread holds.
Location & tenants
- Location reads 84/100 on livability (#2 in LA, #723 nationally) — a professional / high-income tenant draw. Strengths: commute A+, cost of living A+, health & safety A+; Watch: crime C-, employment F.
- Lafourche Parish (other): math 31% / reading 49% proficiency, ranked #22 of 98 in LA (top 22%) — families likely to look elsewhere, expect single-tenant / working-renter base with shorter leases.
- Market conditions: Rents rising (+2.9%/yr); 513 active listings in the ZIP; 2 comparable units currently listed for rent nearby; 319 units permitted in Lafourche Parish in 2024 (0 in 5+ unit buildings).
- This rent runs 36% of the median local income ($58k/yr) — at the standard rent-burdened threshold; future hikes will face affordability resistance.
Forward outlook
- Local home prices are declining (-3.0%/yr); year-one equity from $1k of loan paydown is wiped out by about $6k of value loss. Plan a longer hold.
Negotiation context
- It's been on market 35 days — a 3% lower offer ($189k) is reasonable based on typical stale-listing flexibility.
- 2 sale attempts with the ask held roughly flat each time — persistent listings suggest the price (not the market) is what's stuck; bring a comps-based counter.
Risks & watch-outs
- Climate carrying-cost: severe wind risk, 99% chance of damaging wind over 30y; extreme-heat days projected 7→22/yr by 2055 (HVAC capex compounding) — expect insurance premiums to compound above CPI over the hold.
Questions for the listing agent
- It's been on market 35 days. Have you received any prior offers? Is the seller open to a 11% concession, seller financing, or rate buy-down credit?
- Built in 1965 — when were the roof, HVAC, electrical panel, plumbing, and water heater last replaced?
- Is there a deadline driving the sale (1031 exchange, divorce, estate, relocation)? That informs how much negotiation room exists.
- Schools are A-rated — typically a magnet for longer-tenancy family renters. What's the average tenant stay here, and is there a school-zone premium baked into asking?
- What's the average days-on-market for RENTAL listings here right now (not sales)? A rising rental-DOM trend means longer vacancies and softer asking-rent achievability than the comps imply.
- What's the recent tenant-quality profile in this submarket — average credit score on applications, eviction rate, late-payment / NSF rate, and stable-employment percentage? A property-management company in the area should have these aggregated.
- How much new for-sale + rental construction is in the pipeline within 1–3 miles? Heavy new supply typically softens prices + rents 12–24 months out; constrained supply supports both.
Investment metrics
- 1% rule
- 0.89% ✗
- Cap rate
- 7.54%
- Cash-on-cash
- 4.46%
- DSCR
- 1.20
- GRM
- 9.3
CMA / ARV
- ARV (median comp)
- $202,319
- List price
- $195,000
- Delta
- -3.62%
- Verdict
- FAIR
- Comps
- 20 within 1.0 mi
Show comp detail 12 sales within ~0.75 mi
| Address | Dist | Beds/Ba | Sqft | Sold | Price | $/sf | Match |
|---|---|---|---|---|---|---|---|
| 910 Harrison St | 0.04mi | 4/2.0 | 1,700 (+13%) | 2mo | $145,000 | $85 | 70 |
| 806 Mcculla St | 0.40mi | 3/2.0 (-1) | 1,510 (+1%) | 16mo | $220,000 | $146 | 58 |
| 1221 Tetreau St | 0.63mi | 3/2.0 (-1) | 1,525 (+2%) | 2mo | $199,000 | $130 | 57 |
| 114 Elm St | 0.50mi | 3/2.0 (-1) | 1,568 (+4%) | 12mo | $218,000 | $139 | 50 |
| 107 Vernon St | 0.60mi | 3/2.0 (-1) | 1,376 (-8%) | 2mo | $195,000 | $142 | 48 |
| 144 Pecan St | 0.50mi | 4/2.0 | 1,681 (+12%) | 6mo | $190,000 | $113 | 47 |
| 1040 Henderson St | 0.29mi | 3/1.0 (-1) | 1,299 (-13%) | 11mo | $135,000 | $104 | 42 |
| 510 Olive St | 0.43mi | 3/1.0 (-1) | 1,346 (-10%) | 12mo | $179,000 | $133 | 40 |
| 508 Olive St | 0.42mi | 3/1.0 (-1) | 1,346 (-10%) | 15mo | $179,000 | $133 | 38 |
| 1222 Canal Blvd | 0.55mi | 3/1.5 (-1) | 1,642 (+10%) | 12mo | $200,000 | $122 | 37 |
| 902 Arms St | 0.57mi | 3/2.0 (-1) | 1,290 (-14%) | 15mo | $172,344 | $134 | 28 |
| 320 Arlington Dr | 0.72mi | 3/2.0 (-1) | 1,632 (+9%) | 18mo | $339,900 | $208 | 28 |
Match score weights: distance 35% · size 25% · config 20% · recency 20%. Top-matched comps best support the ARV.
Projected returns pro-forma
-3.0% appreciation · 2.9% rent growth · sell at horizon
- IRR
- -9.5%
- Equity multiple
- 0.65×
- Total profit
- $-18,944
- Equity at exit
- $29,075
- IRR
- -0.2%
- Equity multiple
- 0.98×
- Total profit
- $-918
- Equity at exit
- $16,860
Cash invested: $54,600 (down + closing). Projections, not guarantees.
Landlord ↔ Tenant lean methodology
- Overall (STATE)
- 90 Strongly Landlord-Friendly
- State Louisiana
- 90 Strongly Landlord-Friendly · R+12
- County
- — inherits STATE
- City
- — inherits STATE
ZIP-level market 70301
- Rents YoY
- 2.9%
- Active inventory
- 513
- Price-to-rent
- 9.3×
Monthly cashflow live
- Estimated rent
- $1,742 medium interval (Pro) →
- Mortgage (P&I)
- −$1,023
- Tax from tax record
- −$69 /mo · $831/yr
- Insurance
- −$81
- HOA
- −$0
- Vacancy / Maint / Mgmt
- −$366
- Net cashflow
- $203
Break-even live
UW: 25.0% down · 7.5% · 30yr · 1.5% tax · 5.0% vac · 8.0% maint · 8.0% mgmt
Financing live
Cash to close
- Down payment
- $48,750
- Closing costs
- $5,850
- Reserves months
- —
- Total cash needed
- —
Loan-product check · same deal, 3 products live
Conventional
25% down · 7.5% · 30yr
- Down + closing
- —
- Monthly P&I
- —
- Monthly cashflow
- —
- DSCR
- —
- Eligible?
- —
Personal DTI + credit; lowest rate.
DSCR
20% down · 8.5% · 30yr
- Down + closing
- —
- Monthly P&I
- —
- Monthly cashflow
- —
- DSCR
- —
- Eligible?
- —
No personal income docs; deal must DSCR.
Hard money
10% down · 12.0% · 12mo
- Down + closing
- —
- Monthly P&I
- —
- Monthly cashflow
- —
- DSCR
- —
- Eligible?
- —
Short-term bridge; refi at stabilization.
Rent comps 2 comps
| Address | Beds | Baths | Sqft | Rent | $/sqft | DOM | Units | Dist |
|---|---|---|---|---|---|---|---|---|
| 304 Bradford St Thibodaux, LA | 3.0 | 1.0 | 1400 | $1,150 | $0.82 | 43d | 1 | 0.27mi |
| 106 Beham Ct Thibodaux, LA | 3.0 | 2.0 | 1100 | $1,350 | $1.23 | 43d | 1 | 1.43mi |
Listing history 19 events
-
2026-06-19days on market $195,000 Active 35 DOM
-
2026-06-18days on market $195,000 Active 34 DOM
-
2026-06-17days on market $195,000 Active 33 DOM
-
2026-06-16days on market $195,000 Active 32 DOM
-
2026-06-15days on market $195,000 Active 31 DOM
-
2026-06-14days on market $195,000 Active 29 DOM
-
2026-06-13days on market $195,000 Active 28 DOM
-
2026-06-10days on market $195,000 Active 26 DOM
-
2026-06-09days on market $195,000 Active 25 DOM
-
2026-06-08days on market $195,000 Active 24 DOM
-
2026-06-07days on market $195,000 Active 23 DOM
-
2026-06-05days on market $195,000 Active 20 DOM
-
2026-06-03days on market $195,000 Active 19 DOM
-
2026-06-02days on market $195,000 Active 18 DOM
-
2026-06-01days on market $195,000 Active 17 DOM
-
2026-05-31days on market $195,000 Active 16 DOM
-
2026-05-30days on market $195,000 Active 15 DOM
-
2026-05-14$195,000 Active 497-char remark
Show marketing remark (497 chars)
This 4-bedroom, 3-bath home located in the heart of Thibodaux offers plenty of space and potential. This spacious home is waiting for the right person to give it a little TLC and make it truly shine. Situated on a large double lot, the property provides ample outdoor space for entertaining, gardening, or future additions. With its convenient location and generous layout, this home is a great opportunity for someone looking to add their personal touch and create a beautiful place to call home.
ⓘ Source: listings_history table (triggers on properties + properties_extension) + one-shot
backfill from property_details.listing_events for pre-trigger history.
Tax reassessment forecast LA · Resets to sale price
- Current annual tax
- $831 · $69/mo
- Projected year-2 tax
- $1,072 · $89/mo
- Expected delta
- +$242/yr (+$20/mo · 29.1%)
ⓘ Screening estimate from a state-policy table — verify with the county assessor before closing.
Climate risk First Street
- Flood 1/10 Low FEMA zone X · 0% chance over 30 yrs
- Wildfire 1/10 Low
- Heat 9/10 Extreme 7 d/yr ≥108°F today · 22 d/yr by 30 yrs out
- Wind 9/10 Extreme 99% chance of damaging wind over 30 yrs
- Air quality 1/10 Low 0 unhealthy d/yr today · 0 by 30 yrs out
Nearby sold comps map
Loading sold comps map…
Walkable amenities ~0.75 mi
Loading nearby amenities…
Taxation est. · year 1
- Rental income
- $20,898
- − Mortgage interest
- −$10,923
- − Property taxes
- −$831
- − Insurance
- −$975
- − Repairs & maintenance
- −$1,672
- − Management
- −$1,672
- − Depreciation
- −$5,673
- Taxable loss
- −$847
- Est. tax savings @ 24.0%
- +$203
- After-tax cash flow
- $2,636/yr
For passive investors: Depreciation is non-cash, so a rental often shows a tax loss while cash-flowing — sheltering income. Rental losses are passive: they offset passive income freely, and up to $25,000/yr can offset ordinary (W-2) income if you actively participate and your MAGI is under $100k (phasing out to $0 by $150k); unused losses carry forward. On sale, claimed depreciation is recaptured at up to 25%, and gains may owe capital-gains tax (a 1031 exchange can defer both). Figures are a year-1 estimate at your 24.0% rate — not tax advice; consult a CPA.
Schools (NCES district)
- District
- Lafourche Parish
- NCES district ID
- 2200900
- Math proficiency
- 31% ▼ -43.00%
- Reading proficiency
- 49% ▼ -32.00%
- Median HH income
- $49,703
- Composite
- 34.4/100
- National rank
- #5205
- State rank
- #22 of 98 in LA
Livability — Thibodaux
- Score
- 84/100
- State rank
- #2
- US rank
- #723
Category grades
Schools grade is shown separately in the Schools card above.
Census & demographics
- Census place
- Thibodaux, LA
- County
- Lafourche Parish · 50,095 people
- Metro
- Houma-Thibodaux, LA
- Population (ZIP)
- 50,095
- Household income
- $58,394
- Rent vs Own
- Severe rent burden
- 1513.0
Population outlook (Lafourche County) Hauer SSP2
- Today (2025)
- 102,122 people
- By 2030
- 103,361 · +1.2%
- By 2040
- 104,401 · +2.2%
- By 2050
- 102,795 · +0.7%
- By 2075
- 95,599 · -6.4%
- By 2100
- 82,303 · -19.4%
Race, ethnicity, and origin ACS 2023
- Neighborhood character
- Predominantly White (71%)
- Race & ethnicity
- White 71% Black 20% Hispanic / Latino 5% Two or more races 5% Native American 1%
- Hispanic origin (detail)
- Mexican 3%
- Common ancestry
- Lithuanian 18% Italian 1% Slovak 1%
- Foreign-born
- 2% · Canada
- Languages at home
- 95% English-only · French/Haitian/Cajun 2% Spanish 2%
Political lean MEDSL · Lafourche
- 2024 margin
- Solid R (+62.1) · D 18.4% · R 80.4% · Other 1.2%
- 2008→2024 swing
- -16.1pp toward R · 2008: -46.0pp · 2024: -62.1pp
- All cycles
- 2024: R+62.1 2020: R+60.3 2016: R+56.5 2012: R+48.5 2008: R+46.0
Not yet ingested
- Civics
- —
Market trends
- HPI YoY
- ▼ -98.35%
- Current HPI
- 124.5559
- Rent YoY
- ▲ 2.90%
- Metro
- Houma-Thibodaux, LA
- State GDP YoY
- ▲ 3.29%
- F500 in state
- 10
Industry mix (Fortune 500 HQ in LA)
| Industry | F500 HQs | Revenue |
|---|---|---|
| Telecommunications | 2 | $23B |
|
||
| Utilities | 1 | $12B |
|
||
| Wholesale / Distribution | 1 | $5B |
|
||
| Advertising | 1 | $2B |
|
||
Price history
+0.0% since first listed2 events — show timeline
- 2026-05-14 Listed $195,000 AcadianaMLS
- 2026-05-14 Listed $195,000 GBRMLS
Property tax history
+0.6%/yrLatest (2024): $831 · -0.5% YoY. Source: county tax records.
Cash-flow waterfall
monthlySold comps — $/sqft
last 12 mo · ≤1 miLoading sold comps…