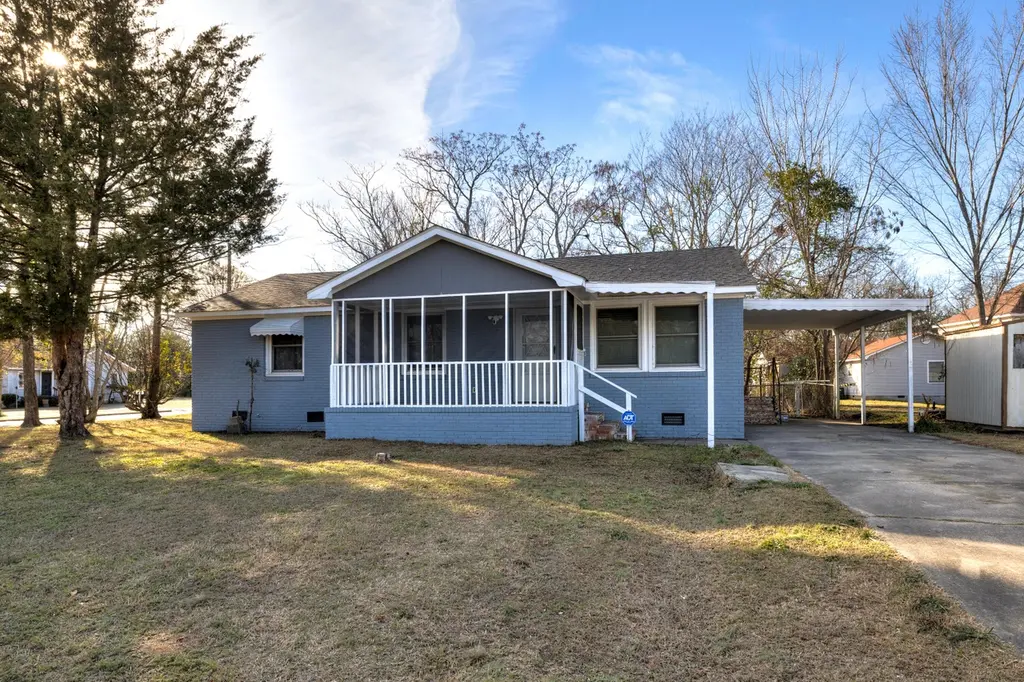
298 N Brand St · Sumter, SC
Flood risk 1/10 · Minimal
- FEMA flood zone
- X (unshaded)
- Chance of flooding over 30 yrs
- 0.0%
- Est. flood insurance / yr
- $507 – $1,088
Fire risk 4/10 · Minor
- Est. fire insurance / yr
- $783 – $1,453
Heat risk 7/10 · Major
- Hot days now (above 108°F)
- 7 days/yr
- Hot days in 30 yrs
- 16 days/yr
Wind risk 8/10 · Major
- Chance of severe wind over 30 yrs
- 80.0%
Air-quality risk 2/10 · Minimal
- Unhealthy air days now
- 2 days/yr
- Unhealthy air days in 30 yrs
- 2 days/yr
Risk factors via First Street. Map © Google.
Why this score? — see what drove the D+ grade
The composite is a weighted blend of 9 inputs, each scored 0–100. Each bar is that input's sub-score; the figure is the points it added to the 100-point composite (weight × sub-score).
- Cash flow +24.7/30.0
- DSCR +8.0/10.0
- 1% rule +5.5/10.0
- Rent growth +3.1/5.0
- Livability +3.0/5.0
- Condition / age +2.5/5.0
- Schools +1.9/10.0
- ARV discount +0.0/15.0
- Appreciation +0.0/10.0
$135,000
🖨 Deal sheet 📄 Offer letter ✓ Due diligence
Listing remarks MLS
Home being sold AS-IS-where-is. First look initiative until Dec. 19th, 2012. Proof of funds required w/ contract earnest money made out to C21 Hawkins & Kolb. All inspections at buyers expense.
Key facts
- Fenced back yard
- Lvp flooring
- 0.23 acre lot
Tags
Property features AI
Exterior
- Parking: Attached carport; 1-car carport
- Utilities: Public water; Public sewer
- Home design: Single family residence; One story; House
- Construction: Brick construction; Shingle roof; Built on crawl space
- Exterior features: Front porch; Chain link fence; Paved road access; Publicly maintained road
Interior
- Kitchen: Dishwasher; Range; Refrigerator; Exhaust fan
- Flooring: Vinyl
- Bathrooms: 2 full bathrooms
- Heating & cooling: Heat pump heating; Central air conditioning
- Interior features: Dryer; Dishwasher; Exhaust fan; Range; Refrigerator; Washer; Vinyl flooring; Crawl space
- Laundry & utility: Washer hookup; Electric dryer hookup; Washer; Dryer
Neighborhood map
What this means for you Summary
Snapshot
- This is a 3-bed/2.0-bath single-family listed at $135k.
Deal economics
- At list price, monthly cash flow is $281 ($3k/yr) — positive.
- The deal already cash-flows at list — no discount required.
- Meets the 1% rule at list price ($1k rent vs $135k).
- Recommended offer: $133k (1.5% below list) — sets the bar for market timing.
- Cap rate 8.8% vs local median 3.4% in Sumter — top-decile yield for the area; either an underpriced asset or a hidden risk that comps aren't pricing in. Stress-test before assuming the spread holds.
Location & tenants
- Location reads 59/100 on livability (#235 in SC) — a working-class tenant base; expect higher turnover. Strengths: cost of living A+, health & safety A+, housing A-; Watch: crime F, amenities F, commute F.
- Sumter 01 (urban): math 18% / reading 28% proficiency, ranked #64 of 80 in SC (top 80%) — low school quality limits family demand, transient renter base, plan for 1-2y turnover; 64% free/reduced lunch — lower-income household profile, screen leases tightly.
- Zoned schools: Millwood Elementary (math 41% / reading 41%, grade F, #276 of 597 statewide, top 48%, 682 students, 100% FRL); Bates Middle (math 9% / reading 21%, grade F, #202 of 229 statewide, top 89%, 569 students, 100% FRL); Sumter High School (math 22% / reading 67%, grade F, #166 of 196 statewide, top 87%, 2,289 students, 100% FRL) — zoned schools average 100% FRL vs 64% district-wide (36 pts higher); higher-poverty schools than district average — tighter screening recommended.
- Market conditions: Rents rising (+2.5%/yr); 376 active listings in the ZIP; 386 units permitted in Sumter County in 2024 (0 in 5+ unit buildings).
- This rent runs 33% of the median local income ($51k/yr) — at the standard rent-burdened threshold; future hikes will face affordability resistance.
Forward outlook
- Local home prices are declining (-3.0%/yr); year-one equity from $933 of loan paydown is wiped out by about $4k of value loss. Plan a longer hold.
- Sumter County population projected at -14% by 2050 — secular population decline; favor cash flow + early exit over multi-decade hold.
Negotiation context
- It's been on market 19 days — a 2% lower offer ($133k) is reasonable based on typical stale-listing flexibility.
- 2 sale attempts since 14y ago with the ask held roughly flat each time — persistent listings suggest the price (not the market) is what's stuck; bring a comps-based counter.
- Current owner paid $18k; list at $135k implies a 650% gain — meaningful room to come down on a strong offer.
Risks & watch-outs
- Climate carrying-cost: severe wind risk, 80% chance of damaging wind over 30y; extreme-heat days projected 7→16/yr by 2055 (HVAC capex compounding) — expect insurance premiums to compound above CPI over the hold.
Questions for the listing agent
- Is there a deadline driving the sale (1031 exchange, divorce, estate, relocation)? That informs how much negotiation room exists.
- Schools are D-rated, which usually means shorter tenancies and higher turnover. Who's the typical renter profile here, and what's been the actual vacancy rate?
- Crime grade is F in this area — have there been break-ins, vandalism, or insurance claims at this property in the last 3 years? What carrier currently insures it and at what premium?
- The area grade is low — what's the realistic commute time and amenity access for the typical tenant pool here? Any planned neighborhood developments (good or bad) we should know about?
- What's the average days-on-market for RENTAL listings here right now (not sales)? A rising rental-DOM trend means longer vacancies and softer asking-rent achievability than the comps imply.
- What's the recent tenant-quality profile in this submarket — average credit score on applications, eviction rate, late-payment / NSF rate, and stable-employment percentage? A property-management company in the area should have these aggregated.
- How much new for-sale + rental construction is in the pipeline within 1–3 miles? Heavy new supply typically softens prices + rents 12–24 months out; constrained supply supports both.
Investment metrics
- 1% rule
- 1.05% ✓
- Cap rate
- 8.79%
- Cash-on-cash
- 8.92%
- DSCR
- 1.40
- GRM
- 7.9
CMA / ARV
- ARV (on-the-fly)
- $109,096
- Comps found
- 7
Show comp detail 7 sales within ~0.75 mi
| Address | Dist | Beds/Ba | Sqft | Sold | Price | $/sf | Match |
|---|---|---|---|---|---|---|---|
| 298 N Brand St | 0.00mi | 3/2.0 | 1,049 (0%) | 1mo | $106,000 | $101 | 99 |
| 544 S Sumter St | 0.33mi | 3/1.0 | 1,012 (-4%) | 23mo | $10,000 | $10 | 55 |
| 705 S Main St | 0.48mi | 3/1.0 | 924 (-12%) | 5mo | $28,500 | $31 | 50 |
| 703 Manning Ave | 0.72mi | 3/2.0 | 1,122 (+7%) | 8mo | $120,000 | $107 | 48 |
| 110 Council St | 0.55mi | 3/2.0 | 1,187 (+13%) | 12mo | $170,000 | $143 | 43 |
| 107 S Magnolia St | 0.41mi | 3/2.0 | 1,197 (+14%) | 18mo | $125,000 | $104 | 43 |
| 105 S Magnolia St | 0.72mi | 3/2.0 | 1,193 (+14%) | 15mo | $156,000 | $131 | 31 |
Match score weights: distance 35% · size 25% · config 20% · recency 20%. Top-matched comps best support the ARV.
Projected returns pro-forma
-3.0% appreciation · 2.55% rent growth · sell at horizon
- IRR
- -3.3%
- Equity multiple
- 0.88×
- Total profit
- $-4,661
- Equity at exit
- $20,129
- IRR
- 5.9%
- Equity multiple
- 1.43×
- Total profit
- $16,232
- Equity at exit
- $11,672
Cash invested: $37,800 (down + closing). Projections, not guarantees.
Landlord ↔ Tenant lean methodology
- Overall (STATE)
- 90 Strongly Landlord-Friendly
- State South Carolina
- 90 Strongly Landlord-Friendly · R+6
- County
- — inherits STATE
- City
- — inherits STATE
ZIP-level market 29150
- Rents YoY
- 2.5%
- Active inventory
- 376
- Price-to-rent
- 7.9×
Monthly cashflow live
- Estimated rent
- $1,418 medium interval (Pro) →
- Mortgage (P&I)
- −$708
- Tax from tax record
- −$75 /mo · $898/yr
- Insurance
- −$56
- HOA
- −$0
- Vacancy / Maint / Mgmt
- −$298
- Net cashflow
- $281
Break-even live
UW: 25.0% down · 7.5% · 30yr · 1.5% tax · 5.0% vac · 8.0% maint · 8.0% mgmt
Financing live
Cash to close
- Down payment
- $33,750
- Closing costs
- $4,050
- Reserves months
- —
- Total cash needed
- —
Loan-product check · same deal, 3 products live
Conventional
25% down · 7.5% · 30yr
- Down + closing
- —
- Monthly P&I
- —
- Monthly cashflow
- —
- DSCR
- —
- Eligible?
- —
Personal DTI + credit; lowest rate.
DSCR
20% down · 8.5% · 30yr
- Down + closing
- —
- Monthly P&I
- —
- Monthly cashflow
- —
- DSCR
- —
- Eligible?
- —
No personal income docs; deal must DSCR.
Hard money
10% down · 12.0% · 12mo
- Down + closing
- —
- Monthly P&I
- —
- Monthly cashflow
- —
- DSCR
- —
- Eligible?
- —
Short-term bridge; refi at stabilization.
Listing history 5 events
-
2026-05-01status Pending
-
2026-04-12$135,000 Active
-
2013-02-15soldstatus $18,000 199-char remark
Show marketing remark (199 chars)
Home being sold AS-IS-where-is. First look initiative until Dec. 19th, 2012. Proof of funds required w/ contract earnest money made out to C21 Hawkins & Kolb. All inspections at buyers expense.
-
2012-12-04$24,900 199-char remark
Show marketing remark (199 chars)
Home being sold AS-IS-where-is. First look initiative until Dec. 19th, 2012. Proof of funds required w/ contract earnest money made out to C21 Hawkins & Kolb. All inspections at buyers expense.
-
2007-10-12soldstatus $37,500
ⓘ Source: listings_history table (triggers on properties + properties_extension) + one-shot
backfill from property_details.listing_events for pre-trigger history.
Tax reassessment forecast SC · Resets to sale price
- Current annual tax
- $898 · $75/mo
- Projected year-2 tax
- $898 · $75/mo
- Expected delta
- $0/yr ($0/mo · 0.0%)
ⓘ Screening estimate from a state-policy table — verify with the county assessor before closing.
Climate risk First Street
- Flood 1/10 Low FEMA zone X (unshaded) · 0% chance over 30 yrs
- Wildfire 4/10 Moderate
- Heat 7/10 Severe 7 d/yr ≥108°F today · 16 d/yr by 30 yrs out
- Wind 8/10 Severe 80% chance of damaging wind over 30 yrs
- Air quality 2/10 Low 2 unhealthy d/yr today · 2 by 30 yrs out
Nearby sold comps map
Loading sold comps map…
Walkable amenities ~0.75 mi
Loading nearby amenities…
Taxation est. · year 1
- Rental income
- $17,011
- − Mortgage interest
- −$7,562
- − Property taxes
- −$898
- − Insurance
- −$675
- − Repairs & maintenance
- −$1,361
- − Management
- −$1,361
- − Depreciation
- −$3,927
- Taxable income
- $1,227
- Est. tax owed @ 24.0%
- −$295
- After-tax cash flow
- $3,076/yr
For passive investors: Depreciation is non-cash, so a rental often shows a tax loss while cash-flowing — sheltering income. Rental losses are passive: they offset passive income freely, and up to $25,000/yr can offset ordinary (W-2) income if you actively participate and your MAGI is under $100k (phasing out to $0 by $150k); unused losses carry forward. On sale, claimed depreciation is recaptured at up to 25%, and gains may owe capital-gains tax (a 1031 exchange can defer both). Figures are a year-1 estimate at your 24.0% rate — not tax advice; consult a CPA.
Schools (NCES district)
- District
- Sumter 01
- NCES district ID
- 4503902
- Math proficiency
- 18% ▼ -13.00%
- Reading proficiency
- 28% ▼ -6.00%
- Median HH income
- $40,423
- Composite
- 19.45/100
- National rank
- #8775
- State rank
- #64 of 80 in SC
Livability — Sumter
- Score
- 59/100
- State rank
- #235
- US rank
- #19754
Category grades
Schools grade is shown separately in the Schools card above.
Census & demographics
- Census place
- Sumter, SC
- County
- Sumter County · 76,912 people
- City population
- 67,992
- Metro
- Sumter, SC
- Population (ZIP)
- 38,538
- Household income
- $50,965
- Rent vs Own
- Severe rent burden
- 1136.0
Population outlook (Sumter County) Hauer SSP2
- Today (2025)
- 104,585 people
- By 2030
- 102,282 · -2.2%
- By 2040
- 96,258 · -8.0%
- By 2050
- 89,592 · -14.3%
- By 2075
- 74,715 · -28.6%
- By 2100
- 60,235 · -42.4%
Race, ethnicity, and origin ACS 2023
- Neighborhood character
- Diverse neighborhood (Simpson 0.60)
- Race & ethnicity
- Black 50% White 39% Hispanic / Latino 5% Two or more races 4% Asian 2%
- Hispanic origin (detail)
- Mexican 3% Puerto Rican 1%
- Common ancestry
- Slovak 2% Lithuanian 1% Italian 1%
- Foreign-born
- 4% · Canada, China, Vietnam
- Languages at home
- 93% English-only · Spanish 4% Other Indo-European 1% German/W. Germanic 1%
Political lean MEDSL · Sumter
- 2024 margin
- Toss-up / Even · D 51.9% · R 47.0% · Other 1.2%
- 2008→2024 swing
- -10.6pp toward R · 2008: 15.4pp · 2024: 4.9pp
- All cycles
- 2024: D+4.9 2020: D+13.0 2016: D+12.0 2012: D+17.5 2008: D+15.4
Not yet ingested
- Civics
- —
Market trends
- HPI YoY
- ▼ -100.16%
- Current HPI
- 129.032
- Rent YoY
- ▲ 2.55%
- Metro
- Sumter, SC
- State GDP YoY
- ▲ 4.51%
- F500 in state
- 2
Industry mix (Fortune 500 HQ in SC)
| Industry | F500 HQs | Revenue |
|---|---|---|
| Packaging | 1 | $7B |
|
||
Price history
+260.0% since first listed5 events — show timeline
- 2026-05-01 Pending — SBOR
- 2026-04-12 Listed $135,000 SBOR
- 2013-02-15 Sold (MLS) $18,000 SBOR
- 2012-12-04 Listed $24,900 SBOR
- 2007-10-12 Sold (Public Records) $37,500 Public Records
Property tax history
-0.4%/yrLatest (2025): $898 · +1.9% YoY. Source: county tax records.
Cash-flow waterfall
monthlySold comps — $/sqft
last 12 mo · ≤1 miLoading sold comps…