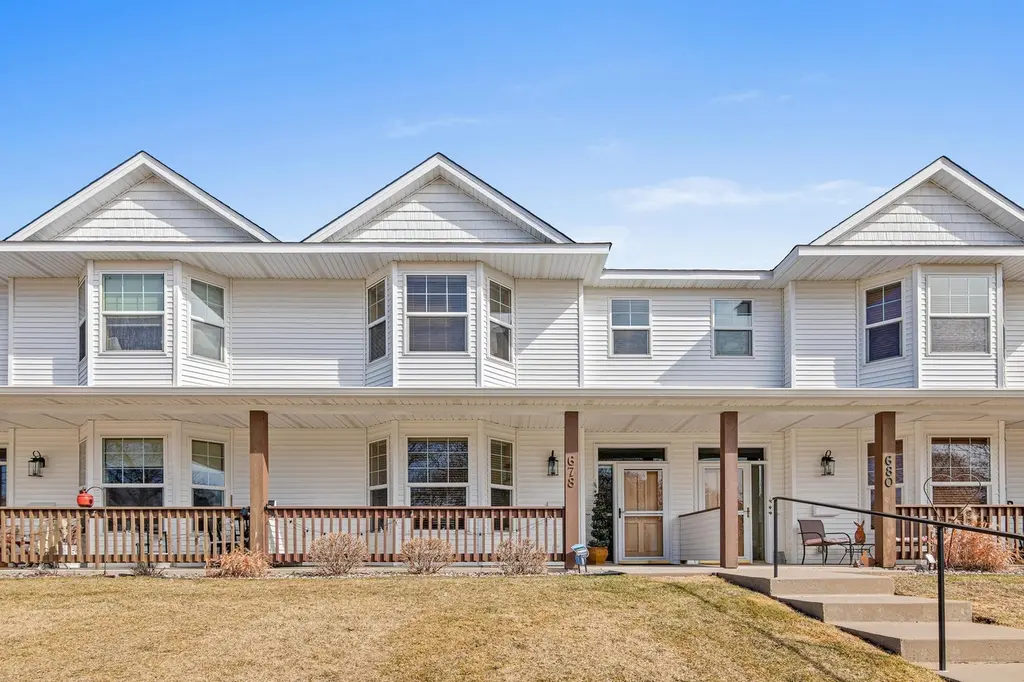
678 Orrin St · St. Paul, MN
Flood risk 1/10 · Minimal
- FEMA flood zone
- X (unshaded)
- Chance of flooding over 30 yrs
- 0.0%
- Est. flood insurance / yr
- $473 – $860
Fire risk 1/10 · Minimal
- Est. fire insurance / yr
- $888 – $1,650
Heat risk 2/10 · Minimal
- Hot days now (above 100°F)
- 7 days/yr
- Hot days in 30 yrs
- 14 days/yr
Wind risk 2/10 · Minimal
- Chance of severe wind over 30 yrs
- —
Air-quality risk 2/10 · Minimal
- Unhealthy air days now
- 1 days/yr
- Unhealthy air days in 30 yrs
- 1 days/yr
Risk factors via First Street. Map © Google.
Why this score? — see what drove the C- grade
The composite is a weighted blend of 9 inputs, each scored 0–100. Each bar is that input's sub-score; the figure is the points it added to the 100-point composite (weight × sub-score).
- Cash flow +20.5/30.0
- ARV discount +7.5/15.0
- 1% rule +6.8/10.0
- DSCR +6.5/10.0
- Rent growth +2.9/5.0
- Livability +2.5/5.0
- Condition / age +2.5/5.0
- Schools +2.4/10.0
- Appreciation +0.0/10.0
$300,000
🖨 Deal sheet 📄 Offer letter ✓ Due diligence
Listing remarks MLS
A RARE FIND! DISCOVER THIS SPACIOUS & BRIGHT 3BEDROOM/2BATH TOWNHOME, BATHED IN NATURAL LIGHT AND OFFERING CAREFREE LIVING! THE HANDSOME LIVING ROOM FEATURES A BAY WINDOW, OPEN TO THE DINING ROOM. UPGRADED KITCHEN W/MAPLE CABINETRY, SS APPLIANCES. 2CAR+
Key facts
- $375 HOA
- 2 garage spots
- Built 2006
Property features AI
Finance
- Other: Neighborhood number 103
- HOA & community: Self-managed HOA (monthly fee $375) covering hazard insurance, lawn care, and snow removal; Other annual assessment: $174
Exterior
- Parking: Detached 2-car garage with garage door opener (approx. 22x22)
- Utilities: City water connected; City sewer connected; Electric with circuit breakers; Natural gas
- Home design: Attached residential property; Two levels; Primary suite on main level; Shaded roof age: 8 years or less
- Construction: Slab foundation; Foundation area approximately 776; Above-grade finished area approximately 1,552; Building total area approximately 1,552
- Exterior features: Covered front porch; Vinyl exterior; Zero lot line; Common lot area; No pool
Interior
- Kitchen: Dishwasher; Disposal; Microwave; Range; Refrigerator; Stainless steel appliances; Breakfast bar / informal dining area
- Bedrooms: 3 bedrooms (primary suite on main level); Upper-level bedrooms: two secondary bedrooms
- Bathrooms: Main floor full bathroom; Upper-level 3/4 bathroom with walk-in shower (primary walk-thru)
- Heating & cooling: Forced air heating; Central air conditioning
- Interior features: Ceiling fan(s); Kitchen window; Natural woodwork; Paneled doors; Porch; In-ground sprinkler; Primary bedroom walk-in closet; Walk-in closet
- Laundry & utility: Main level laundry room; Dryer; Gas water heater
Neighborhood map
What this means for you Summary
Snapshot
- This is a 3-bed/2.0-bath townhouse listed at $300k.
Deal economics
- At list price, monthly cash flow is $395 ($5k/yr) — positive.
- The deal already cash-flows at list — no discount required.
- Meets the 1% rule at list price ($4k rent vs $300k).
- Recommended offer: $291k (3.0% below list) — sets the bar for market timing.
Location & tenants
- Location reads: area grade C — affects rentability + tenant quality, not the cash-flow math above.
- St. Paul Public School District (urban): math 21% / reading 33% proficiency, ranked #270 of 301 in MN (top 90%) — low school quality limits family demand, transient renter base, plan for 1-2y turnover; 64% free/reduced lunch — lower-income household profile, screen leases tightly.
- Market conditions: Rents rising (+1.6%/yr); 145 active listings in the ZIP; 4 comparable units currently listed for rent nearby; rentals leasing fast (median 2d on market — plan ~1-2 weeks tenant-placement turnaround); solid renter incomes; 1,202 units permitted in Ramsey County in 2024 (880 in 5+ unit buildings).
- At $3,547/mo this rent would consume 56% of the median local household income ($76k/yr) (locally 1116% of renters already pay >50% of income on rent) — very limited rent-growth headroom before tenants either downsize or default.
Forward outlook
- Local home prices are declining (-3.0%/yr); year-one equity from $2k of loan paydown is wiped out by about $9k of value loss. Plan a longer hold.
- Ramsey County population projected at +27% by 2050 — long-run rental-demand tailwind backs the buy-and-hold thesis.
Negotiation context
- It's been on market 56 days — a 3% lower offer ($291k) is reasonable based on typical stale-listing flexibility.
- 3 sale attempts since 20y ago with the ask held roughly flat each time — persistent listings suggest the price (not the market) is what's stuck; bring a comps-based counter.
- Current owner paid $170k; list at $300k implies a 76% gain — meaningful room to come down on a strong offer.
Questions for the listing agent
- It's been on market 56 days. Have you received any prior offers? Is the seller open to a 3% concession, seller financing, or rate buy-down credit?
- What does the HOA fee cover, when was the last increase, and are there any pending special assessments or reserve-fund shortfalls?
- Is there a deadline driving the sale (1031 exchange, divorce, estate, relocation)? That informs how much negotiation room exists.
- What's the average days-on-market for RENTAL listings here right now (not sales)? A rising rental-DOM trend means longer vacancies and softer asking-rent achievability than the comps imply.
- What's the recent tenant-quality profile in this submarket — average credit score on applications, eviction rate, late-payment / NSF rate, and stable-employment percentage? A property-management company in the area should have these aggregated.
- How much new for-sale + rental construction is in the pipeline within 1–3 miles? Heavy new supply typically softens prices + rents 12–24 months out; constrained supply supports both.
Investment metrics
- 1% rule
- 1.18% ✓
- Cap rate
- 7.87%
- Cash-on-cash
- 5.65%
- DSCR
- 1.25
- GRM
- 7.0
CMA / ARV
No comps found within radius.
Projected returns pro-forma
-3.0% appreciation · 1.6% rent growth · sell at horizon
- IRR
- -9.3%
- Equity multiple
- 0.67×
- Total profit
- $-28,115
- Equity at exit
- $44,731
- IRR
- -2.0%
- Equity multiple
- 0.87×
- Total profit
- $-10,682
- Equity at exit
- $25,939
Cash invested: $84,000 (down + closing). Projections, not guarantees.
Landlord ↔ Tenant lean methodology
- Overall (STATE)
- 46 Balanced
- State Minnesota
- 46 Balanced · D+2
- County
- — inherits STATE
- City
- — inherits STATE
ZIP-level market 55102
- Rents YoY
- 1.6%
- Active inventory
- 145
- Price-to-rent
- 7.0×
Monthly cashflow live
- Estimated rent
- $3,547 medium interval (Pro) →
- Mortgage (P&I)
- −$1,573
- Tax from tax record
- −$334 /mo · $4,002/yr
- Insurance
- −$125
- HOA
- −$375
- Vacancy / Maint / Mgmt
- −$745
- Net cashflow
- $395
Break-even live
UW: 25.0% down · 7.5% · 30yr · 1.5% tax · 5.0% vac · 8.0% maint · 8.0% mgmt
Financing live
Cash to close
- Down payment
- $75,000
- Closing costs
- $9,000
- Reserves months
- —
- Total cash needed
- —
Loan-product check · same deal, 3 products live
Conventional
25% down · 7.5% · 30yr
- Down + closing
- —
- Monthly P&I
- —
- Monthly cashflow
- —
- DSCR
- —
- Eligible?
- —
Personal DTI + credit; lowest rate.
DSCR
20% down · 8.5% · 30yr
- Down + closing
- —
- Monthly P&I
- —
- Monthly cashflow
- —
- DSCR
- —
- Eligible?
- —
No personal income docs; deal must DSCR.
Hard money
10% down · 12.0% · 12mo
- Down + closing
- —
- Monthly P&I
- —
- Monthly cashflow
- —
- DSCR
- —
- Eligible?
- —
Short-term bridge; refi at stabilization.
Rent comps 4 comps
| Address | Beds | Baths | Sqft | Rent | $/sqft | DOM | Units | Dist |
|---|---|---|---|---|---|---|---|---|
| 740 Victoria St S Saint Paul, MN | 3.0 | 1.0–2.0 | 1076 | $3,746 | $3.48 | 2d | 39 | 0.20mi |
| 470 Lexington Pkwy S Saint Paul, MN | 2.0 | 1.0–2.0 | 1175 | $3,500 | $2.98 | 1d | 19 | 0.82mi |
| 871 Sibley Memorial Hwy Saint Paul, MN | 1.0–3.0 | 1.0–2.0 | 1207 | $5,930 | $4.91 | 2d | 8 | 1.03mi |
| 695 Grand Ave Saint Paul, MN | 1.0–2.0 | 1.0–2.0 | 1130 | $5,795 | $5.13 | 17d | 10 | 1.33mi |
HOA detail
- Monthly dues
- $375 · $4,500/yr
Listing history 11 events
-
2026-05-21status Pending
-
2026-04-15historical Contingent - Subject to Statutory Rescission
-
2026-03-27$300,000 Active
-
2026-03-26historical $300,000
-
2012-11-29soldstatus $170,450
-
2012-11-15soldstatus $170,450 257-char remark
Show marketing remark (257 chars)
A RARE FIND! DISCOVER THIS SPACIOUS & BRIGHT 3BEDROOM/2BATH TOWNHOME, BATHED IN NATURAL LIGHT AND OFFERING CAREFREE LIVING! THE HANDSOME LIVING ROOM FEATURES A BAY WINDOW, OPEN TO THE DINING ROOM. UPGRADED KITCHEN W/MAPLE CABINETRY, SS APPLIANCES. 2CAR+
-
2012-10-22historical 257-char remark
Show marketing remark (257 chars)
A RARE FIND! DISCOVER THIS SPACIOUS & BRIGHT 3BEDROOM/2BATH TOWNHOME, BATHED IN NATURAL LIGHT AND OFFERING CAREFREE LIVING! THE HANDSOME LIVING ROOM FEATURES A BAY WINDOW, OPEN TO THE DINING ROOM. UPGRADED KITCHEN W/MAPLE CABINETRY, SS APPLIANCES. 2CAR+
-
2012-05-31$187,000 257-char remark
Show marketing remark (257 chars)
A RARE FIND! DISCOVER THIS SPACIOUS & BRIGHT 3BEDROOM/2BATH TOWNHOME, BATHED IN NATURAL LIGHT AND OFFERING CAREFREE LIVING! THE HANDSOME LIVING ROOM FEATURES A BAY WINDOW, OPEN TO THE DINING ROOM. UPGRADED KITCHEN W/MAPLE CABINETRY, SS APPLIANCES. 2CAR+
-
2007-05-15soldstatus $215,000 263-char remark
Show marketing remark (263 chars)
1YR FREE ASSOC. DUES. Brand-new model ready to move in. VALUE UPGRADES INCLUDE MAPLE KIT, DOORS AND TRIM THROUGHOUT, STAINLESS KIT APPL. & LIGHTING. Includes washer, dryer, central air & double gar. 3 BR/2 BA. BIG ROOMS, NATURAL LIGHT. Convenient location
-
2007-05-11historical 263-char remark
Show marketing remark (263 chars)
1YR FREE ASSOC. DUES. Brand-new model ready to move in. VALUE UPGRADES INCLUDE MAPLE KIT, DOORS AND TRIM THROUGHOUT, STAINLESS KIT APPL. & LIGHTING. Includes washer, dryer, central air & double gar. 3 BR/2 BA. BIG ROOMS, NATURAL LIGHT. Convenient location
-
2006-12-01$219,900 263-char remark
Show marketing remark (263 chars)
1YR FREE ASSOC. DUES. Brand-new model ready to move in. VALUE UPGRADES INCLUDE MAPLE KIT, DOORS AND TRIM THROUGHOUT, STAINLESS KIT APPL. & LIGHTING. Includes washer, dryer, central air & double gar. 3 BR/2 BA. BIG ROOMS, NATURAL LIGHT. Convenient location
ⓘ Source: listings_history table (triggers on properties + properties_extension) + one-shot
backfill from property_details.listing_events for pre-trigger history.
Tax reassessment forecast MN · Partial reset (capped growth)
- Current annual tax
- $4,002 · $334/mo
- Projected year-2 tax
- $4,002 · $334/mo
- Expected delta
- $0/yr ($0/mo · 0.0%)
ⓘ Screening estimate from a state-policy table — verify with the county assessor before closing.
Climate risk First Street
- Flood 1/10 Low FEMA zone X (unshaded) · 0% chance over 30 yrs
- Wildfire 1/10 Low
- Heat 2/10 Low 7 d/yr ≥100°F today · 14 d/yr by 30 yrs out
- Wind 2/10 Low
- Air quality 2/10 Low 1 unhealthy d/yr today · 1 by 30 yrs out
Nearby sold comps map
Loading sold comps map…
Walkable amenities ~0.75 mi
Loading nearby amenities…
Taxation est. · year 1
- Rental income
- $42,560
- − Mortgage interest
- −$16,805
- − Property taxes
- −$4,002
- − Insurance
- −$1,500
- − Repairs & maintenance
- −$3,405
- − Management
- −$3,405
- − HOA
- −$4,500
- − Depreciation
- −$8,727
- Taxable income
- $217
- Est. tax owed @ 24.0%
- −$52
- After-tax cash flow
- $4,690/yr
For passive investors: Depreciation is non-cash, so a rental often shows a tax loss while cash-flowing — sheltering income. Rental losses are passive: they offset passive income freely, and up to $25,000/yr can offset ordinary (W-2) income if you actively participate and your MAGI is under $100k (phasing out to $0 by $150k); unused losses carry forward. On sale, claimed depreciation is recaptured at up to 25%, and gains may owe capital-gains tax (a 1031 exchange can defer both). Figures are a year-1 estimate at your 24.0% rate — not tax advice; consult a CPA.
Schools (NCES district)
- District
- St. Paul Public School District
- NCES district ID
- 2733840
- Math proficiency
- 21% ▼ -11.00%
- Reading proficiency
- 33% ▼ -7.00%
- Median HH income
- $48,316
- Composite
- 23.51/100
- National rank
- #7868
- State rank
- #270 of 301 in MN
Livability — St. Paul
No livability data for this city. (Only ~50 U.S. cities are tracked.)
Census & demographics
- Census place
- St. Paul, MN
- County
- Ramsey County · 542,837 people
- City population
- 280,599
- Metro
- Minneapolis-St. Paul-Bloomington, MN-WI
- Population (ZIP)
- 19,630
- Household income
- $76,406
- Rent vs Own
- Severe rent burden
- 1116.0
Population outlook (Ramsey County) Hauer SSP2
- Today (2025)
- 603,431 people
- By 2030
- 636,459 · +5.5%
- By 2040
- 700,596 · +16.1%
- By 2050
- 765,819 · +26.9%
- By 2075
- 929,297 · +54.0%
- By 2100
- 1,053,924 · +74.7%
Race, ethnicity, and origin ACS 2023
- Neighborhood character
- Predominantly White (77%)
- Race & ethnicity
- White 77% Black 10% Two or more races 6% Hispanic / Latino 5% Asian 3%
- Hispanic origin (detail)
- Mexican 4%
- Common ancestry
- Portuguese 10% Lithuanian 5% Romanian 3%
- Foreign-born
- 9% · Canada, South Korea
- Languages at home
- 87% English-only · Spanish 4% Other Indo-European 1% German/W. Germanic 1%
Political lean MEDSL · Ramsey
- 2024 margin
- Solid D (+43.3) · D 70.5% · R 27.2% · Other 2.3%
- 2008→2024 swing
- +9.4pp toward D · 2008: 33.9pp · 2024: 43.3pp
- All cycles
- 2024: D+43.3 2020: D+45.4 2016: D+39.4 2012: D+35.3 2008: D+33.9
Not yet ingested
- Civics
- —
Market trends
- HPI YoY
- ▼ -217.83%
- Current HPI
- 241.7112
- Rent YoY
- ▲ 1.60%
- Metro
- Minneapolis-St. Paul-Bloomington, MN-WI
- State GDP YoY
- ▲ 2.41%
- F500 in state
- 34
Industry mix (Fortune 500 HQ in MN)
| Industry | F500 HQs | Revenue |
|---|---|---|
| Healthcare | 2 | $407B |
|
||
| Retail | 2 | $150B |
|
||
| Consumer Goods | 2 | $32B |
|
||
| Industrial Machinery | 2 | $6B |
|
||
| Agriculture | 1 | $40B |
|
||
| Healthcare / Medical Devices | 1 | $32B |
|
||
Price history
+36.4% since first listed11 events — show timeline
- 2026-05-21 Pending — NORTHSTARMLS as Distributed by MLS Grid
- 2026-04-15 Contingent — NORTHSTARMLS as Distributed by MLS Grid
- 2026-03-27 Listed $300,000 NORTHSTARMLS as Distributed by MLS Grid
- 2026-03-26 Coming Soon $300,000 NORTHSTARMLS as Distributed by MLS Grid
- 2012-11-29 Sold (Public Records) $170,450 Public Records
- 2012-11-15 Sold (MLS) $170,450 NORTHSTARMLS as Distributed by MLS Grid
- 2012-10-22 Listing Removed — NORTHSTARMLS as Distributed by MLS Grid
- 2012-05-31 Listed $187,000 NORTHSTARMLS as Distributed by MLS Grid
- 2007-05-15 Sold (MLS) $215,000 NORTHSTARMLS as Distributed by MLS Grid
- 2007-05-11 Listing Removed — NORTHSTARMLS as Distributed by MLS Grid
- 2006-12-01 Listed $219,900 NORTHSTARMLS as Distributed by MLS Grid
Property tax history
+4.3%/yrLatest (2025): $4,002 · +7.8% YoY. Source: county tax records.
Cash-flow waterfall
monthlySold comps — $/sqft
last 12 mo · ≤1 miLoading sold comps…