 Multi-family
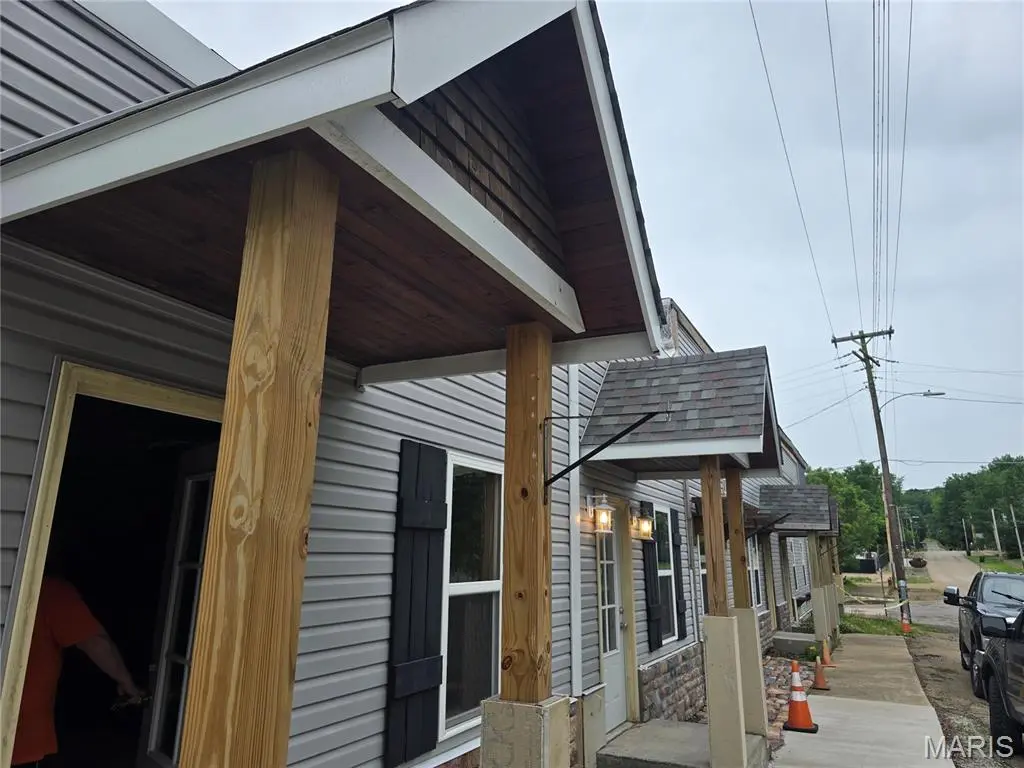
202 N Main St · Arcadia, MO
Flood risk No data
- FEMA flood zone
- —
- Chance of flooding over 30 yrs
- —
- Est. flood insurance / yr
- —
Fire risk No data
- Est. fire insurance / yr
- —
Heat risk No data
- Hot days now (above threshold)
- —
- Hot days in 30 yrs
- —
Wind risk No data
- Chance of severe wind over 30 yrs
- —
Air-quality risk No data
- Unhealthy air days now
- —
- Unhealthy air days in 30 yrs
- —
Risk factors via First Street. Map © Google.
Why this score? — see what drove the B+ grade
The composite is a weighted blend of 9 inputs, each scored 0–100. Each bar is that input's sub-score; the figure is the points it added to the 100-point composite (weight × sub-score).
- Cash flow +30.0/30.0
- 1% rule +10.0/10.0
- DSCR +10.0/10.0
- ARV discount +7.5/15.0
- Appreciation +6.8/10.0
- Condition / age +3.8/5.0
- Schools +3.6/10.0
- Livability +3.1/5.0
- Rent growth +2.5/5.0
$79,900
🖨 Deal sheet 📄 Offer letter ✓ Due diligence
Multi-family units
County records classify this as Multi-Family (2-4 Unit). Listing-text estimate: 1 unit. estimate disagrees with records
Listing remarks
Investor Special in the Heart of Arcadia! Incredible opportunity to finish and customize a multi-unit income producing property with major updates already completed. This spacious building was designed for 3 separate condos/apartments, each offering approximately 2,500 sq ft of living space. Perfect for long-term rentals, corporate housing, or multi-family investment potential. Property features a total of 27 rooms, 6 bedrooms, and 6 bathrooms across the three planned units. Each unit is designed with 2 bedrooms, 2 bathrooms, living room, dining room, den, office, and laundry room. One unit also includes space for a private 3-car garage. Builders and investors can complete the interiors to
Key facts
- 0.23 acre lot
- Built 1880
- Listed 10 days
Property features AI
Exterior
- Utilities: Public water; Public sewer; Electric service by Ameren; Cable available; Phone available; Electricity connected; Sewer connected; Water connected
- Home design: Single-family residence; One level
- Construction: Vinyl siding
- Exterior features: City lot; Corner lot; Level lot; Near public transit
Interior
- Bedrooms: Six bedrooms, all on the main level
- Bathrooms: Six full bathrooms, all on the main level
- Heating & cooling: Heating varies by unit; Multiple cooling units
- Interior features: Crawl space basement; Multiple total rooms (27)
- Laundry & utility: Laundry facilities in multiple locations
Neighborhood map
What this means for you Summary
Snapshot
- This is a 6-bed/6.0-bath multifamily listed at $80k. Condition is rated good.
Deal economics
- At list price, monthly cash flow is $2k ($23k/yr) — positive.
- The deal already cash-flows at list — no discount required.
- Meets the 1% rule at list price ($3k rent vs $80k).
Location & tenants
- Location reads 62/100 on livability (#372 in MO) — a middle-class / working-renter tenant base. Strengths: crime A+, cost of living A+, housing A; Watch: amenities F, commute F, employment F.
- Arcadia Valley R-II (rural): math 42% / reading 46% proficiency, ranked #115 of 324 in MO (top 36%) — families likely to look elsewhere, expect single-tenant / working-renter base with shorter leases.
- Zoned schools: Arcadia Valley Elem. (math 42% / reading 42%, grade F, #481 of 1,115 statewide, top 46%, 397 students, 99% FRL); Arcadia Valley High (math 47% / reading 62%, grade C-, #69 of 521 statewide, top 15%, 343 students, 50% FRL) — zoned schools average 75% FRL vs 55% district-wide (20 pts higher); higher-poverty schools than district average — tighter screening recommended.
- Market conditions: 12 active listings in the ZIP; 6 units permitted in Iron County in 2024 (0 in 5+ unit buildings).
Forward outlook
- In year one you build about $3k of equity ($552 loan paydown + $3k appreciation (3.7% local appreciation)).
- Iron County population projected at -25% by 2050 — secular population decline; favor cash flow + early exit over multi-decade hold.
- At projected returns (3.7% appreciation + 3.0% rent growth), your $22k cash investment doubles in ~1 year — after that, you're playing with house money.
- By year 10, paydown + projected appreciation supports a ~$34k cash-out refi (75% LTV) — recoverable capital for the next deal without selling this one.
Negotiation context
- Only 11 days on market — expect competitive offers; lowballing is unlikely to land.
Risks & watch-outs
- Watch-outs: built in 1880 — expect roof / HVAC / electrical / plumbing capex.
Questions for the listing agent
- Built in 1880 — when were the roof, HVAC, electrical panel, plumbing, and water heater last replaced?
- Is there a deadline driving the sale (1031 exchange, divorce, estate, relocation)? That informs how much negotiation room exists.
- What's the average days-on-market for RENTAL listings here right now (not sales)? A rising rental-DOM trend means longer vacancies and softer asking-rent achievability than the comps imply.
- What's the recent tenant-quality profile in this submarket — average credit score on applications, eviction rate, late-payment / NSF rate, and stable-employment percentage? A property-management company in the area should have these aggregated.
- How much new apartment / multifamily construction is in the pipeline within 1–3 miles? Heavy new supply (>2% of stock underway) typically softens rents 12–24 months out; light construction supports rent growth.
Investment metrics
- 1% rule
- 3.91% ✓
- Cap rate
- 35.07%
- Cash-on-cash
- 102.76%
- DSCR
- 5.57
- GRM
- 2.1
CMA / ARV
No comps found within radius.
Projected returns pro-forma
3.68% appreciation · 3.0% rent growth · sell at horizon
- IRR
- —
- Equity multiple
- 7.02×
- Total profit
- $134,603
- Equity at exit
- $39,026
- IRR
- —
- Equity multiple
- 14.62×
- Total profit
- $304,745
- Equity at exit
- $62,673
Cash invested: $22,372 (down + closing). Projections, not guarantees.
Landlord ↔ Tenant lean methodology
- Overall (STATE)
- 81 Strongly Landlord-Friendly
- State Missouri
- 81 Strongly Landlord-Friendly · R+10
- County
- — inherits STATE
- City
- — inherits STATE
ZIP-level market 63621
- Home prices YoY
- 2.1%
- Active inventory
- 12
- Price-to-rent
- 6.4×
Monthly cashflow live
- Estimated rent
- $3,124 medium interval (Pro) →
- Mortgage (P&I)
- −$419
- Tax est. 1.5%
- −$100 /mo · $1,198/yr
- Insurance
- −$33
- HOA
- −$0
- Vacancy / Maint / Mgmt
- −$656
- Net cashflow
- $1,916
Break-even live
3-unit breakdown (identical units grouped — click to expand)
| Units | Beds | Baths | Est. rent |
|---|---|---|---|
| 3× units | 2 | 2 | $3,123 |
| #1 | 2 | 2 | $1,041 |
| #2 | 2 | 2 | $1,041 |
| #3 | 2 | 2 | $1,041 |
| Total (3 units) | $3,124 | ||
UW: 25.0% down · 7.5% · 30yr · 1.5% tax · 5.0% vac · 8.0% maint · 8.0% mgmt
Financing live
Cash to close
- Down payment
- $19,975
- Closing costs
- $2,397
- Reserves months
- —
- Total cash needed
- —
Loan-product check · same deal, 3 products live
Conventional
25% down · 7.5% · 30yr
- Down + closing
- —
- Monthly P&I
- —
- Monthly cashflow
- —
- DSCR
- —
- Eligible?
- —
Personal DTI + credit; lowest rate.
DSCR
20% down · 8.5% · 30yr
- Down + closing
- —
- Monthly P&I
- —
- Monthly cashflow
- —
- DSCR
- —
- Eligible?
- —
No personal income docs; deal must DSCR.
Hard money
10% down · 12.0% · 12mo
- Down + closing
- —
- Monthly P&I
- —
- Monthly cashflow
- —
- DSCR
- —
- Eligible?
- —
Short-term bridge; refi at stabilization.
Listing history 2 events
-
2026-05-20$79,900 Active
-
2026-05-20historical $79,900
ⓘ Source: listings_history table (triggers on properties + properties_extension) + one-shot
backfill from property_details.listing_events for pre-trigger history.
Nearby sold comps map
Loading sold comps map…
Walkable amenities ~0.75 mi
Loading nearby amenities…
Taxation est. · year 1
- Rental income
- $37,488
- − Mortgage interest
- −$4,476
- − Property taxes
- −$1,198
- − Insurance
- −$400
- − Repairs & maintenance
- −$2,999
- − Management
- −$2,999
- − Depreciation
- −$2,324
- Taxable income
- $23,092
- Est. tax owed @ 24.0%
- −$5,542
- After-tax cash flow
- $17,447/yr
For passive investors: Depreciation is non-cash, so a rental often shows a tax loss while cash-flowing — sheltering income. Rental losses are passive: they offset passive income freely, and up to $25,000/yr can offset ordinary (W-2) income if you actively participate and your MAGI is under $100k (phasing out to $0 by $150k); unused losses carry forward. On sale, claimed depreciation is recaptured at up to 25%, and gains may owe capital-gains tax (a 1031 exchange can defer both). Figures are a year-1 estimate at your 24.0% rate — not tax advice; consult a CPA.
Condition & rehab AI · 11 photos
This multi-family property is in the process of being renovated. The kitchen and bathrooms are under construction, requiring major repairs and updates to complete the spaces. Once finished, the property will be move-in ready and highly valuable for both resale and rental purposes.
Repairs flagged
- Major Exposed framing in kitchen and bathrooms — Structural elements need to be completed
- Major Exposed subfloor in kitchen and bathrooms — Flooring needs to be installed
- Major Exposed drywall in kitchen and bathrooms — Painting and finishing needed
Value-add opportunities
- Both Complete kitchen cabinetry and flooring — Enhances both resale and rental value
- Both Paint and finish interior walls — Improves curb appeal and interior aesthetics
- Both Install bathroom fixtures and finishes — Completes the living spaces and enhances value
Renovation cost estimate screening
| Repair item | Severity | Est. cost |
|---|---|---|
| Exposed framing in kitchen and bathrooms · Structural elements need to be completed | Major | $15,000–50,000 |
| Exposed subfloor in kitchen and bathrooms · Flooring needs to be installed | Major | $15,000–50,000 |
| Exposed drywall in kitchen and bathrooms · Painting and finishing needed | Major | $15,000–50,000 |
| Total estimated repair cost · 3 items | $45,000–150,000 |
Value-add ROI direction
- Both Complete kitchen cabinetry and flooring — Enhances both resale and rental value ↑
- Both Paint and finish interior walls — Improves curb appeal and interior aesthetics ↑
- Both Install bathroom fixtures and finishes — Completes the living spaces and enhances value ↑
ⓘ Cost ranges are severity-bucket heuristics (US national rule-of-thumb). Get contractor quotes + a written scope before underwriting a rehab budget.
Schools (NCES district)
- District
- Arcadia Valley R-II
- NCES district ID
- 2903150
- Math proficiency
- 42% ▼ -8.00%
- Reading proficiency
- 46% ▼ -6.00%
- Median HH income
- $34,573
- Composite
- 36.32/100
- National rank
- #4693
- State rank
- #115 of 324 in MO
Livability — Arcadia
- Score
- 62/100
- State rank
- #372
- US rank
- #16486
Category grades
Schools grade is shown separately in the Schools card above.
Census & demographics
- Census place
- Arcadia, MO
- Population (ZIP)
- 1,656
Population outlook (Iron County) Hauer SSP2
- Today (2025)
- 9,245 people
- By 2030
- 8,745 · -5.4%
- By 2040
- 7,808 · -15.5%
- By 2050
- 6,944 · -24.9%
- By 2075
- 5,320 · -42.5%
- By 2100
- 4,245 · -54.1%
Race, ethnicity, and origin ACS 2023
- Neighborhood character
- Predominantly White (96%)
- Race & ethnicity
- White 96% Hispanic / Latino 2% Two or more races 2%
- Common ancestry
- Romanian 2% Lithuanian 2% Serbian 1%
Political lean MEDSL · Iron
- 2024 margin
- Solid R (+62.4) · D 18.2% · R 80.7% · Other 1.1%
- 2008→2024 swing
- -65.2pp toward R · 2008: 2.8pp · 2024: -62.4pp
- All cycles
- 2024: R+62.4 2020: R+57.7 2016: R+52.6 2012: R+14.5 2008: D+2.8
Not yet ingested
- Civics
- —
Market trends
- HPI YoY
- ▲ 3.68%
- Current HPI
- 178.9099
- Rent YoY
- —
- Metro
- —
- State GDP YoY
- ▲ 1.84%
- F500 in state
- 20
Industry mix (Fortune 500 HQ in MO)
| Industry | F500 HQs | Revenue |
|---|---|---|
| Healthcare | 1 | $163B |
|
||
| Insurance | 1 | $21B |
|
||
| Industrial Technology | 1 | $17B |
|
||
| Retail | 1 | $16B |
|
||
| Industrial Distribution | 1 | $10B |
|
||
| Utilities | 1 | $9B |
|
||
Price history
+0.0% since first listed2 events — show timeline
- 2026-05-20 Listed $79,900 MARIS as Distributed by MLS Grid
- 2026-05-20 Coming Soon $79,900 MARIS as Distributed by MLS Grid
Cash-flow waterfall
monthlySold comps — $/sqft
last 12 mo · ≤1 miLoading sold comps…