516 SW 14th St SW · Birmingham, AL
Flood risk 1/10 · Minimal
- FEMA flood zone
- X (unshaded)
- Chance of flooding over 30 yrs
- 0.0%
- Est. flood insurance / yr
- $507 – $1,088
Fire risk 1/10 · Minimal
- Est. fire insurance / yr
- $916 – $1,700
Heat risk 6/10 · Moderate
- Hot days now (above 106°F)
- 7 days/yr
- Hot days in 30 yrs
- 19 days/yr
Wind risk 6/10 · Moderate
- Chance of severe wind over 30 yrs
- 27.0%
Air-quality risk 4/10 · Minor
- Unhealthy air days now
- 5 days/yr
- Unhealthy air days in 30 yrs
- 5 days/yr
Risk factors via First Street. Map © Google.
Why this score? — see what drove the D grade
The composite is a weighted blend of 9 inputs, each scored 0–100. Each bar is that input's sub-score; the figure is the points it added to the 100-point composite (weight × sub-score).
- Cash flow +22.9/30.0
- DSCR +7.3/10.0
- 1% rule +5.5/10.0
- Livability +3.4/5.0
- Rent growth +2.5/5.0
- Condition / age +2.5/5.0
- Schools +0.9/10.0
- ARV discount +0.0/15.0
- Appreciation +0.0/10.0
$125,000
🖨 Deal sheet 📄 Offer letter ✓ Due diligence
Listing remarks MLS
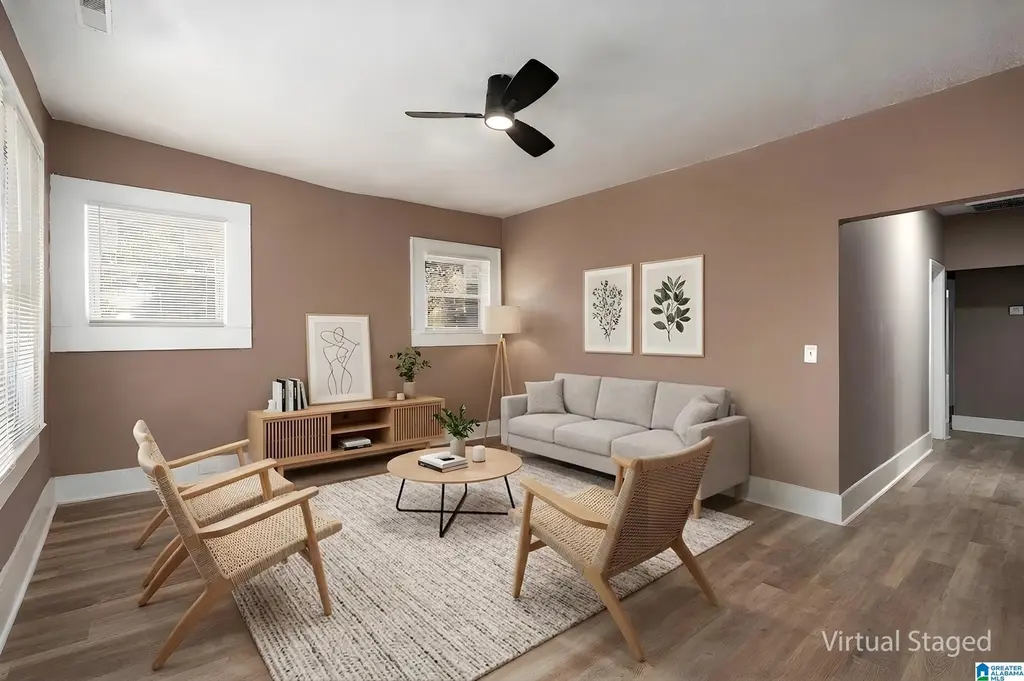
Fixer upper in need of the right investor.
Key facts
- New flooring
- New water heater
- New cabinets
Tags
Property features AI
Finance
- HOA & community: No association fees
Exterior
- Parking: Off-street parking
- Utilities: Public water; Connected sewer; Internet available (Spectrum & AT&T)
- Home design: Existing construction; Single-story living (rooms listed on main level)
- Construction: Wood siding; Crawl space foundation
- Exterior features: Front porch; City view; Corner lot; Sidewalks and street lights
Interior
- Kitchen: Stone countertops; Electric oven; Refrigerator
- Bedrooms: Five bedrooms (all on main level)
- Flooring: Hardwood laminate floors
- Bathrooms: Two full bathrooms; Separate shower in at least one bathroom; Tub/shower combo in at least one bathroom
- Heating & cooling: Central heating; Central cooling
- Interior features: Smooth ceilings; All window treatments remain
- Laundry & utility: Main-level laundry room; Washer hookup; Electric dryer hookup; Electric water heater
Neighborhood map
What this means for you Summary
Snapshot
- This is a 3-bed/1.0-bath single-family listed at $125k.
Deal economics
- At list price, monthly cash flow is $219 ($3k/yr) — positive.
- The deal already cash-flows at list — no discount required.
- Meets the 1% rule at list price ($1k rent vs $125k).
- Recommended offer: $123k (1.5% below list) — sets the bar for market timing.
- Cap rate 8.4% vs local median 6.2% in Birmingham — top-decile yield for the area; either an underpriced asset or a hidden risk that comps aren't pricing in. Stress-test before assuming the spread holds.
Location & tenants
- Location reads 67/100 on livability (#78 in AL) — a middle-class / working-renter tenant base. Strengths: commute A+, cost of living A+, housing A+; Watch: amenities C-, crime F, employment F.
- Birmingham City (urban): math 4% / reading 20% proficiency, ranked #116 of 129 in AL (top 90%) — low school quality limits family demand, transient renter base, plan for 1-2y turnover; 82% free/reduced lunch — lower-income household profile, screen leases tightly.
- Zoned schools: Hemphill Elementary School (math 5% / reading 24%, grade F, #508 of 627 statewide, top 84%, 336 students, 87% FRL); Parker High School (math 2% / reading 2%, grade F, #291 of 305 statewide, top 100%, 826 students, 90% FRL).
- Market conditions: Rents soft (-0.0%/yr); 152 active listings in the ZIP; 40 comparable units currently listed for rent nearby; rentals at typical pace (median 24d on market — plan ~3-4 weeks tenant-placement turnaround); 42% of comp listings sitting > 30 days — soft ceiling on asking rent; lower-income renter base — watch delinquency; 2,114 units permitted in Jefferson County in 2024 (556 in 5+ unit buildings).
- At $1,309/mo this rent would consume 45% of the median local household income ($35k/yr) (locally 2161% of renters already pay >50% of income on rent) — very limited rent-growth headroom before tenants either downsize or default.
Forward outlook
- Local home prices are declining (-3.0%/yr); year-one equity from $864 of loan paydown is wiped out by about $4k of value loss. Plan a longer hold.
- Jefferson County population projected to shrink 4% by 2050 — rents likely to lag national; underwrite the cash flow, not the appreciation.
Negotiation context
- It's been on market 15 days — a 2% lower offer ($123k) is reasonable based on typical stale-listing flexibility.
- 6 sale attempts since 5y ago with the ask held roughly flat each time — persistent listings suggest the price (not the market) is what's stuck; bring a comps-based counter.
- Current owner paid $47k; list at $125k implies a 166% gain — meaningful room to come down on a strong offer.
Risks & watch-outs
- Watch-outs: built in 1935 — expect roof / HVAC / electrical / plumbing capex.
- Climate carrying-cost: major wind risk, 27% chance of damaging wind over 30y; extreme-heat days projected 7→19/yr by 2055 (HVAC capex compounding) — expect insurance premiums to compound above CPI over the hold.
Questions for the listing agent
- Built in 1935 — when were the roof, HVAC, electrical panel, plumbing, and water heater last replaced?
- Is there a deadline driving the sale (1031 exchange, divorce, estate, relocation)? That informs how much negotiation room exists.
- Schools are F-rated, which usually means shorter tenancies and higher turnover. Who's the typical renter profile here, and what's been the actual vacancy rate?
- Crime grade is F in this area — have there been break-ins, vandalism, or insurance claims at this property in the last 3 years? What carrier currently insures it and at what premium?
- The area grade is low — what's the realistic commute time and amenity access for the typical tenant pool here? Any planned neighborhood developments (good or bad) we should know about?
- What's the average days-on-market for RENTAL listings here right now (not sales)? A rising rental-DOM trend means longer vacancies and softer asking-rent achievability than the comps imply.
- What's the recent tenant-quality profile in this submarket — average credit score on applications, eviction rate, late-payment / NSF rate, and stable-employment percentage? A property-management company in the area should have these aggregated.
- How much new for-sale + rental construction is in the pipeline within 1–3 miles? Heavy new supply typically softens prices + rents 12–24 months out; constrained supply supports both.
Investment metrics
- 1% rule
- 1.05% ✓
- Cap rate
- 8.40%
- Cash-on-cash
- 7.51%
- DSCR
- 1.33
- GRM
- 8.0
CMA / ARV
- ARV (on-the-fly)
- $85,568
- Comps found
- 12
Show comp detail 12 sales within ~0.75 mi
| Address | Dist | Beds/Ba | Sqft | Sold | Price | $/sf | Match |
|---|---|---|---|---|---|---|---|
| 412 SW 12th St | 0.26mi | 3/1.0 | 1,526 (-0%) | 8mo | $59,000 | $39 | 81 |
| 1437 Woodland Ave SW | 0.23mi | 3/1.0 | 1,369 (-10%) | 5mo | $53,000 | $39 | 68 |
| 430 12th St SW | 0.24mi | 3/2.0 | 1,408 (-8%) | 7mo | $140,000 | $99 | 66 |
| 1700 Lee Ave SW | 0.58mi | 3/2.0 | 1,586 (+4%) | 0mo | $177,000 | $112 | 63 |
| 1125 Fulton Ave SW | 0.31mi | 3/1.0 | 1,332 (-13%) | 8mo | $75,000 | $56 | 58 |
| 1629 Steiner Ave SW | 0.62mi | 2/1.0 (-1) | 1,476 (-3%) | 8mo | $72,000 | $49 | 54 |
| 1241 15th St SW | 0.74mi | 3/2.0 | 1,443 (-6%) | 1mo | $102,000 | $71 | 51 |
| 1201 SW 15th St | 0.64mi | 3/2.5 | 1,472 (-4%) | 10mo | $162,000 | $110 | 50 |
| 1125 SW 15th St | 0.55mi | 3/2.0 | 1,684 (+10%) | 7mo | $139,000 | $83 | 47 |
| 1728 Princeton Ave SW | 0.63mi | 3/1.0 | 1,334 (-13%) | 10mo | $63,500 | $48 | 42 |
| 1204 15th Way SW | 0.70mi | 3/1.5 | 1,715 (+12%) | 11mo | $81,000 | $47 | 36 |
| 1424 2nd Ave W | 0.74mi | 2/1.0 (-1) | 1,744 (+14%) | 6mo | $19,000 | $11 | 32 |
Match score weights: distance 35% · size 25% · config 20% · recency 20%. Top-matched comps best support the ARV.
Projected returns pro-forma
-3.0% appreciation · 0.0% rent growth · sell at horizon
- IRR
- -8.1%
- Equity multiple
- 0.71×
- Total profit
- $-10,145
- Equity at exit
- $18,638
- IRR
- -2.8%
- Equity multiple
- 0.84×
- Total profit
- $-5,733
- Equity at exit
- $10,808
Cash invested: $35,000 (down + closing). Projections, not guarantees.
Landlord ↔ Tenant lean methodology
- Overall (STATE)
- 90 Strongly Landlord-Friendly
- State Alabama
- 90 Strongly Landlord-Friendly · R+15
- County
- — inherits STATE
- City
- — inherits STATE
ZIP-level market 35211
- Rents YoY
- -0.0%
- Active inventory
- 152
- Price-to-rent
- 8.0×
Monthly cashflow live
- Estimated rent
- $1,309 high interval (Pro) →
- Mortgage (P&I)
- −$656
- Tax from tax record
- −$108 /mo · $1,292/yr
- Insurance
- −$52
- HOA
- −$0
- Vacancy / Maint / Mgmt
- −$275
- Net cashflow
- $219
Break-even live
UW: 25.0% down · 7.5% · 30yr · 1.5% tax · 5.0% vac · 8.0% maint · 8.0% mgmt
Financing live
Cash to close
- Down payment
- $31,250
- Closing costs
- $3,750
- Reserves months
- —
- Total cash needed
- —
Loan-product check · same deal, 3 products live
Conventional
25% down · 7.5% · 30yr
- Down + closing
- —
- Monthly P&I
- —
- Monthly cashflow
- —
- DSCR
- —
- Eligible?
- —
Personal DTI + credit; lowest rate.
DSCR
20% down · 8.5% · 30yr
- Down + closing
- —
- Monthly P&I
- —
- Monthly cashflow
- —
- DSCR
- —
- Eligible?
- —
No personal income docs; deal must DSCR.
Hard money
10% down · 12.0% · 12mo
- Down + closing
- —
- Monthly P&I
- —
- Monthly cashflow
- —
- DSCR
- —
- Eligible?
- —
Short-term bridge; refi at stabilization.
Rent comps 40 comps
| Address | Beds | Baths | Sqft | Rent | $/sqft | DOM | Units | Dist |
|---|---|---|---|---|---|---|---|---|
| 1501 Princeton Ave SW Birmingham, AL | 3.0 | 2.0 | 1260 | $1,350 | $1.07 | 44d | 1 | 0.10mi |
| 1437 Woodland Ave SW Birmingham, AL | 3.0 | 1.0 | 1369 | $1,100 | $0.80 | 3d | 1 | 0.23mi |
| 1217 Fulton Ave SW Birmingham, AL | 4.0 | 2.0 | 1397 | $1,395 | $1.00 | 43d | 1 | 0.24mi |
| 1213 Alabama Ave SW Birmingham, AL | 4.0 | 2.0 | 1616 | $1,200 | $0.74 | 43d | 1 | 0.27mi |
| 1220 Alabama Ave SW Birmingham, AL | 3.0 | 1.5 | 1175 | $1,350 | $1.15 | 43d | 1 | 0.28mi |
| 1645 Woodland Ave SW Birmingham, AL | 4.0 | 2.0 | 1298 | $1,300 | $1.00 | 19d | 1 | 0.39mi |
| 405 11th St SW Unit B Birmingham, AL | 2.0 | 1.0 | 1065 | $800 | $0.75 | 43d | 1 | 0.43mi |
| 504 Francis Pl SW Birmingham, AL | 3.0 | 2.0 | 1816 | $1,223 | $0.67 | 23d | 1 | 0.48mi |
| 1012 Cotton Ave SW Birmingham, AL | 3.0 | 1.0 | 1232 | $1,000 | $0.81 | 43d | 1 | 0.50mi |
| 1800 Woodland Ave SW Birmingham, AL | 4.0 | 1.0 | 1411 | $1,195 | $0.85 | 1d | 1 | 0.52mi |
| 1609 Jefferson Ave SW Birmingham, AL | 4.0 | 1.0 | 1572 | $1,300 | $0.83 | 3d | 1 | 0.57mi |
| 1136 15th St SW Birmingham, AL | 4.0 | 2.0 | 1296 | $1,395 | $1.08 | 23d | 1 | 0.57mi |
| 1728 Princeton Ave SW Birmingham, AL | 4.0 | 2.0 | 1334 | $1,300 | $0.97 | 43d | 1 | 0.60mi |
| 1734 Lee Ave SW Birmingham, AL | 4.0 | 1.0 | 1142 | $1,150 | $1.01 | 19d | 1 | 0.62mi |
| 1816 Saint Charles Ave SW Birmingham, AL | 3.0 | 1.0 | 1395 | $1,295 | $0.93 | 23d | 1 | 0.63mi |
| 1620 Alemeda Ave SW Birmingham, AL | 3.0 | 2.0 | 1314 | $1,295 | $0.99 | 1d | 1 | 0.64mi |
| 1204 15th Way SW Birmingham, AL | 4.0 | 3.0 | 1715 | $1,400 | $0.82 | 43d | 1 | 0.68mi |
| 1233 15th Way SW Birmingham, AL | 3.0 | 1.0 | 1119 | $1,050 | $0.94 | 43d | 1 | 0.73mi |
| 1000 17th Pl SW Birmingham, AL | 3.0 | 2.0 | 1200 | $1,275 | $1.06 | 19d | 1 | 0.75mi |
| 1256 15th St SW Birmingham, AL | 3.0 | 1.0 | 1206 | $1,300 | $1.08 | 2d | 1 | 0.76mi |
| 719 Washington Ave SW Birmingham, AL | 3.0 | 1.0 | 1064 | $950 | $0.89 | 11d | 1 | 0.78mi |
| 1698 Dennison Ave SW Birmingham, AL | 4.0 | 2.0 | 1780 | $1,300 | $0.73 | 43d | 1 | 0.82mi |
| 1900 Saint Charles Ave SW Birmingham, AL | 4.0 | 2.0 | 1623 | $1,350 | $0.83 | 1d | 1 | 0.82mi |
| 1621 2nd Ct W Birmingham, AL | 3.0 | 1.0 | 1074 | $1,095 | $1.02 | 43d | 1 | 0.85mi |
| 1332 15th Pl SW Birmingham, AL | 2.0 | 1.0 | 1115 | $950 | $0.85 | 3d | 1 | 0.86mi |
| 644 Alabama Ave SW Birmingham, AL | 3.0 | 1.0 | 1274 | $1,125 | $0.88 | 23d | 1 | 0.87mi |
| 1933 Saint Charles Ct SW Birmingham, AL | 3.0 | 1.0 | 1106 | $1,050 | $0.95 | 23d | 1 | 0.91mi |
| 608 Fulton Ave SW Birmingham, AL | 3.0 | 1.0 | 1271 | $1,300 | $1.02 | 43d | 1 | 0.95mi |
| 1408 16th St SW Birmingham, AL | 3.0 | 2.0 | 2076 | $1,150 | $0.55 | 43d | 1 | 0.96mi |
| 1108 4th Ct W Birmingham, AL | 3.0 | 2.0 | 1623 | $1,125 | $0.69 | 2d | 1 | 1.00mi |
| 2709 30th Street Ensley Birmingham, AL | 4.0 | 2.0 | 1410 | $1,323 | $0.94 | 1d | 1 | 1.04mi |
| 2920 24th Street Ensley Unit ENSLEY Birmingham, AL | 3.0 | 2.0 | 1800 | $1,050 | $0.58 | 23d | 1 | 1.04mi |
| 1230 4th Ter W Birmingham, AL | 3.0 | 2.0 | 1540 | $1,000 | $0.65 | 43d | 1 | 1.06mi |
| 2026 Lee Ct SW Birmingham, AL | 3.0 | 1.0 | 1204 | $1,100 | $0.91 | 43d | 1 | 1.06mi |
| 2309 Eufaula Ave Birmingham, AL | 4.0 | 2.0 | 1454 | $1,395 | $0.96 | 23d | 1 | 1.07mi |
| 2304 Eufaula Ave Birmingham, AL | 3.0 | 1.0 | 1381 | $980 | $0.71 | 43d | 1 | 1.09mi |
| 1701 4th Ter W Birmingham, AL | 4.0 | 2.5 | 1977 | $1,550 | $0.78 | 23d | 1 | 1.11mi |
| 724 4th Ct W Birmingham, AL | 3.0 | 1.0 | 1300 | $930 | $0.72 | 43d | 1 | 1.11mi |
| 1119 Graymont Ave W Birmingham, AL | 3.0 | 1.0 | 1260 | $1,073 | $0.85 | 1d | 1 | 1.18mi |
| 2712 24th Street Ensley Unit ENSLEY Birmingham, AL | 3.0 | 1.0 | 1232 | $1,099 | $0.89 | 23d | 1 | 1.20mi |
Listing history 11 events
-
2026-06-17status $125,000 Pending 15 DOM
-
2026-06-17days on market $125,000 Active 15 DOM
-
2026-06-16days on market $125,000 Active 14 DOM
-
2026-06-15days on market $125,000 Active 13 DOM
-
2026-06-13days on market $125,000 Active 11 DOM
-
2026-06-10days on market $125,000 Active 8 DOM
-
2026-06-09days on market $125,000 Active 7 DOM
-
2026-06-08days on market $125,000 Active 6 DOM
-
2026-06-07days on market $125,000 Active 5 DOM
-
2026-06-02remarks 693-char remark
-
2026-06-02$125,000 Active 1 DOM
ⓘ Source: listings_history table (triggers on properties + properties_extension) + one-shot
backfill from property_details.listing_events for pre-trigger history.
Tax reassessment forecast AL · Resets to sale price
- Current annual tax
- $1,292 · $108/mo
- Projected year-2 tax
- $1,292 · $108/mo
- Expected delta
- $0/yr ($0/mo · 0.0%)
ⓘ Screening estimate from a state-policy table — verify with the county assessor before closing.
Climate risk First Street
- Flood 1/10 Low FEMA zone X (unshaded) · 0% chance over 30 yrs
- Wildfire 1/10 Low
- Heat 6/10 Major 7 d/yr ≥106°F today · 19 d/yr by 30 yrs out
- Wind 6/10 Major 27% chance of damaging wind over 30 yrs
- Air quality 4/10 Moderate 5 unhealthy d/yr today · 5 by 30 yrs out
Nearby sold comps map
Loading sold comps map…
Walkable amenities ~0.75 mi
Loading nearby amenities…
Taxation est. · year 1
- Rental income
- $15,712
- − Mortgage interest
- −$7,002
- − Property taxes
- −$1,292
- − Insurance
- −$625
- − Repairs & maintenance
- −$1,257
- − Management
- −$1,257
- − Depreciation
- −$3,636
- Taxable income
- $643
- Est. tax owed @ 24.0%
- −$154
- After-tax cash flow
- $2,475/yr
For passive investors: Depreciation is non-cash, so a rental often shows a tax loss while cash-flowing — sheltering income. Rental losses are passive: they offset passive income freely, and up to $25,000/yr can offset ordinary (W-2) income if you actively participate and your MAGI is under $100k (phasing out to $0 by $150k); unused losses carry forward. On sale, claimed depreciation is recaptured at up to 25%, and gains may owe capital-gains tax (a 1031 exchange can defer both). Figures are a year-1 estimate at your 24.0% rate — not tax advice; consult a CPA.
Schools (NCES district)
- District
- Birmingham City
- NCES district ID
- 0100390
- Math proficiency
- 4% ▼ -17.00%
- Reading proficiency
- 20% ▼ -4.00%
- Median HH income
- $31,988
- Composite
- 9.49/100
- National rank
- #9850
- State rank
- #116 of 129 in AL
Livability — Birmingham
- Score
- 67/100
- State rank
- #78
- US rank
- #10412
Category grades
Schools grade is shown separately in the Schools card above.
Census & demographics
- Census place
- Birmingham, AL
- County
- Jefferson County · 527,445 people
- City population
- 210,422
- Metro
- Birmingham-Hoover, AL
- Population (ZIP)
- 24,924
- Household income
- $34,884
- Rent vs Own
- Severe rent burden
- 2161.0
Population outlook (Jefferson County) Hauer SSP2
- Today (2025)
- 669,185 people
- By 2030
- 669,694 · +0.1%
- By 2040
- 661,388 · -1.2%
- By 2050
- 643,086 · -3.9%
- By 2075
- 577,267 · -13.7%
- By 2100
- 474,758 · -29.1%
Race, ethnicity, and origin ACS 2023
- Neighborhood character
- Predominantly Black (77%)
- Race & ethnicity
- Black 77% White 10% Hispanic / Latino 10% Two or more races 4%
- Hispanic origin (detail)
- Mexican 7%
- Foreign-born
- 6% · Canada
- Languages at home
- 91% English-only · Spanish 8% French/Haitian/Cajun 1%
Political lean MEDSL · Jefferson
- 2024 margin
- D (+10.4) · D 54.6% · R 44.2% · Other 1.2%
- 2008→2024 swing
- +5.4pp toward D · 2008: 5.1pp · 2024: 10.4pp
- All cycles
- 2024: D+10.4 2020: D+13.2 2016: D+7.2 2012: D+6.0 2008: D+5.1
Not yet ingested
- Civics
- —
Market trends
- HPI YoY
- ▼ -49.29%
- Current HPI
- 91.2903
- Rent YoY
- ▬ -0.01%
- Metro
- Birmingham-Hoover, AL
- State GDP YoY
- ▲ 2.94%
- F500 in state
- 4
Industry mix (Fortune 500 HQ in AL)
| Industry | F500 HQs | Revenue |
|---|---|---|
| Financial Services | 1 | $8B |
|
||
| Healthcare | 1 | $5B |
|
||
Price history
+127.3% since first listed16 events — show timeline
- 2026-06-02 Listed $125,000 Greater Alabama MLS
- 2026-03-25 Rental Removed $1,450 GALMLS
- 2025-11-21 Listed for Rent $1,450 GALMLS
- 2025-04-23 Sold (Public Records) $47,000 Public Records
- 2025-04-18 Sold (MLS) $47,000 Greater Alabama MLS
- 2025-04-11 Pending — Greater Alabama MLS
- 2025-03-19 Price Changed $65,000 Greater Alabama MLS
- 2025-03-10 Listed $69,000 Greater Alabama MLS
- 2022-08-03 Sold (MLS) $48,300 Greater Alabama MLS
- 2022-07-28 Sold (Public Records) $145,000 Public Records
- 2022-07-05 Pending — Greater Alabama MLS
- 2022-05-16 Relisted — Greater Alabama MLS
- 2022-02-13 Contingent — Greater Alabama MLS
- 2022-01-31 Relisted — Greater Alabama MLS
- 2022-01-17 Contingent — Greater Alabama MLS
- 2021-07-19 Listed $55,000 Greater Alabama MLS
Property tax history
+4.5%/yrLatest (2025): $1,292 · +0.0% YoY. Source: county tax records.
Cash-flow waterfall
monthlySold comps — $/sqft
last 12 mo · ≤1 miLoading sold comps…