 Fourplex
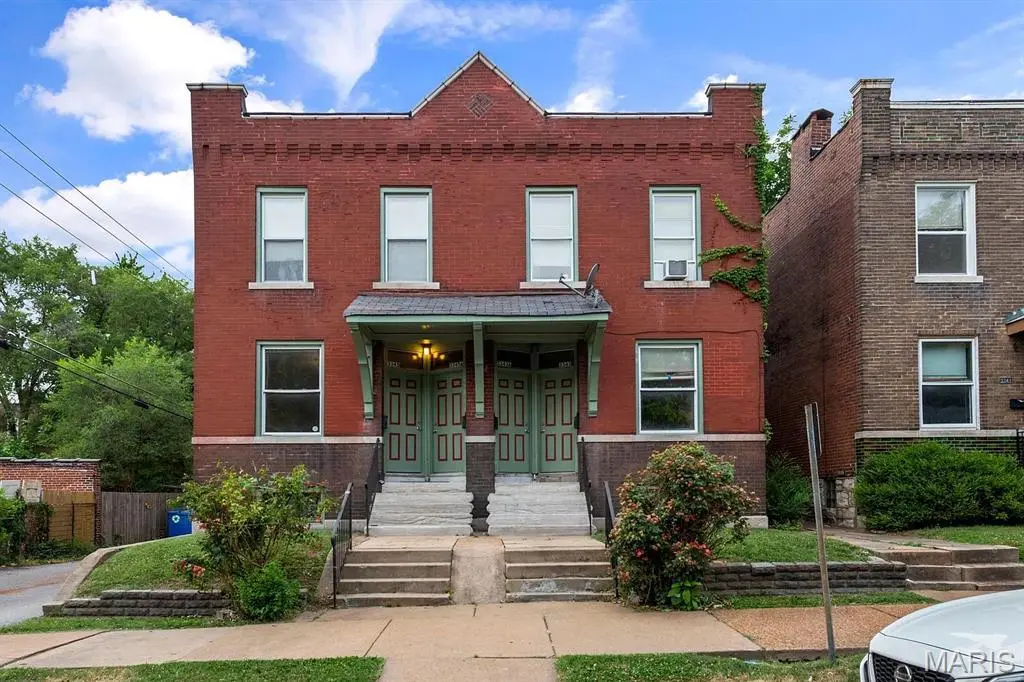
3343 Virginia Ave · St. Louis, MO
Flood risk 6/10 · Moderate
- FEMA flood zone
- X (unshaded)
- Chance of flooding over 30 yrs
- 0.74%
- Est. flood insurance / yr
- $473 – $860
Fire risk 1/10 · Minimal
- Est. fire insurance / yr
- $1,054 – $1,958
Heat risk 5/10 · Moderate
- Hot days now (above 108°F)
- 7 days/yr
- Hot days in 30 yrs
- 21 days/yr
Wind risk 2/10 · Minimal
- Chance of severe wind over 30 yrs
- 1.0%
Air-quality risk 3/10 · Minor
- Unhealthy air days now
- 3 days/yr
- Unhealthy air days in 30 yrs
- 4 days/yr
Risk factors via First Street. Map © Google.
Why this score? — see what drove the B- grade
The composite is a weighted blend of 9 inputs, each scored 0–100. Each bar is that input's sub-score; the figure is the points it added to the 100-point composite (weight × sub-score).
- Cash flow +30.0/30.0
- 1% rule +10.0/10.0
- DSCR +10.0/10.0
- ARV discount +7.6/15.0
- Rent growth +3.7/5.0
- Livability +2.5/5.0
- Condition / age +2.5/5.0
- Schools +1.2/10.0
- Appreciation +0.0/10.0
$304,900
🖨 Deal sheet (PDF) 📄 Offer letter ✓ Due diligence
Multi-family units
County records classify this as Multi-Family (2-4 Unit). Listing-text estimate: 4 units. confirmed
Listing remarks MLS
Outstanding investment opportunity to add to your real estate portfolio in Benton Park West. This brick 4-family building is just steps from the vibrant energy of Cherokee Street. Each of the four oversized units features historic charm with tall ceilings, spacious rooms, and large kitchens with pantries. Private rear decks for every unit and a prime location near public transit and walkability to shops and restaurants. Investors will appreciate the extensive capital improvements.
Key facts
- Public transit
- Private rear decks
- Walkability to shops
Tags
Neighborhood map
What this means for you Summary
Snapshot
- This is a 4 × 4-bed/4.0-bath units multifamily listed at $305k.
Deal economics
- At list price, monthly cash flow is $3k ($42k/yr) — positive. Per door: $875/mo.
- The deal already cash-flows at list — no discount required.
- Meets the 1% rule at list price ($7k rent vs $305k).
- Recommended offer: $287k (6.0% below list) — sets the bar for market timing.
- Cap rate 20.1% vs local median 5.0% in St. Louis — top-decile yield for the area; either an underpriced asset or a hidden risk that comps aren't pricing in. Stress-test before assuming the spread holds.
Location & tenants
- Location reads: area grade B — affects rentability + tenant quality, not the cash-flow math above.
- St. Louis City (urban): math 10% / reading 18% proficiency, ranked #312 of 324 in MO (top 96%) — low school quality limits family demand, transient renter base, plan for 1-2y turnover; 80% free/reduced lunch — lower-income household profile, screen leases tightly.
- Zoned schools: Nahed Chapman New American Aca (math 2% / reading 2%, grade F, #1,099 of 1,115 statewide, top 100%, 335 students, 99% FRL); Gateway Middle (math 0% / reading 8%, grade F, #389 of 391 statewide, top 100%, 506 students, 99% FRL); Roosevelt High (math 2% / reading 8%, grade F, #517 of 521 statewide, top 100%, 460 students, 99% FRL) — zoned schools average 99% FRL vs 80% district-wide (19 pts higher); higher-poverty schools than district average — tighter screening recommended.
- Market conditions: Rents rising fast (+4.9%/yr); 242 active listings in the ZIP; 294 units permitted in St. Louis city in 2024 (227 in 5+ unit buildings).
Forward outlook
- Local home prices are declining (-3.0%/yr); year-one equity from $2k of loan paydown is wiped out by about $9k of value loss. Plan a longer hold.
- St. Louis County population projected to shrink 6% by 2050 — rents likely to lag national; underwrite the cash flow, not the appreciation.
- At projected returns (-3.0% appreciation + 4.9% rent growth), your $85k cash investment doubles in ~3 years — after that, you're playing with house money.
Negotiation context
- It's been on market 68 days — a 6% lower offer ($287k) is reasonable based on typical stale-listing flexibility.
- 7 sale attempts since 10y ago with the ask held roughly flat each time — persistent listings suggest the price (not the market) is what's stuck; bring a comps-based counter.
- Current owner paid $185k; list at $305k implies a 65% gain — meaningful room to come down on a strong offer.
Risks & watch-outs
- Watch-outs: built in 1911 — expect roof / HVAC / electrical / plumbing capex.
- Climate carrying-cost: major flood risk; extreme-heat days projected 7→21/yr by 2055 (HVAC capex compounding) — expect insurance premiums to compound above CPI over the hold.
Questions for the listing agent
- It's been on market 68 days. Have you received any prior offers? Is the seller open to a 6% concession, seller financing, or rate buy-down credit?
- Can we see the unit-by-unit rent roll, current vacancy, and any below-market leases? What's the average tenancy length?
- What capital expenditures (roof, boiler, parking lot, exteriors) have been made in the last 5 years, and what's planned in the next 2?
- Built in 1911 — when were the roof, HVAC, electrical panel, plumbing, and water heater last replaced?
- Why hasn't it sold? Are there any deal-killer items the seller is aware of (foundation, flood, title, zoning, code violations)?
- Is there a deadline driving the sale (1031 exchange, divorce, estate, relocation)? That informs how much negotiation room exists.
- What's the average days-on-market for RENTAL listings here right now (not sales)? A rising rental-DOM trend means longer vacancies and softer asking-rent achievability than the comps imply.
- What's the recent tenant-quality profile in this submarket — average credit score on applications, eviction rate, late-payment / NSF rate, and stable-employment percentage? A property-management company in the area should have these aggregated.
- How much new apartment / multifamily construction is in the pipeline within 1–3 miles? Heavy new supply (>2% of stock underway) typically softens rents 12–24 months out; light construction supports rent growth.
Investment metrics
- 1% rule
- 2.21% ✓
- Cap rate
- 20.06%
- Cash-on-cash
- 49.17%
- DSCR
- 3.19
- GRM
- 3.8
CMA / ARV
- ARV (median comp)
- $305,861
- List price
- $304,900
- Delta
- -0.31%
- Verdict
- FAIR
- Comps
- 20 within 1.0 mi
Projected returns pro-forma
-3.0% appreciation · 4.89% rent growth · sell at horizon
- IRR
- 48.8%
- Equity multiple
- 3.18×
- Total profit
- $186,370
- Equity at exit
- $45,462
- IRR
- 55.1%
- Equity multiple
- 6.91×
- Total profit
- $504,522
- Equity at exit
- $26,362
Cash invested: $85,372 (down + closing). Projections, not guarantees.
Landlord ↔ Tenant lean methodology
- Overall (STATE)
- 81 Strongly Landlord-Friendly
- State Missouri
- 81 Strongly Landlord-Friendly · R+10
- County
- — inherits STATE
- City
- — inherits STATE
ZIP-level market 63118
- Rents YoY
- 4.9%
- Active inventory
- 242
- Price-to-rent
- 15.1×
Monthly cashflow live
- Estimated rent
- $6,733 high interval (Pro) →
- Mortgage (P&I)
- −$1,599
- Tax from tax record
- −$95 /mo · $1,138/yr
- Insurance
- −$127
- HOA
- −$0
- Vacancy / Maint / Mgmt
- −$1,414
- Net cashflow
- $3,498
Break-even live
Sensitivity live
| Price | -10% $3,671 | -5% $3,585 | +0% $3,498 | +5% $3,412 | +10% $3,326 |
|---|---|---|---|---|---|
| Rent | -10% $2,966 | -5% $3,232 | +0% $3,498 | +5% $3,764 | +10% $4,030 |
| Rate | -1.0pp $3,652 | -0.5pp $3,576 | base $3,498 | +0.5pp $3,419 | +1.0pp $3,339 |
4-unit breakdown (identical units grouped — click to expand)
| Units | Beds | Baths | Est. rent |
|---|---|---|---|
| 4× units | 4 | 4 | $6,732 |
| #1 | 4 | 4 | $1,683 |
| #2 | 4 | 4 | $1,683 |
| #3 | 4 | 4 | $1,683 |
| #4 | 4 | 4 | $1,683 |
| Total (4 units) | $6,733 | ||
UW: 25.0% down · 7.5% · 30yr · 1.5% tax · 5.0% vac · 8.0% maint · 8.0% mgmt
Financing live
Cash to close
- Down payment
- $76,225
- Closing costs
- $9,147
- Reserves months
- —
- Total cash needed
- —
Loan-product check · same deal, 3 products live
Conventional
25% down · 7.5% · 30yr
- Down + closing
- —
- Monthly P&I
- —
- Monthly cashflow
- —
- DSCR
- —
- Eligible?
- —
Personal DTI + credit; lowest rate.
DSCR
20% down · 8.5% · 30yr
- Down + closing
- —
- Monthly P&I
- —
- Monthly cashflow
- —
- DSCR
- —
- Eligible?
- —
No personal income docs; deal must DSCR.
Hard money
10% down · 12.0% · 12mo
- Down + closing
- —
- Monthly P&I
- —
- Monthly cashflow
- —
- DSCR
- —
- Eligible?
- —
Short-term bridge; refi at stabilization.
Listing history 46 events
-
2026-06-21days on market $304,900 Active 68 DOM
-
2026-06-18days on market $304,900 Active 65 DOM
-
2026-06-17days on market $304,900 Active 64 DOM
-
2026-06-16days on market $304,900 Active 63 DOM
-
2026-06-15days on market $304,900 Active 62 DOM
-
2026-06-13pricedays on market $304,900 Active 60 DOM
-
2026-06-09days on market $315,900 Active 56 DOM
-
2026-06-08days on market $315,900 Active 55 DOM
-
2026-06-08days on market $315,900 Active 54 DOM
-
2026-06-05days on market $315,900 Active 51 DOM
-
2026-06-03days on market $315,900 Active 50 DOM
-
2026-06-02days on market $315,900 Active 49 DOM
-
2026-06-01days on market $315,900 Active 48 DOM
-
2026-05-31days on market $315,900 Active 47 DOM
-
2026-05-08price $317,900 485-char remark
Show marketing remark (485 chars)
Outstanding investment opportunity to add to your real estate portfolio in Benton Park West. This brick 4-family building is just steps from the vibrant energy of Cherokee Street. Each of the four oversized units features historic charm with tall ceilings, spacious rooms, and large kitchens with pantries. Private rear decks for every unit and a prime location near public transit and walkability to shops and restaurants. Investors will appreciate the extensive capital improvements.
-
2026-04-30price $318,900 485-char remark
Show marketing remark (485 chars)
Outstanding investment opportunity to add to your real estate portfolio in Benton Park West. This brick 4-family building is just steps from the vibrant energy of Cherokee Street. Each of the four oversized units features historic charm with tall ceilings, spacious rooms, and large kitchens with pantries. Private rear decks for every unit and a prime location near public transit and walkability to shops and restaurants. Investors will appreciate the extensive capital improvements.
-
2026-04-14$319,900 Active 485-char remark
Show marketing remark (485 chars)
Outstanding investment opportunity to add to your real estate portfolio in Benton Park West. This brick 4-family building is just steps from the vibrant energy of Cherokee Street. Each of the four oversized units features historic charm with tall ceilings, spacious rooms, and large kitchens with pantries. Private rear decks for every unit and a prime location near public transit and walkability to shops and restaurants. Investors will appreciate the extensive capital improvements.
-
2026-04-14historical $319,900 485-char remark
Show marketing remark (485 chars)
Outstanding investment opportunity to add to your real estate portfolio in Benton Park West. This brick 4-family building is just steps from the vibrant energy of Cherokee Street. Each of the four oversized units features historic charm with tall ceilings, spacious rooms, and large kitchens with pantries. Private rear decks for every unit and a prime location near public transit and walkability to shops and restaurants. Investors will appreciate the extensive capital improvements.
-
2021-07-20soldstatus Closed 583-char remark
Show marketing remark (583 chars)
Fully Occupied Four family in Benton Park West! Less than a block from Cherokee Street. Walking distance to shopping and public transportation. HUGE one bedroom units with tall ceilings and hardwood floors throughout the main living area and bedroom. Large kitchens with pantries, private deck off the rear and tons of room for dining. Updated: windows, electric, furnaces, central AC, sewer stacks, and new roof overlay in 2015. You can either live in one unit and rent the others out or keep it fully occupied and start cash flowing immediately! Showings begin Thursday, June 24th!
-
2021-06-23status Pending 583-char remark
Show marketing remark (583 chars)
Fully Occupied Four family in Benton Park West! Less than a block from Cherokee Street. Walking distance to shopping and public transportation. HUGE one bedroom units with tall ceilings and hardwood floors throughout the main living area and bedroom. Large kitchens with pantries, private deck off the rear and tons of room for dining. Updated: windows, electric, furnaces, central AC, sewer stacks, and new roof overlay in 2015. You can either live in one unit and rent the others out or keep it fully occupied and start cash flowing immediately! Showings begin Thursday, June 24th!
-
2021-06-21$235,000 Active 583-char remark
Show marketing remark (583 chars)
Fully Occupied Four family in Benton Park West! Less than a block from Cherokee Street. Walking distance to shopping and public transportation. HUGE one bedroom units with tall ceilings and hardwood floors throughout the main living area and bedroom. Large kitchens with pantries, private deck off the rear and tons of room for dining. Updated: windows, electric, furnaces, central AC, sewer stacks, and new roof overlay in 2015. You can either live in one unit and rent the others out or keep it fully occupied and start cash flowing immediately! Showings begin Thursday, June 24th!
-
2020-10-28soldstatus $185,000
-
2020-10-09soldstatus Closed
-
2020-09-01status Pending
-
2020-08-26status Active
-
2020-08-17historical
-
2020-08-12price $182,000
-
2020-07-22$189,900 Active
-
2020-01-31price $189,900
-
2017-11-13soldstatus $127,500
-
2017-11-08soldstatus Closed
-
2017-10-12historical Contingent (No Kickout)
-
2017-10-04price $129,000
-
2017-09-27status Active
-
2017-09-25historical Contingent (No Kickout)
-
2017-09-20price $131,000
-
2017-09-06price $136,000
-
2017-08-24$145,000 Active
-
2016-12-29soldstatus Closed
-
2016-12-29soldstatus $121,000
-
2016-11-11status Pending
-
2016-10-29$125,000 Active
-
2004-07-15soldstatus $70,000
-
2000-02-28soldstatus $75,000
-
1999-02-11soldstatus $105,000
-
1998-12-16soldstatus
ⓘ Source: listings_history table (triggers on properties + properties_extension) + one-shot
backfill from property_details.listing_events for pre-trigger history.
Tax reassessment forecast MO · Resets to sale price
- Current annual tax
- $1,138 · $95/mo
- Projected year-2 tax
- $2,958 · $246/mo
- Expected delta
- +$1,820/yr (+$152/mo · 159.9%)
ⓘ Screening estimate from a state-policy table — verify with the county assessor before closing.
Climate risk First Street
- Flood 6/10 Major FEMA zone X (unshaded) · 74% chance over 30 yrs
- Wildfire 1/10 Low
- Heat 5/10 Major 7 d/yr ≥108°F today · 21 d/yr by 30 yrs out
- Wind 2/10 Low 100% chance of damaging wind over 30 yrs
- Air quality 3/10 Moderate 3 unhealthy d/yr today · 4 by 30 yrs out
Nearby sold comps map
Loading sold comps map…
Walkable amenities ~0.75 mi
Loading nearby amenities…
Taxation est. · year 1
- Rental income
- $80,796
- − Mortgage interest
- −$17,079
- − Property taxes
- −$1,138
- − Insurance
- −$1,524
- − Repairs & maintenance
- −$6,464
- − Management
- −$6,464
- − Depreciation
- −$8,870
- Taxable income
- $39,257
- Est. tax owed @ 24.0%
- −$9,422
- After-tax cash flow
- $32,557/yr
For passive investors: Depreciation is non-cash, so a rental often shows a tax loss while cash-flowing — sheltering income. Rental losses are passive: they offset passive income freely, and up to $25,000/yr can offset ordinary (W-2) income if you actively participate and your MAGI is under $100k (phasing out to $0 by $150k); unused losses carry forward. On sale, claimed depreciation is recaptured at up to 25%, and gains may owe capital-gains tax (a 1031 exchange can defer both). Figures are a year-1 estimate at your 24.0% rate — not tax advice; consult a CPA.
Schools (NCES district)
- District
- St. Louis City
- NCES district ID
- 2929280
- Math proficiency
- 10% ▼ -6.00%
- Reading proficiency
- 18% ▼ -3.00%
- Median HH income
- $35,685
- Composite
- 11.54/100
- National rank
- #9699
- State rank
- #312 of 324 in MO
Livability — St. Louis
No livability data for this city. (Only ~50 U.S. cities are tracked.)
Census & demographics
- Census place
- St. Louis, MO
- County
- Saint Louis City · 254,015 people
- City population
- 283,259
- Metro
- St. Louis, MO-IL
- Population (ZIP)
- 25,913
- Household income
- $57,762
- Rent vs Own
- Severe rent burden
- 1495.0
Population outlook (St. Louis County) Hauer SSP2
- Today (2025)
- 315,737 people
- By 2030
- 313,865 · -0.6%
- By 2040
- 305,439 · -3.3%
- By 2050
- 296,529 · -6.1%
- By 2075
- 271,028 · -14.2%
- By 2100
- 255,359 · -19.1%
Race, ethnicity, and origin ACS 2023
- Neighborhood character
- Diverse neighborhood (Simpson 0.63)
- Race & ethnicity
- White 44% Black 41% Two or more races 8% Hispanic / Latino 8% Asian 2%
- Hispanic origin (detail)
- Mexican 6%
- Common ancestry
- Slovak 2% Lithuanian 2% Romanian 2%
- Foreign-born
- 6% · Canada, Vietnam
- Languages at home
- 90% English-only · Spanish 5% Vietnamese 1% French/Haitian/Cajun 1%
Political lean MEDSL · St. Louis
- 2024 margin
- Solid D (+64.7) · D 81.4% · R 16.7% · Other 2.0%
- 2008→2024 swing
- -3.5pp toward R · 2008: 68.2pp · 2024: 64.7pp
- All cycles
- 2024: D+64.7 2020: D+66.2 2016: D+63.7 2012: D+66.6 2008: D+68.2
Not yet ingested
- Civics
- —
Market trends
- HPI YoY
- ▼ -347.51%
- Current HPI
- 171.5963
- Rent YoY
- ▲ 4.89%
- Metro
- St. Louis, MO-IL
- State GDP YoY
- ▲ 1.84%
- F500 in state
- 20
Industry mix (Fortune 500 HQ in MO)
| Industry | F500 HQs | Revenue |
|---|---|---|
| Healthcare | 1 | $163B |
|
||
| Insurance | 1 | $21B |
|
||
| Industrial Technology | 1 | $17B |
|
||
| Retail | 1 | $16B |
|
||
| Industrial Distribution | 1 | $10B |
|
||
| Utilities | 1 | $9B |
|
||
Price history
+202.8% since first listed32 events — show timeline
- 2026-05-08 Price Changed $317,900 MARIS as Distributed by MLS Grid
- 2026-04-30 Price Changed $318,900 MARIS as Distributed by MLS Grid
- 2026-04-14 Listed $319,900 MARIS as Distributed by MLS Grid
- 2026-04-14 Coming Soon $319,900 MARIS as Distributed by MLS Grid
- 2021-07-20 Sold (MLS) — MARIS as Distributed by MLS Grid
- 2021-06-23 Pending — MARIS as Distributed by MLS Grid
- 2021-06-21 Listed $235,000 MARIS as Distributed by MLS Grid
- 2020-10-28 Sold (Public Records) $185,000 Public Records
- 2020-10-09 Sold (MLS) — MARIS as Distributed by MLS Grid
- 2020-09-01 Pending — MARIS as Distributed by MLS Grid
- 2020-08-26 Relisted — MARIS as Distributed by MLS Grid
- 2020-08-17 Delisted — MARIS as Distributed by MLS Grid
- 2020-08-12 Price Changed $182,000 MARIS as Distributed by MLS Grid
- 2020-07-22 Listed $189,900 MARIS as Distributed by MLS Grid
- 2020-01-31 Price Changed $189,900 MARIS as Distributed by MLS Grid
- 2017-11-13 Sold (Public Records) $127,500 Public Records
- 2017-11-08 Sold (MLS) — MARIS as Distributed by MLS Grid
- 2017-10-12 Contingent — MARIS as Distributed by MLS Grid
- 2017-10-04 Price Changed $129,000 MARIS as Distributed by MLS Grid
- 2017-09-27 Relisted — MARIS as Distributed by MLS Grid
- 2017-09-25 Contingent — MARIS as Distributed by MLS Grid
- 2017-09-20 Price Changed $131,000 MARIS as Distributed by MLS Grid
- 2017-09-06 Price Changed $136,000 MARIS as Distributed by MLS Grid
- 2017-08-24 Listed $145,000 MARIS as Distributed by MLS Grid
- 2016-12-29 Sold (Public Records) $121,000 Public Records
- 2016-12-29 Sold (MLS) — MARIS as Distributed by MLS Grid
- 2016-11-11 Pending — MARIS as Distributed by MLS Grid
- 2016-10-29 Listed $125,000 MARIS as Distributed by MLS Grid
- 2004-07-15 Sold (Public Records) $70,000 Public Records
- 2000-02-28 Sold (Public Records) $75,000 Public Records
- 1999-02-11 Sold (Public Records) $105,000 Public Records
- 1998-12-16 Sold (Public Records) — Public Records
Property tax history
+6.6%/yrLatest (2024): $1,138 · +5.0% YoY. Source: county tax records.
Cash-flow waterfall
monthlySold comps — $/sqft
last 12 mo · ≤1 miLoading sold comps…