 Duplex
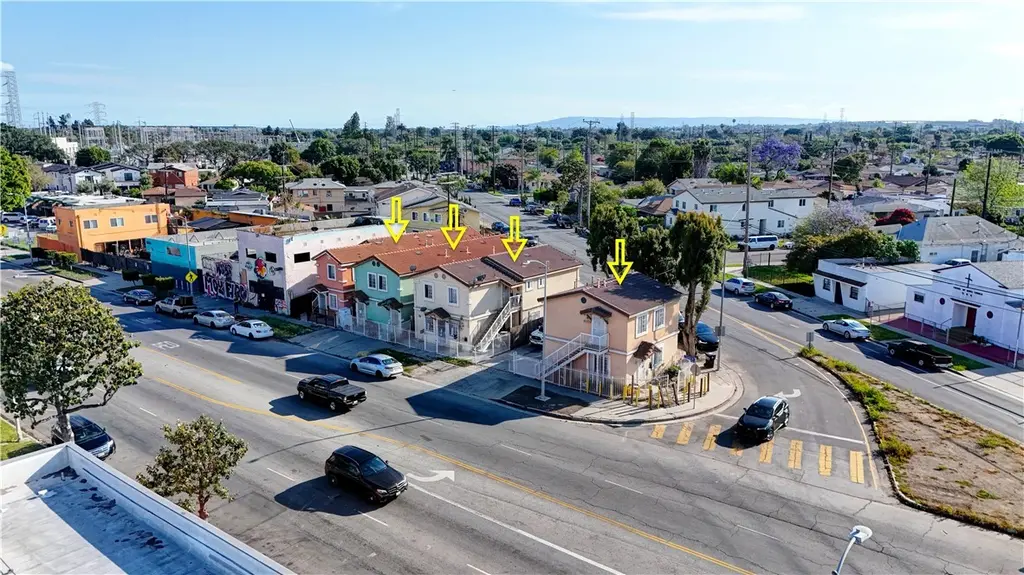
9201 S Central · Los Angeles, CA
Flood risk 3/10 · Minor
- FEMA flood zone
- X (unshaded)
- Chance of flooding over 30 yrs
- 0.2%
- Est. flood insurance / yr
- $507 – $1,088
Fire risk 1/10 · Minimal
- Est. fire insurance / yr
- $659 – $1,223
Heat risk 5/10 · Moderate
- Hot days now (above 90°F)
- 7 days/yr
- Hot days in 30 yrs
- 21 days/yr
Wind risk 1/10 · Minimal
- Chance of severe wind over 30 yrs
- —
Air-quality risk 5/10 · Moderate
- Unhealthy air days now
- 7 days/yr
- Unhealthy air days in 30 yrs
- 7 days/yr
Risk factors via First Street. Map © Google.
Why this score? — see what drove the D grade
The composite is a weighted blend of 9 inputs, each scored 0–100. Each bar is that input's sub-score; the figure is the points it added to the 100-point composite (weight × sub-score).
- ARV discount +12.1/15.0
- Cash flow +11.4/30.0
- Schools +3.6/10.0
- Livability +3.4/5.0
- DSCR +3.3/10.0
- 1% rule +2.8/10.0
- Rent growth +2.5/5.0
- Condition / age +2.5/5.0
- Appreciation +0.0/10.0
$599,999
🖨 Deal sheet (PDF) 📄 Offer letter ✓ Due diligence
Multi-family units
County records classify this as Multi-Family (2-4 Unit). Listing-text estimate: 2 units. confirmed
Listing remarks MLS
Exceptional investment opportunity with this newer construction duplex, built in 2008 and thoughtfully designed for both functionality and long-term rental appeal. Each unit features a well-proportioned 2-bedroom, 1-bath layout, offering comfortable living spaces that consistently attract quality tenants. The property’s modern build year provides added peace of mind with newer systems and reduced maintenance compared to older multifamily assets. Ideally situated in a central location, this property benefits from strong rental demand and convenient access to surrounding amenities, transportation corridors, shopping, and employment hubs, making it highly desirable for tenants and easy to keep occupied. Whether you are a seasoned investor or looking to begin building your portfolio, this is a low-maintenance, income-producing asset with excellent upside and long-term stability.
Key facts
- Modern build year
- Strong rental demand
- Central location
Tags
Neighborhood map
What this means for you Summary
Snapshot
- This is a 2 × 2-bed/1-bath units multifamily listed at $600k.
Deal economics
- At list price, monthly cash flow is $-210 ($-3k/yr) — negative. Per door: $-105/mo.
- To cash-flow at today's rent, offer at most $563k (6.2% below list).
- To meet the 1% rule (rent ≥ 1% of price), the offer needs to be $470k (21.6% below list).
- Recommended offer: $470k (21.6% below list) — sets the bar for 1% rule.
- Cap rate 5.9% vs local median 2.1% in Los Angeles — top-decile yield for the area; either an underpriced asset or a hidden risk that comps aren't pricing in. Stress-test before assuming the spread holds.
Location & tenants
- Location reads 68/100 on livability (#273 in CA) — a middle-class / working-renter tenant base. Strengths: amenities A+, commute A+, employment B; Watch: health & safety C-, crime F, cost of living F.
- Los Angeles Unified (urban): math 29% / reading 54% proficiency, ranked #223 of 517 in CA (top 43%) — families likely to look elsewhere, expect single-tenant / working-renter base with shorter leases; 67% free/reduced lunch — lower-income household profile, screen leases tightly.
- Zoned schools: Ninety-Ninth Street Elementary (472 students, 98% FRL); Charles Drew Middle (681 students, 99% FRL); Valley Academy of Arts And Sciences (math 22% / reading 52%, grade F, #578 of 1,170 statewide, top 51%, 868 students, 64% FRL) — zoned schools average 87% FRL vs 67% district-wide (20 pts higher); higher-poverty schools than district average — tighter screening recommended.
- Market conditions: 73 active listings in the ZIP; 40 comparable units currently listed for rent nearby; rentals lingering (median 46d on market — plan ~5-8 weeks vacancy on turnover, expect pricing pressure); 55% of comp listings sitting > 30 days — soft ceiling on asking rent; 19,697 units permitted in Los Angeles County in 2024 (9,426 in 5+ unit buildings).
- At $4,702/mo this rent would consume 96% of the median local household income ($59k/yr) (locally 2997% of renters already pay >50% of income on rent) — very limited rent-growth headroom before tenants either downsize or default.
Forward outlook
- Local home prices are declining (-3.0%/yr); year-one equity from $4k of loan paydown is wiped out by about $18k of value loss. Plan a longer hold.
- Los Angeles County population projected at +9% by 2050 — modest demand growth; plan on rents tracking national, not racing it.
Negotiation context
- It's been on market 72 days — a 6% lower offer ($564k) is reasonable based on typical stale-listing flexibility.
- 20 sale attempts since 13y ago with the ask held roughly flat each time — persistent listings suggest the price (not the market) is what's stuck; bring a comps-based counter.
- Current owner paid $435k; 38% above their basis — modest negotiation headroom, anchor on the comps not their cost.
Risks & watch-outs
- Climate carrying-cost: extreme-heat days projected 7→21/yr by 2055 (HVAC capex compounding) — expect insurance premiums to compound above CPI over the hold.
Questions for the listing agent
- What do current leases actually rent for vs. the listed asking? Can we see a recent rent roll and the last 12 months of T-12 income?
- It's been on market 72 days. Have you received any prior offers? Is the seller open to a 22% concession, seller financing, or rate buy-down credit?
- Can we see the unit-by-unit rent roll, current vacancy, and any below-market leases? What's the average tenancy length?
- What capital expenditures (roof, boiler, parking lot, exteriors) have been made in the last 5 years, and what's planned in the next 2?
- Why hasn't it sold? Are there any deal-killer items the seller is aware of (foundation, flood, title, zoning, code violations)?
- Is there a deadline driving the sale (1031 exchange, divorce, estate, relocation)? That informs how much negotiation room exists.
- Schools are D-rated, which usually means shorter tenancies and higher turnover. Who's the typical renter profile here, and what's been the actual vacancy rate?
- Crime grade is F in this area — have there been break-ins, vandalism, or insurance claims at this property in the last 3 years? What carrier currently insures it and at what premium?
- The area grade is low — what's the realistic commute time and amenity access for the typical tenant pool here? Any planned neighborhood developments (good or bad) we should know about?
- What's the average days-on-market for RENTAL listings here right now (not sales)? A rising rental-DOM trend means longer vacancies and softer asking-rent achievability than the comps imply.
- What's the recent tenant-quality profile in this submarket — average credit score on applications, eviction rate, late-payment / NSF rate, and stable-employment percentage? A property-management company in the area should have these aggregated.
- How much new apartment / multifamily construction is in the pipeline within 1–3 miles? Heavy new supply (>2% of stock underway) typically softens rents 12–24 months out; light construction supports rent growth.
Investment metrics
- 1% rule
- 0.78% ✗
- Cap rate
- 5.87%
- Cash-on-cash
- -1.50%
- DSCR
- 0.93
- GRM
- 10.6
CMA / ARV
- ARV (median comp)
- $668,758
- List price
- $599,999
- Delta
- -10.28%
- Verdict
- UNDERPRICED
- Comps
- 20 within 1.0 mi
Show comp detail 6 sales within ~0.75 mi
| Address | Dist | Beds/Ba | Sqft | Sold | Price | $/sf | Match |
|---|---|---|---|---|---|---|---|
| 1147 E 87th Pl | 0.43mi | 4/2.0 | 1,408 (+2%) | 18mo | $835,000 | $593 | 62 |
| 919 E 92nd St | 0.10mi | 4/2.0 | 1,178 (-15%) | 19mo | $600,000 | $509 | 54 |
| 854 E 87th Pl | 0.42mi | 4/2.0 | 1,558 (+13%) | 8mo | $610,000 | $392 | 53 |
| 936 E 91st St | 0.09mi | 3/2.0 (-1) | 1,218 (-12%) | 22mo | $660,000 | $542 | 52 |
| 8471 W Hooper Ave | 0.63mi | 4/2.0 | 1,578 (+14%) | 12mo | $825,000 | $523 | 38 |
| 1639 E 90th St | 0.70mi | 5/3.0 (+1) | 1,540 (+11%) | 18mo | $840,000 | $545 | 24 |
Match score weights: distance 35% · size 25% · config 20% · recency 20%. Top-matched comps best support the ARV.
Projected returns pro-forma
-3.0% appreciation · 3.0% rent growth · sell at horizon
- IRR
- -18.8%
- Equity multiple
- 0.34×
- Total profit
- $-110,682
- Equity at exit
- $89,462
- IRR
- -11.3%
- Equity multiple
- 0.32×
- Total profit
- $-113,888
- Equity at exit
- $51,877
Cash invested: $168,000 (down + closing). Projections, not guarantees.
Landlord ↔ Tenant lean methodology
- Overall (CITY)
- 0 Strongly Tenant-Friendly
- State California
- 18 Strongly Tenant-Friendly · D+13
- County
- — inherits STATE
- City Los Angeles
- 0 Strongly Tenant-Friendly · D+22
ZIP-level market 90002
- Active inventory
- 73
- Price-to-rent
- 21.3×
Monthly cashflow live
- Estimated rent
- $4,702 high interval (Pro) →
- Mortgage (P&I)
- −$3,146
- Tax from tax record
- −$528 /mo · $6,340/yr
- Insurance
- −$250
- HOA
- −$0
- Vacancy / Maint / Mgmt
- −$987
- Net cashflow
- $-210
Break-even live
Sensitivity live
| Price | -10% $129 | -5% $-40 | +0% $-210 | +5% $-380 | +10% $-550 |
|---|---|---|---|---|---|
| Rent | -10% $-582 | -5% $-396 | +0% $-210 | +5% $-25 | +10% $161 |
| Rate | -1.0pp $92 | -0.5pp $-58 | base $-210 | +0.5pp $-366 | +1.0pp $-524 |
2-unit breakdown (identical units grouped — click to expand)
| Units | Beds | Baths | Est. rent |
|---|---|---|---|
| 2× units | 2 | 1 | $4,702 |
| #1 | 2 | 1 | $2,351 |
| #2 | 2 | 1 | $2,351 |
| Total (2 units) | $4,702 | ||
UW: 25.0% down · 7.5% · 30yr · 1.5% tax · 5.0% vac · 8.0% maint · 8.0% mgmt
Financing live
Cash to close
- Down payment
- $150,000
- Closing costs
- $18,000
- Reserves months
- —
- Total cash needed
- —
Loan-product check · same deal, 3 products live
Conventional
25% down · 7.5% · 30yr
- Down + closing
- —
- Monthly P&I
- —
- Monthly cashflow
- —
- DSCR
- —
- Eligible?
- —
Personal DTI + credit; lowest rate.
DSCR
20% down · 8.5% · 30yr
- Down + closing
- —
- Monthly P&I
- —
- Monthly cashflow
- —
- DSCR
- —
- Eligible?
- —
No personal income docs; deal must DSCR.
Hard money
10% down · 12.0% · 12mo
- Down + closing
- —
- Monthly P&I
- —
- Monthly cashflow
- —
- DSCR
- —
- Eligible?
- —
Short-term bridge; refi at stabilization.
Rent comps 40 comps
| Address | Beds | Baths | Sqft | Rent | $/sqft | DOM | Units | Dist |
|---|---|---|---|---|---|---|---|---|
| 915 E 91st St Unit 915 Los Angeles, CA | 3.0 | 1.0 | 1800 | $3,200 | $1.78 | 45d | 1 | 0.18mi |
| 9310 Pace Ave Los Angeles, CA | 3.0 | 1.0 | 1254 | $3,200 | $2.55 | 45d | 1 | 0.18mi |
| 9312 Pace Ave Los Angeles, CA | 4.0 | 2.0 | 1798 | $4,000 | $2.22 | 45d | 1 | 0.18mi |
| 8715 Hooper Ave Unit 87195 Los Angeles, CA | 3.0 | 2.0 | 1050 | $3,490 | $3.32 | 45d | 1 | 0.48mi |
| 9017 Avalon Blvd Los Angeles, CA | 3.0 | 2.0 | 1234 | $3,000 | $2.43 | 45d | 1 | 0.56mi |
| 606 E 99th St Los Angeles, CA | 3.0 | 2.0 | 1798 | $3,650 | $2.03 | 1d | 1 | 0.62mi |
| 649 E 87th St Los Angeles, CA | 4.0 | 2.0 | 980 | $3,800 | $3.88 | 23d | 1 | 0.67mi |
| 639 E 87th St Los Angeles, CA | 3.0 | 1.0 | 900 | $3,650 | $4.06 | 7d | 1 | 0.68mi |
| 1536 E 87th Pl Los Angeles, CA | 5.0 | 3.0 | 1800 | $4,000 | $2.22 | 15d | 1 | 0.71mi |
| 8416 Hooper Ave Los Angeles, CA | 4.0 | 3.0 | 1600 | $3,350 | $2.09 | 45d | 1 | 0.73mi |
| 1000 E 84th St Los Angeles, CA | 5.0 | 3.0 | 1772 | $4,200 | $2.37 | 3d | 1 | 0.74mi |
| 8462 Zamora Ave Los Angeles, CA | 3.0 | 1.0 | 952 | $2,895 | $3.04 | 26d | 1 | 0.74mi |
| 1536 E 87th St Unit 87(1536B) Los Angeles, CA | 5.0 | 3.0 | 1800 | $4,000 | $2.22 | 12d | 1 | 0.75mi |
| 829 E 84th St Los Angeles, CA | 5.0 | 3.0 | 1854 | $3,900 | $2.10 | 45d | 1 | 0.79mi |
| 616 E 84th Pl Unit 616 Los Angeles, CA | 5.0 | 3.0 | 1800 | $3,200 | $1.78 | 26d | 1 | 0.82mi |
| 10527 Pace Ave Los Angeles, CA | 3.0 | 1.0 | 992 | $3,400 | $3.43 | 45d | 1 | 0.83mi |
| 909 E 83rd St Los Angeles, CA | 4.0 | 2.0 | 1400 | $3,888 | $2.78 | 45d | 1 | 0.84mi |
| 239 E 90th St Los Angeles, CA | 3.0 | 2.0 | 1260 | $3,295 | $2.62 | 12d | 1 | 0.85mi |
| 352 E 101st St Los Angeles, CA | 4.0 | 2.0 | 1275 | $3,500 | $2.75 | 45d | 1 | 0.85mi |
| 831 E 83rd St Los Angeles, CA | 5.0 | 3.0 | 1604 | $4,960 | $3.09 | 45d | 1 | 0.86mi |
| 218 E 95th St Unit 1/2 Los Angeles, CA | 3.0 | 2.0 | 991 | $3,350 | $3.38 | 45d | 1 | 0.88mi |
| 1631 E 85th St Los Angeles, CA | 5.0 | 3.0 | 1764 | $3,700 | $2.10 | 0d | 1 | 0.90mi |
| 1633 E 85th St Los Angeles, CA | 5.0 | 3.0 | 1764 | $3,700 | $2.10 | 1d | 1 | 0.90mi |
| 9197 Wall St Los Angeles, CA | 3.0 | 2.0 | 1250 | $3,500 | $2.80 | 45d | 1 | 0.90mi |
| 216 E 97th St Los Angeles, CA | 5.0 | 3.0 | 1753 | $3,800 | $2.17 | 45d | 1 | 0.91mi |
| 234 E 99th St Los Angeles, CA | 4.0 | 2.0 | 1275 | $3,850 | $3.02 | 45d | 1 | 0.92mi |
| 735 E 82nd St Los Angeles, CA | 3.0 | 2.0 | 913 | $3,400 | $3.72 | 45d | 1 | 0.95mi |
| 10524 S Avalon Blvd Unit 10524 Los Angeles, CA | 4.0 | 2.0 | 1200 | $2,695 | $2.25 | 45d | 1 | 0.95mi |
| 130 E 95th St Los Angeles, CA | 4.0 | 2.0 | 1275 | $3,500 | $2.75 | 22d | 1 | 0.97mi |
| 417 E 105th St Los Angeles, CA | 4.0 | 2.0 | 1600 | $3,900 | $2.44 | 7d | 1 | 0.97mi |
| 10218 S San Pedro St Los Angeles, CA | 3.0 | 3.0 | 1284 | $2,950 | $2.30 | 9d | 1 | 0.98mi |
| 245 E 102nd St Los Angeles, CA | 3.0 | 2.0 | 1074 | $2,900 | $2.70 | 45d | 1 | 0.98mi |
| 109 E 95th St Unit 4 Los Angeles, CA | 3.0 | 1.0 | 1000 | $2,887 | $2.89 | 45d | 1 | 1.00mi |
| 831 E 109th St Unit A Los Angeles, CA | 4.0 | 3.0 | 1588 | $3,500 | $2.20 | 45d | 1 | 1.02mi |
| 833 E 80th St Los Angeles, CA | 5.0 | 3.0 | 1850 | $3,700 | $2.00 | 5d | 1 | 1.03mi |
| 439 E 107th St Los Angeles, CA | 4.0 | 3.0 | 1643 | $3,850 | $2.34 | 9d | 1 | 1.04mi |
| 123 E 88th St Unit 1/2 Los Angeles, CA | 3.0 | 2.0 | 1156 | $3,550 | $3.07 | 45d | 1 | 1.05mi |
| 263 E 84th Pl Los Angeles, CA | 3.0 | 1.0 | 1450 | $2,950 | $2.03 | 16d | 1 | 1.05mi |
| 229 E 85th St Unit 231 12 Los Angeles, CA | 3.0 | 1.0 | 950 | $2,750 | $2.89 | 45d | 1 | 1.06mi |
| 1124 Nadeau St Los Angeles, CA | 3.0 | 1.5 | 1000 | $3,495 | $3.50 | 1d | 1 | 1.06mi |
Listing history 50 events
-
2026-06-21days on market $599,999 Active 72 DOM
-
2026-06-18days on market $599,999 Active 69 DOM
-
2026-06-17days on market $599,999 Active 68 DOM
-
2026-06-16days on market $599,999 Active 67 DOM
-
2026-06-15days on market $599,999 Active 66 DOM
-
2026-06-13days on market $599,999 Active 64 DOM
-
2026-06-09days on market $599,999 Active 60 DOM
-
2026-06-08days on market $599,999 Active 59 DOM
-
2026-06-07days on market $599,999 Active 58 DOM
-
2026-06-04days on market $599,999 Active 55 DOM
-
2026-06-03days on market $599,999 Active 54 DOM
-
2026-06-02days on market $599,999 Active 53 DOM
-
2026-06-01days on market $599,999 Active 52 DOM
-
2026-05-31days on market $599,999 Active 51 DOM
-
2026-04-10$599,999 Active 893-char remark
Show marketing remark (893 chars)
Exceptional investment opportunity with this newer construction duplex, built in 2008 and thoughtfully designed for both functionality and long-term rental appeal. Each unit features a well-proportioned 2-bedroom, 1-bath layout, offering comfortable living spaces that consistently attract quality tenants. The property’s modern build year provides added peace of mind with newer systems and reduced maintenance compared to older multifamily assets. Ideally situated in a central location, this property benefits from strong rental demand and convenient access to surrounding amenities, transportation corridors, shopping, and employment hubs, making it highly desirable for tenants and easy to keep occupied. Whether you are a seasoned investor or looking to begin building your portfolio, this is a low-maintenance, income-producing asset with excellent upside and long-term stability.
-
2020-11-01soldstatus $435,000 Sold 179-char remark
Show marketing remark (179 chars)
Seller is also selling the other duplex's located to the left of the property. 9201-9203 (2+1) $425K 9207-9209 (2+1, 3+2) $435K9211-9213 (3+2, 3+2) $550k9215-9217 (3+2, 3+2) $550k
-
2020-09-02soldstatus $450,500
-
2020-08-31historical
-
2020-08-24historical Backup Offers Accepted 179-char remark
Show marketing remark (179 chars)
Seller is also selling the other duplex's located to the left of the property. 9201-9203 (2+1) $425K 9207-9209 (2+1, 3+2) $435K9211-9213 (3+2, 3+2) $550k9215-9217 (3+2, 3+2) $550k
-
2020-04-06status Active 179-char remark
Show marketing remark (179 chars)
Seller is also selling the other duplex's located to the left of the property. 9201-9203 (2+1) $425K 9207-9209 (2+1, 3+2) $435K9211-9213 (3+2, 3+2) $550k9215-9217 (3+2, 3+2) $550k
-
2020-02-21historical Backup Offers Accepted 179-char remark
Show marketing remark (179 chars)
Seller is also selling the other duplex's located to the left of the property. 9201-9203 (2+1) $425K 9207-9209 (2+1, 3+2) $435K9211-9213 (3+2, 3+2) $550k9215-9217 (3+2, 3+2) $550k
-
2020-02-11price $425,000 179-char remark
Show marketing remark (179 chars)
Seller is also selling the other duplex's located to the left of the property. 9201-9203 (2+1) $425K 9207-9209 (2+1, 3+2) $435K9211-9213 (3+2, 3+2) $550k9215-9217 (3+2, 3+2) $550k
-
2020-02-11$475,000 Active 179-char remark
Show marketing remark (179 chars)
Seller is also selling the other duplex's located to the left of the property. 9201-9203 (2+1) $425K 9207-9209 (2+1, 3+2) $435K9211-9213 (3+2, 3+2) $550k9215-9217 (3+2, 3+2) $550k
-
2020-02-11$425,000
Show marketing remark (179 chars)
Seller is also selling the other duplex's located to the left of the property. 9201-9203 (2+1) $425K 9207-9209 (2+1, 3+2) $435K9211-9213 (3+2, 3+2) $550k9215-9217 (3+2, 3+2) $550k
-
2019-08-31historical Expired
-
2019-08-31historical
-
2019-05-09Active
-
2019-05-09$500,000
-
2018-07-23historical Expired
-
2018-07-23historical
-
2018-04-12price
-
2018-04-02price
-
2018-03-23Active
-
2018-03-23$550,000
-
2015-12-31historical Cancelled
-
2015-12-31historical
-
2015-04-28Active
-
2015-04-27$1,947,000
-
2014-12-13soldstatus $1,100,000 Closed
-
2014-12-09soldstatus $1,100,000
-
2014-10-24status Pending
-
2014-09-25status Active
-
2014-09-23historical Cancelled
-
2014-08-20$1,150,000 Active
-
2014-08-16historical Expired
-
2014-08-16historical Expired
-
2014-07-25Active
-
2014-07-25price
-
2014-07-15status Active
-
2014-07-14historical Cancelled
ⓘ Source: listings_history table (triggers on properties + properties_extension) + one-shot
backfill from property_details.listing_events for pre-trigger history.
Tax reassessment forecast CA · Resets to sale price
- Current annual tax
- $6,340 · $528/mo
- Projected year-2 tax
- $6,340 · $528/mo
- Expected delta
- $0/yr ($0/mo · 0.0%)
ⓘ Screening estimate from a state-policy table — verify with the county assessor before closing.
Climate risk First Street
- Flood 3/10 Moderate FEMA zone X (unshaded) · 20% chance over 30 yrs
- Wildfire 1/10 Low
- Heat 5/10 Major 7 d/yr ≥90°F today · 21 d/yr by 30 yrs out
- Wind 1/10 Low
- Air quality 5/10 Major 7 unhealthy d/yr today · 7 by 30 yrs out
Nearby sold comps map
Loading sold comps map…
Walkable amenities ~0.75 mi
Loading nearby amenities…
Taxation est. · year 1
- Rental income
- $56,424
- − Mortgage interest
- −$33,609
- − Property taxes
- −$6,340
- − Insurance
- −$3,000
- − Repairs & maintenance
- −$4,514
- − Management
- −$4,514
- − Depreciation
- −$17,455
- Taxable loss
- −$13,008
- Est. tax savings @ 24.0%
- +$3,122
- After-tax cash flow
- $599/yr
For passive investors: Depreciation is non-cash, so a rental often shows a tax loss while cash-flowing — sheltering income. Rental losses are passive: they offset passive income freely, and up to $25,000/yr can offset ordinary (W-2) income if you actively participate and your MAGI is under $100k (phasing out to $0 by $150k); unused losses carry forward. On sale, claimed depreciation is recaptured at up to 25%, and gains may owe capital-gains tax (a 1031 exchange can defer both). Figures are a year-1 estimate at your 24.0% rate — not tax advice; consult a CPA.
Schools (NCES district)
- District
- Los Angeles Unified
- NCES district ID
- 0622710
- Math proficiency
- 29% ▼ -4.00%
- Reading proficiency
- 54% ▲ 10.00%
- Median HH income
- $50,403
- Composite
- 35.67/100
- National rank
- #4875
- State rank
- #223 of 517 in CA
Livability — Los Angeles
- Score
- 68/100
- State rank
- #273
- US rank
- #9237
Category grades
Schools grade is shown separately in the Schools card above.
Census & demographics
- Census place
- Los Angeles, CA
- County
- Los Angeles County · 9,444,647 people
- City population
- 3,838,149
- Metro
- Los Angeles-Long Beach-Anaheim, CA
- Population (ZIP)
- 52,122
- Household income
- $59,021
- Rent vs Own
- Severe rent burden
- 2997.0
Population outlook (Los Angeles County) Hauer SSP2
- Today (2025)
- 10,940,515 people
- By 2030
- 11,256,481 · +2.9%
- By 2040
- 11,729,929 · +7.2%
- By 2050
- 11,948,407 · +9.2%
- By 2075
- 11,818,114 · +8.0%
- By 2100
- 10,842,928 · -0.9%
Race, ethnicity, and origin ACS 2023
- Neighborhood character
- Predominantly Hispanic (82%)
- Race & ethnicity
- Hispanic / Latino 82% Two or more races 23% Black 15% Native American 3% Asian 1%
- Hispanic origin (detail)
- Mexican 61%
- Foreign-born
- 36% · Canada
- Languages at home
- 25% English-only · Spanish 74%
Political lean MEDSL · Los Angeles
- 2024 margin
- Solid D (+32.9) · D 64.8% · R 31.9% · Other 3.3%
- 2008→2024 swing
- -7.4pp toward R · 2008: 40.4pp · 2024: 32.9pp
- All cycles
- 2024: D+32.9 2020: D+44.2 2016: D+48.0 2012: D+40.0 2008: D+40.4
Not yet ingested
- Civics
- —
Market trends
- HPI YoY
- ▼ -698.86%
- Current HPI
- 478.4773
- Rent YoY
- —
- Metro
- Los Angeles-Long Beach-Anaheim, CA
- State GDP YoY
- ▲ 3.21%
- F500 in state
- 116
Industry mix (Fortune 500 HQ in CA)
| Industry | F500 HQs | Revenue |
|---|---|---|
| Technology | 27 | $1,492B |
|
||
| Financial Services | 3 | $174B |
|
||
| Retail | 3 | $44B |
|
||
| Insurance | 3 | $26B |
|
||
| Media / Entertainment | 2 | $115B |
|
||
| Pharmaceuticals / Biotech | 2 | $62B |
|
||
Price history
+71.4% since first listed49 events — show timeline
- 2026-04-10 Listed $599,999 CRMLS
- 2020-11-01 Sold (MLS) $435,000 TheMLS
- 2020-09-02 Sold (Public Records) $450,500 Public Records
- 2020-08-31 Listing Removed — SDMLS
- 2020-08-24 Contingent — TheMLS
- 2020-04-06 Relisted — TheMLS
- 2020-02-21 Contingent — TheMLS
- 2020-02-11 Price Changed $425,000 TheMLS
- 2020-02-11 Listed $425,000 SDMLS
- 2020-02-11 Listed $475,000 TheMLS
- 2019-08-31 Listing Removed — SDMLS
- 2019-08-31 Delisted — TheMLS
- 2019-05-09 Listed $500,000 SDMLS
- 2019-05-09 Listed — TheMLS
- 2018-07-23 Listing Removed — SDMLS
- 2018-07-23 Delisted — TheMLS
- 2018-04-12 Price Changed — TheMLS
- 2018-04-02 Price Changed — TheMLS
- 2018-03-23 Listed $550,000 SDMLS
- 2018-03-23 Listed — TheMLS
- 2015-12-31 Listing Removed — SDMLS
- 2015-12-31 Delisted — TheMLS
- 2015-04-28 Listed — TheMLS
- 2015-04-27 Listed $1,947,000 SDMLS
- 2014-12-13 Sold (MLS) $1,100,000 TheMLS
- 2014-12-09 Sold (Public Records) $1,100,000 Public Records
- 2014-10-24 Pending — TheMLS
- 2014-09-25 Relisted — TheMLS
- 2014-09-23 Delisted — TheMLS
- 2014-08-20 Listed $1,150,000 TheMLS
- 2014-08-16 Delisted — TheMLS
- 2014-08-16 Delisted — TheMLS
- 2014-07-25 Listed — TheMLS
- 2014-07-25 Price Changed — TheMLS
- 2014-07-15 Relisted — TheMLS
- 2014-07-14 Delisted — TheMLS
- 2014-07-01 Relisted — TheMLS
- 2014-06-30 Delisted — TheMLS
- 2014-06-17 Relisted — TheMLS
- 2014-06-16 Delisted — TheMLS
- 2014-06-14 Relisted — TheMLS
- 2014-06-13 Delisted — TheMLS
- 2014-05-16 Listed — TheMLS
- 2013-10-01 Listing Removed — CRMLS
- 2013-08-09 Relisted — CRMLS
- 2013-08-09 Price Changed $279,900 CRMLS
- 2013-06-21 Listing Removed — CRMLS
- 2013-05-30 Listed $249,900 CRMLS
- 2008-04-28 Sold (Public Records) $350,000 Public Records
Property tax history
+12.0%/yrLatest (2025): $6,340 · +1.4% YoY. Source: county tax records.
Cash-flow waterfall
monthlySold comps — $/sqft
last 12 mo · ≤1 miLoading sold comps…