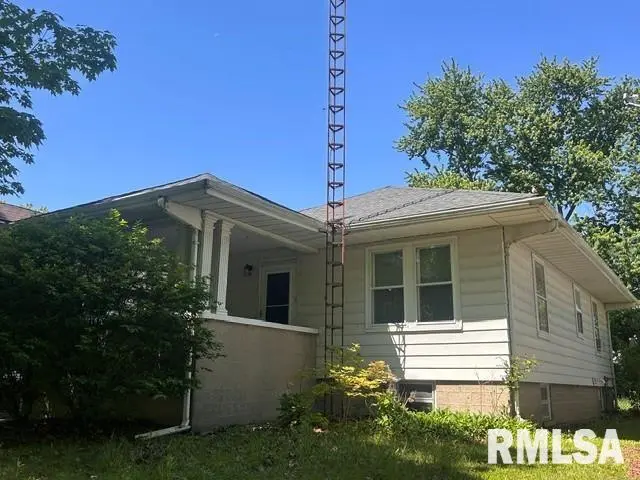
2333 Yale Blvd · Springfield, IL
Flood risk 1/10 · Minimal
- FEMA flood zone
- X (unshaded)
- Chance of flooding over 30 yrs
- 0.0%
- Est. flood insurance / yr
- $473 – $860
Fire risk 1/10 · Minimal
- Est. fire insurance / yr
- $804 – $1,492
Heat risk 4/10 · Minor
- Hot days now (above 105°F)
- 7 days/yr
- Hot days in 30 yrs
- 20 days/yr
Wind risk 2/10 · Minimal
- Chance of severe wind over 30 yrs
- 1.0%
Air-quality risk 2/10 · Minimal
- Unhealthy air days now
- 1 days/yr
- Unhealthy air days in 30 yrs
- 1 days/yr
Risk factors via First Street. Map © Google.
Why this score? — see what drove the C- grade
The composite is a weighted blend of 9 inputs, each scored 0–100. Each bar is that input's sub-score; the figure is the points it added to the 100-point composite (weight × sub-score).
- Cash flow +22.6/30.0
- 1% rule +7.4/10.0
- DSCR +7.2/10.0
- Rent growth +5.0/5.0
- Livability +4.0/5.0
- ARV discount +3.4/15.0
- Condition / age +2.5/5.0
- Schools +1.7/10.0
- Appreciation +0.0/10.0
$89,900
🖨 Deal sheet 📄 Offer letter ✓ Due diligence
Listing remarks MLS
Relax on the front porch of this 2 bedroom bungalow overlooking the boulevard. Great location close to shopping and restaurants. Updates include: 2021 - kitchen flooring; 2019 - New garage door and garage door openers; 2016 - roof on house, refrigerator and side storm door; 2010 - oven/range. Newer ceiling fans and replacement windows throughout. Harwood floors in living room, dining room and both bedrooms. Dining room has a built-in hutch and window seat. Full unfinished basement with laundry area. The backyard is fenced with a 2+ car garage.
Key facts
- 5,600 sq ft lot
- 2 garage spots
- Built 1930
Property features AI
Exterior
- Parking: Detached 2-car garage; On-street parking; Alley access; Paved driveway/parking areas
- Utilities: Public water; Public sewer
- Home design: Single family residence; Built in 1930
- Construction: Shingle roof; Full unfinished basement
- Exterior features: Fenced yard; Level lot; Paved road access; 40 x 140 lot dimensions
Interior
- Kitchen: Disposal; Microwave; Refrigerator
- Bedrooms: 2 bedrooms (primary rooms located on the main level)
- Flooring: Carpet in bedrooms; Hardwood in living and dining rooms; Vinyl in kitchen; Other flooring in basement
- Bathrooms: 1 full bathroom
- Heating & cooling: Central air; Forced air heating; Gas water heater
- Interior features: Attic storage; Cable available; Ceiling fan(s); Soaking tub; High speed internet; Replacement windows
- Laundry & utility: Washer; Basement laundry area
Neighborhood map
What this means for you Summary
Snapshot
- This is a 2-bed/1.0-bath other listed at $90k.
Deal economics
- At list price, monthly cash flow is $153 ($2k/yr) — positive.
- The deal already cash-flows at list — no discount required.
- Meets the 1% rule at list price ($1k rent vs $90k).
- Recommended offer: $87k (3.0% below list) — sets the bar for market timing.
- Cap rate 8.3% vs local median 4.9% in Springfield — top-decile yield for the area; either an underpriced asset or a hidden risk that comps aren't pricing in. Stress-test before assuming the spread holds.
Location & tenants
- Location reads 79/100 on livability (#122 in IL, #2,138 nationally) — a middle-class / working-renter tenant base. Strengths: amenities A+, commute A+, cost of living A+; Watch: crime F.
- Springfield SD 186 (urban): math 17% / reading 22% proficiency, ranked #438 of 620 in IL (top 71%) — low school quality limits family demand, transient renter base, plan for 1-2y turnover; 64% free/reduced lunch — lower-income household profile, screen leases tightly.
- Zoned schools: Springfield Southeast High Sch (math 17% / reading 22%, grade F, #397 of 693 statewide, top 61%, 1,261 students, 0% FRL) — zoned schools average 0% FRL vs 64% district-wide (64 pts lower); this property's tenant base skews higher-income than the district average.
- Market conditions: Rents rising fast (+12.2%/yr); 107 active listings in the ZIP; 19 comparable units currently listed for rent nearby; rentals lingering (median 44d on market — plan ~5-8 weeks vacancy on turnover, expect pricing pressure); 58% of comp listings sitting > 30 days — soft ceiling on asking rent; 225 units permitted in Sangamon County in 2024 (48 in 5+ unit buildings).
Forward outlook
- Local home prices are declining (-3.0%/yr); year-one equity from $622 of loan paydown is wiped out by about $3k of value loss. Plan a longer hold.
- Sangamon County population projected to shrink 9% by 2050 — rents likely to lag national; underwrite the cash flow, not the appreciation.
- At projected returns (-3.0% appreciation + 8.0% rent growth), your $25k cash investment doubles in ~8 years — after that, you're playing with house money.
Negotiation context
- It's been on market 31 days — a 3% lower offer ($87k) is reasonable based on typical stale-listing flexibility.
- 5 sale attempts since 19y ago with the ask held roughly flat each time — persistent listings suggest the price (not the market) is what's stuck; bring a comps-based counter.
- Current owner paid $69k; 30% above their basis — modest negotiation headroom, anchor on the comps not their cost.
Risks & watch-outs
- Watch-outs: property tax is 3.0% of price; built in 1930 — expect roof / HVAC / electrical / plumbing capex.
Questions for the listing agent
- It's been on market 31 days. Have you received any prior offers? Is the seller open to a 3% concession, seller financing, or rate buy-down credit?
- Built in 1930 — when were the roof, HVAC, electrical panel, plumbing, and water heater last replaced?
- Property tax is high relative to price — has the assessment been appealed recently, and will the sale trigger a re-assessment?
- Is there a deadline driving the sale (1031 exchange, divorce, estate, relocation)? That informs how much negotiation room exists.
- Schools are D-rated, which usually means shorter tenancies and higher turnover. Who's the typical renter profile here, and what's been the actual vacancy rate?
- Crime grade is F in this area — have there been break-ins, vandalism, or insurance claims at this property in the last 3 years? What carrier currently insures it and at what premium?
- What's the average days-on-market for RENTAL listings here right now (not sales)? A rising rental-DOM trend means longer vacancies and softer asking-rent achievability than the comps imply.
- What's the recent tenant-quality profile in this submarket — average credit score on applications, eviction rate, late-payment / NSF rate, and stable-employment percentage? A property-management company in the area should have these aggregated.
- How much new for-sale + rental construction is in the pipeline within 1–3 miles? Heavy new supply typically softens prices + rents 12–24 months out; constrained supply supports both.
Investment metrics
- 1% rule
- 1.24% ✓
- Cap rate
- 8.34%
- Cash-on-cash
- 7.30%
- DSCR
- 1.32
- GRM
- 6.7
CMA / ARV
- ARV (median comp)
- $82,344
- List price
- $89,900
- Delta
- 9.18%
- Verdict
- FAIR
- Comps
- 20 within 1.0 mi
Projected returns pro-forma
-3.0% appreciation · 8.0% rent growth · sell at horizon
- IRR
- 1.2%
- Equity multiple
- 1.05×
- Total profit
- $1,184
- Equity at exit
- $13,404
- IRR
- 15.8%
- Equity multiple
- 2.62×
- Total profit
- $40,839
- Equity at exit
- $7,773
Cash invested: $25,172 (down + closing). Projections, not guarantees.
Landlord ↔ Tenant lean methodology
- Overall (STATE)
- 43 Moderately Tenant-Leaning
- State Illinois
- 43 Moderately Tenant-Leaning · D+7
- County
- — inherits STATE
- City
- — inherits STATE
ZIP-level market 62703
- Home prices YoY
- -28.9%
- Rents YoY
- 12.2%
- Active inventory
- 107
- Price-to-rent
- 6.7×
Monthly cashflow live
- Estimated rent
- $1,119 high interval (Pro) →
- Mortgage (P&I)
- −$471
- Tax from tax record
- −$222 /mo · $2,659/yr
- Insurance
- −$37
- HOA
- −$0
- Vacancy / Maint / Mgmt
- −$235
- Net cashflow
- $153
Break-even live
UW: 25.0% down · 7.5% · 30yr · 1.5% tax · 5.0% vac · 8.0% maint · 8.0% mgmt
Financing live
Cash to close
- Down payment
- $22,475
- Closing costs
- $2,697
- Reserves months
- —
- Total cash needed
- —
Loan-product check · same deal, 3 products live
Conventional
25% down · 7.5% · 30yr
- Down + closing
- —
- Monthly P&I
- —
- Monthly cashflow
- —
- DSCR
- —
- Eligible?
- —
Personal DTI + credit; lowest rate.
DSCR
20% down · 8.5% · 30yr
- Down + closing
- —
- Monthly P&I
- —
- Monthly cashflow
- —
- DSCR
- —
- Eligible?
- —
No personal income docs; deal must DSCR.
Hard money
10% down · 12.0% · 12mo
- Down + closing
- —
- Monthly P&I
- —
- Monthly cashflow
- —
- DSCR
- —
- Eligible?
- —
Short-term bridge; refi at stabilization.
Rent comps 19 comps
| Address | Beds | Baths | Sqft | Rent | $/sqft | DOM | Units | Dist |
|---|---|---|---|---|---|---|---|---|
| 2328 S 10th St Springfield, IL | 3.0 | 1.0 | 1100 | $1,200 | $1.09 | 43d | 1 | 0.01mi |
| 2257 S 10th St Springfield, IL | 2.0 | 1.0 | 1100 | $1,150 | $1.05 | 43d | 1 | 0.09mi |
| 604 Bryn Mawr Blvd Springfield, IL | 2.0 | 1.0 | 850 | $1,100 | $1.29 | 43d | 1 | 0.46mi |
| 1908 S 4th St Springfield, IL | 1.0 | 1.0 | 800 | $850 | $1.06 | 21d | 1 | 0.60mi |
| 6 Ridge Ct Springfield, IL | 3.0 | 1.0 | 905 | $1,350 | $1.49 | 43d | 1 | 0.77mi |
| 1600 S 6th St Unit 1 Springfield, IL | 3.0 | 2.0 | 1100 | $1,250 | $1.14 | 21d | 1 | 0.79mi |
| 1501 S Spring St Springfield, IL | 2.0 | 1.0 | 1000 | $1,000 | $1.00 | 21d | 1 | 1.03mi |
| 2949 Fox Bridge Rd Springfield, IL | 2.0 | 1.0 | 900 | $960 | $1.07 | 21d | 1 | 1.05mi |
| 2005 E Laurel St Springfield, IL | 2.0 | 1.0 | 900 | $1,000 | $1.11 | 43d | 1 | 1.07mi |
| 1500 S Lowell Ave Springfield, IL | 1.0 | 1.0 | 590 | $775 | $1.31 | 43d | 1 | 1.20mi |
| 909 S 8th St Unit 4 Springfield, IL | 1.0 | 1.0 | 550 | $800 | $1.45 | 21d | 1 | 1.27mi |
| 2271 E Laurel St Apt 2277 Springfield, IL | 2.0 | 1.0 | 600 | $1,145 | $1.91 | 21d | 1 | 1.29mi |
| 2277 E Laurel St Springfield, IL | 2.0 | 1.0 | 600 | $1,145 | $1.91 | 43d | 1 | 1.29mi |
| 229 W Allen St Springfield, IL | 3.0 | 1.5 | 1050 | $1,305 | $1.24 | 21d | 1 | 1.33mi |
| 1004 S College St Springfield, IL | 1.0 | 1.0 | 700 | $800 | $1.14 | 21d | 1 | 1.37mi |
| 2473 Ladley Ct Unit 2520-8 RR Springfield, IL | 1.0 | 1.0 | 580 | $600 | $1.03 | 43d | 1 | 1.46mi |
| 2473 Ladley Ct Unit 2412-1 L Springfield, IL | 2.0 | 1.0 | 700 | $725 | $1.04 | 43d | 1 | 1.46mi |
| 2473 Ladley Ct Unit 2108-2 B Springfield, IL | 2.0 | 1.0 | 700 | $825 | $1.18 | 43d | 1 | 1.46mi |
| 2473 Ladley Ct Springfield, IL | 1.0 | 1.0 | 580 | $725 | $1.25 | 43d | 1 | 1.47mi |
Listing history 33 events
-
2026-06-19days on market $89,900 Under Contract 31 DOM
-
2026-06-18days on market $89,900 Under Contract 30 DOM
-
2026-06-17days on market $89,900 Under Contract 29 DOM
-
2026-06-16days on market $89,900 Under Contract 28 DOM
-
2026-06-15days on market $89,900 Under Contract 27 DOM
-
2026-06-14days on market $89,900 Under Contract 25 DOM
-
2026-06-13days on market $89,900 Under Contract 24 DOM
-
2026-06-10days on market $89,900 Under Contract 22 DOM
-
2026-06-09days on market $89,900 Under Contract 21 DOM
-
2026-06-08days on market $89,900 Under Contract 20 DOM
-
2026-06-07days on market $89,900 Under Contract 19 DOM
-
2026-06-05days on market $89,900 Under Contract 16 DOM
-
2026-06-03days on market $89,900 Under Contract 15 DOM
-
2026-06-03status $89,900 Under Contract 14 DOM
-
2026-06-02days on market $89,900 Active 14 DOM
-
2026-06-01days on market $89,900 Active 13 DOM
-
2026-05-31days on market $89,900 Active 12 DOM
-
2026-05-30days on market $89,900 Active 11 DOM
-
2026-05-12historical $89,900 507-char remark
-
2021-11-01soldstatus $69,000 549-char remark
Show marketing remark (549 chars)
Relax on the front porch of this 2 bedroom bungalow overlooking the boulevard. Great location close to shopping and restaurants. Updates include: 2021 - kitchen flooring; 2019 - New garage door and garage door openers; 2016 - roof on house, refrigerator and side storm door; 2010 - oven/range. Newer ceiling fans and replacement windows throughout. Harwood floors in living room, dining room and both bedrooms. Dining room has a built-in hutch and window seat. Full unfinished basement with laundry area. The backyard is fenced with a 2+ car garage.
-
2021-10-29soldstatus $69,000
-
2021-08-06historical
-
2021-08-06historical
-
2021-07-29$73,900 549-char remark
Show marketing remark (549 chars)
Relax on the front porch of this 2 bedroom bungalow overlooking the boulevard. Great location close to shopping and restaurants. Updates include: 2021 - kitchen flooring; 2019 - New garage door and garage door openers; 2016 - roof on house, refrigerator and side storm door; 2010 - oven/range. Newer ceiling fans and replacement windows throughout. Harwood floors in living room, dining room and both bedrooms. Dining room has a built-in hutch and window seat. Full unfinished basement with laundry area. The backyard is fenced with a 2+ car garage.
-
2017-07-28soldstatus $66,500
-
2017-07-28soldstatus $66,600
-
2017-05-05$69,900
-
2010-05-19soldstatus $65,000
-
2010-05-14soldstatus $65,000
-
2010-03-31$65,000
-
2008-05-22soldstatus $60,000
-
2008-05-16soldstatus $60,000
-
2007-07-30$64,900
ⓘ Source: listings_history table (triggers on properties + properties_extension) + one-shot
backfill from property_details.listing_events for pre-trigger history.
Tax reassessment forecast IL · Partial reset (capped growth)
- Current annual tax
- $2,659 · $222/mo
- Projected year-2 tax
- $2,659 · $222/mo
- Expected delta
- $0/yr ($0/mo · 0.0%)
ⓘ Screening estimate from a state-policy table — verify with the county assessor before closing.
Climate risk First Street
- Flood 1/10 Low FEMA zone X (unshaded) · 0% chance over 30 yrs
- Wildfire 1/10 Low
- Heat 4/10 Moderate 7 d/yr ≥105°F today · 20 d/yr by 30 yrs out
- Wind 2/10 Low 100% chance of damaging wind over 30 yrs
- Air quality 2/10 Low 1 unhealthy d/yr today · 1 by 30 yrs out
Nearby sold comps map
Loading sold comps map…
Walkable amenities ~0.75 mi
Loading nearby amenities…
Taxation est. · year 1
- Rental income
- $13,422
- − Mortgage interest
- −$5,036
- − Property taxes
- −$2,659
- − Insurance
- −$450
- − Repairs & maintenance
- −$1,074
- − Management
- −$1,074
- − Depreciation
- −$2,615
- Taxable income
- $516
- Est. tax owed @ 24.0%
- −$124
- After-tax cash flow
- $1,714/yr
For passive investors: Depreciation is non-cash, so a rental often shows a tax loss while cash-flowing — sheltering income. Rental losses are passive: they offset passive income freely, and up to $25,000/yr can offset ordinary (W-2) income if you actively participate and your MAGI is under $100k (phasing out to $0 by $150k); unused losses carry forward. On sale, claimed depreciation is recaptured at up to 25%, and gains may owe capital-gains tax (a 1031 exchange can defer both). Figures are a year-1 estimate at your 24.0% rate — not tax advice; consult a CPA.
Schools (NCES district)
- District
- Springfield SD 186
- NCES district ID
- 1737080
- Math proficiency
- 17% ▼ -7.00%
- Reading proficiency
- 22% ▼ -5.00%
- Median HH income
- $43,744
- Composite
- 16.89/100
- National rank
- #9142
- State rank
- #438 of 620 in IL
Livability — Springfield
- Score
- 79/100
- State rank
- #122
- US rank
- #2138
Category grades
Schools grade is shown separately in the Schools card above.
Census & demographics
- Census place
- Springfield, IL
- County
- Sangamon County · 115,414 people
- City population
- 59,955
- Metro
- Springfield, IL
- Population (ZIP)
- 28,922
- Household income
- $45,009
- Rent vs Own
- Severe rent burden
- 1626.0
Population outlook (Sangamon County) Hauer SSP2
- Today (2025)
- 198,317 people
- By 2030
- 196,127 · -1.1%
- By 2040
- 188,664 · -4.9%
- By 2050
- 179,624 · -9.4%
- By 2075
- 155,027 · -21.8%
- By 2100
- 122,588 · -38.2%
Race, ethnicity, and origin ACS 2023
- Neighborhood character
- Diverse neighborhood (Simpson 0.59)
- Race & ethnicity
- White 53% Black 35% Two or more races 7% Hispanic / Latino 5%
- Common ancestry
- Lithuanian 2% Romanian 2% Italian 1%
- Foreign-born
- 3% · Canada
- Languages at home
- 95% English-only · Spanish 3% Arabic 1%
Political lean MEDSL · Sangamon
- 2024 margin
- Toss-up / Even · D 46.6% · R 51.6% · Other 1.8%
- 2008→2024 swing
- -9.3pp toward R · 2008: 4.4pp · 2024: -5.0pp
- All cycles
- 2024: R+5.0 2020: R+4.4 2016: R+9.4 2012: R+8.7 2008: D+4.4
Not yet ingested
- Civics
- —
Market trends
- HPI YoY
- ▼ -59.69%
- Current HPI
- 147.0877
- Rent YoY
- ▲ 12.19%
- Metro
- Springfield, IL
- State GDP YoY
- ▲ 1.59%
- F500 in state
- 60
Industry mix (Fortune 500 HQ in IL)
| Industry | F500 HQs | Revenue |
|---|---|---|
| Insurance | 4 | $201B |
|
||
| Consumer Goods | 4 | $87B |
|
||
| Industrial Machinery | 3 | $64B |
|
||
| Healthcare | 2 | $55B |
|
||
| Retail / Pharmacy | 1 | $148B |
|
||
| Agriculture / Food | 1 | $86B |
|
||
Price history
+38.5% since first listed17 events — show timeline
- 2026-06-02 Contingent — RMLSA as Distributed by MLS Grid
- 2026-05-19 Listed $89,900 RMLSA as Distributed by MLS Grid
- 2026-05-12 Coming Soon $89,900 RMLSA as Distributed by MLS Grid
- 2021-11-01 Sold (MLS) $69,000 RMLSA as Distributed by MLS Grid
- 2021-10-29 Sold (Public Records) $69,000 Public Records
- 2021-08-06 Listing Removed — RMLSA as Distributed by MLS Grid
- 2021-08-06 Listing Removed — RMLSA as Distributed by MLS Grid
- 2021-07-29 Listed $73,900 RMLSA as Distributed by MLS Grid
- 2017-07-28 Sold (Public Records) $66,600 Public Records
- 2017-07-28 Sold (MLS) $66,500 RMLSA as Distributed by MLS Grid
- 2017-05-05 Listed $69,900 RMLSA as Distributed by MLS Grid
- 2010-05-19 Sold (Public Records) $65,000 Public Records
- 2010-05-14 Sold (MLS) $65,000 RMLSA as Distributed by MLS Grid
- 2010-03-31 Listed $65,000 RMLSA as Distributed by MLS Grid
- 2008-05-22 Sold (Public Records) $60,000 Public Records
- 2008-05-16 Sold (MLS) $60,000 RMLSA as Distributed by MLS Grid
- 2007-07-30 Listed $64,900 RMLSA as Distributed by MLS Grid
Property tax history
+6.6%/yrLatest (2025): $2,659 · +3.4% YoY. Source: county tax records.
Cash-flow waterfall
monthlySold comps — $/sqft
last 12 mo · ≤1 miLoading sold comps…