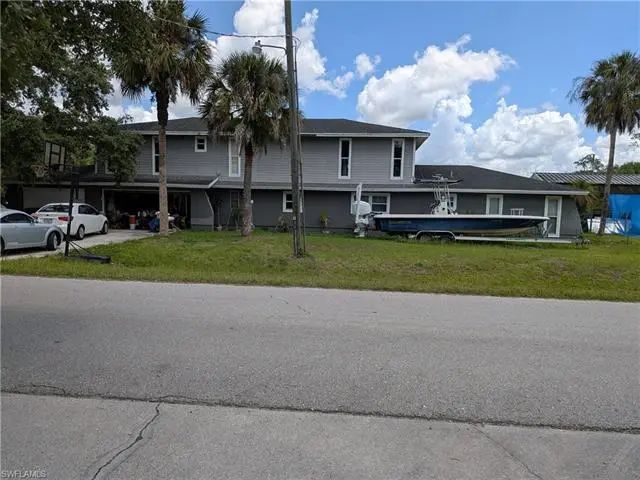
17191 Frank Rd · Olga, FL
Flood risk 8/10 · Major
- FEMA flood zone
- AE
- Chance of flooding over 30 yrs
- 0.99%
- Est. flood insurance / yr
- $1,737 – $8,500
Fire risk 4/10 · Minor
- Est. fire insurance / yr
- $947 – $1,759
Heat risk 9/10 · Severe
- Hot days now (above 108°F)
- 7 days/yr
- Hot days in 30 yrs
- 26 days/yr
Wind risk 10/10 · Severe
- Chance of severe wind over 30 yrs
- 99.0%
Air-quality risk 2/10 · Minimal
- Unhealthy air days now
- 1 days/yr
- Unhealthy air days in 30 yrs
- 1 days/yr
Risk factors via First Street. Map © Google.
Why this score? — see what drove the D+ grade
The composite is a weighted blend of 9 inputs, each scored 0–100. Each bar is that input's sub-score; the figure is the points it added to the 100-point composite (weight × sub-score).
- Cash flow +19.4/30.0
- ARV discount +7.5/15.0
- DSCR +6.1/10.0
- 1% rule +4.1/10.0
- Schools +4.1/10.0
- Livability +3.2/5.0
- Rent growth +2.5/5.0
- Condition / age +2.5/5.0
- Appreciation +0.0/10.0
$399,000
🖨 Deal sheet (PDF) 📄 Offer letter ✓ Due diligence
Listing remarks
Huge 4 bedroom 4 bath house on 1.14 acres overlooking a large pond, with an attached 3 1/2 car garage, a chicken coop, machinery shed and large pole barn for the RV, boats or use as a workshop, all on a quiet country road in Alva. Both air conditioners are recent; two and three years old, oversized well equipment and water storage with a septic system. The first floor has two bedrooms and two bathrooms, a large, remodeled kitchen and dining area adjacent to the living room, the laundry room is almost cavernous affording plenty of room for storage as well. The upstairs is also two bedrooms and two bathrooms with real wood plank flooring. The western bedroom has a very large walk in closet an
Key facts
- Attached car garage
- Remodeled kitchen
- Machinery shed
Tags
Property features AI
Finance
- Other: Zoning: AG-2; Development: Alva Hickey Creek; Lot dimensions roughly 250' x 250', total area listed as 4028 (units per appraisal); Irrigation: lake/canal and well
- HOA & community: No HOA maintenance or community amenities (see remarks)
Exterior
- Parking: Attached 3-car garage
- Security: Smoke detectors
- Utilities: Well water; Septic sewer; Cable available
- Home design: Single family residence; Two-story / multi-story home; Rear exposure to the west
- Construction: Built in 1981; Concrete block and wood frame construction; Vinyl siding; Shingle roof; Single-hung windows
- Exterior features: Deck; Extra building; Fence; Gazebo; Pond; Room for pool; Freshwater waterfront (pond); Oversize lot (about 1.144 acres); County maintained road frontage
Interior
- Kitchen: Kitchen island; Breakfast bar; Dining (family); Eat-in kitchen; Cooktop (electric); Range; Microwave; Dishwasher; Disposal; Refrigerator / Freezer
- Bedrooms: 4 bedrooms
- Flooring: Tile; Wood
- Bathrooms: 4 full bathrooms; Two master bathrooms with combo tub and shower
- Heating & cooling: Central electric heat; Central electric cooling; Ceiling fans; Ridge vent
- Interior features: Built-in cabinets; Closet cabinets; French doors; Laundry tub; Pantry; Smoke detectors; Walk-in closet; Window coverings; Open porch/lanai; Workshop
- Laundry & utility: Washer; Dryer; Laundry in residence; Laundry tub; Auto garage door
Neighborhood map
What this means for you Summary
Snapshot
- This is a 4-bed/4.0-bath single-family listed at $399k.
Deal economics
- At list price, monthly cash flow is $19 ($227/yr) — positive.
- The deal already cash-flows at list — no discount required.
- To meet the 1% rule (rent ≥ 1% of price), the offer needs to be $362k (9.2% below list).
- Recommended offer: $362k (9.2% below list) — sets the bar for 1% rule.
- Cap rate 7.6% vs local median 3.5% in Olga — top-decile yield for the area; either an underpriced asset or a hidden risk that comps aren't pricing in. Stress-test before assuming the spread holds.
Location & tenants
- Location reads 63/100 on livability (#707 in FL) — a middle-class / working-renter tenant base. Strengths: crime A+, housing A+, employment B; Watch: amenities F, commute F, health & safety D-.
- Lee (suburban): math 47% / reading 50% proficiency, ranked #42 of 73 in FL (top 58%) — families likely to look elsewhere, expect single-tenant / working-renter base with shorter leases.
- Zoned schools: Veterans Park Academy For The Arts (math 41% / reading 45%, grade F, #1,366 of 2,144 statewide, top 64%, 2,133 students, 36% FRL); Oak Hammock Middle School (math 43% / reading 41%, grade D-, #340 of 571 statewide, top 61%, 1,563 students, 56% FRL); Lehigh Senior High School (math 23% / reading 45%, grade F, #394 of 667 statewide, top 60%, 2,476 students, 57% FRL).
- Market conditions: 460 active listings in the ZIP; 3 comparable units currently listed for rent nearby; rentals at typical pace (median 23d on market — plan ~3-4 weeks tenant-placement turnaround); 15,411 units permitted in Lee County in 2024 (4,686 in 5+ unit buildings).
Forward outlook
- Local home prices are declining (-3.0%/yr); year-one equity from $3k of loan paydown is wiped out by about $12k of value loss. Plan a longer hold.
- Lee County population projected at +44% by 2050 — long-run rental-demand tailwind backs the buy-and-hold thesis.
Negotiation context
- It's been on market 26 days — a 2% lower offer ($393k) is reasonable based on typical stale-listing flexibility.
- 2 sale attempts since 16y ago with the ask held roughly flat each time — persistent listings suggest the price (not the market) is what's stuck; bring a comps-based counter.
- Current owner paid $125k; list at $399k implies a 219% gain — meaningful room to come down on a strong offer.
Risks & watch-outs
- Watch-outs: flood insurance adds $427/mo.
- Climate carrying-cost: in FEMA flood zone AE (mandatory federal flood insurance); severe wind risk, 99% chance of damaging wind over 30y; extreme-heat days projected 7→26/yr by 2055 (HVAC capex compounding) — expect insurance premiums to compound above CPI over the hold.
Questions for the listing agent
- What's the actual annual flood-insurance premium (NFIP or private), and is the property in a SFHA with mandatory coverage?
- Is there a deadline driving the sale (1031 exchange, divorce, estate, relocation)? That informs how much negotiation room exists.
- Schools are F-rated, which usually means shorter tenancies and higher turnover. Who's the typical renter profile here, and what's been the actual vacancy rate?
- The area grade is low — what's the realistic commute time and amenity access for the typical tenant pool here? Any planned neighborhood developments (good or bad) we should know about?
- What's the average days-on-market for RENTAL listings here right now (not sales)? A rising rental-DOM trend means longer vacancies and softer asking-rent achievability than the comps imply.
- What's the recent tenant-quality profile in this submarket — average credit score on applications, eviction rate, late-payment / NSF rate, and stable-employment percentage? A property-management company in the area should have these aggregated.
- How much new for-sale + rental construction is in the pipeline within 1–3 miles? Heavy new supply typically softens prices + rents 12–24 months out; constrained supply supports both.
Investment metrics
- 1% rule
- 0.91% ✗
- Cap rate
- 7.63%
- Cash-on-cash
- 4.78%
- DSCR
- 1.21
- GRM
- 9.2
CMA / ARV
No comps found within radius.
Projected returns pro-forma
-3.0% appreciation · 3.0% rent growth · sell at horizon
- IRR
- -15.9%
- Equity multiple
- 0.43×
- Total profit
- $-63,342
- Equity at exit
- $59,492
- IRR
- -7.5%
- Equity multiple
- 0.52×
- Total profit
- $-53,167
- Equity at exit
- $34,498
Cash invested: $111,720 (down + closing). Projections, not guarantees.
Landlord ↔ Tenant lean methodology
- Overall (STATE)
- 87 Strongly Landlord-Friendly
- State Florida
- 87 Strongly Landlord-Friendly · R+3
- County
- — inherits STATE
- City
- — inherits STATE
ZIP-level market 33920
- Home prices YoY
- -11.8%
- Active inventory
- 460
- Price-to-rent
- 9.2×
Monthly cashflow live
- Estimated rent
- $3,623 medium interval (Pro) →
- Mortgage (P&I)
- −$2,092
- Tax from tax record
- −$158 /mo · $1,900/yr
- Insurance
- −$166
- Flood insurance flood zone
- −$427 /mo · $5,118/yr
- HOA
- −$0
- Vacancy / Maint / Mgmt
- −$761
- Net cashflow
- $19
Break-even live
Sensitivity live
| Price | -10% $245 | -5% $132 | +0% $19 | +5% $-94 | +10% $-207 |
|---|---|---|---|---|---|
| Rent | -10% $-267 | -5% $-124 | +0% $19 | +5% $162 | +10% $305 |
| Rate | -1.0pp $220 | -0.5pp $120 | base $19 | +0.5pp $-84 | +1.0pp $-190 |
UW: 25.0% down · 7.5% · 30yr · 1.5% tax · 5.0% vac · 8.0% maint · 8.0% mgmt
Financing live
Cash to close
- Down payment
- $99,750
- Closing costs
- $11,970
- Reserves months
- —
- Total cash needed
- —
Loan-product check · same deal, 3 products live
Conventional
25% down · 7.5% · 30yr
- Down + closing
- —
- Monthly P&I
- —
- Monthly cashflow
- —
- DSCR
- —
- Eligible?
- —
Personal DTI + credit; lowest rate.
DSCR
20% down · 8.5% · 30yr
- Down + closing
- —
- Monthly P&I
- —
- Monthly cashflow
- —
- DSCR
- —
- Eligible?
- —
No personal income docs; deal must DSCR.
Hard money
10% down · 12.0% · 12mo
- Down + closing
- —
- Monthly P&I
- —
- Monthly cashflow
- —
- DSCR
- —
- Eligible?
- —
Short-term bridge; refi at stabilization.
Rent comps 3 comps
| Address | Beds | Baths | Sqft | Rent | $/sqft | DOM | Units | Dist |
|---|---|---|---|---|---|---|---|---|
| 3370 Chestnut Grove Dr Alva, FL | 4.0 | 3.0 | 2362 | $3,500 | $1.48 | 25d | 1 | 0.89mi |
| 3606 Wild Sage Way Alva, FL | 3.0 | 3.0 | 2202 | $2,600 | $1.18 | 23d | 1 | 1.40mi |
| 3425 Hampton Blvd Alva, FL | 3.0 | 2.0 | 2140 | $4,900 | $2.29 | 5d | 1 | 1.41mi |
Listing history 21 events
-
2026-06-22days on market $399,000 Active 26 DOM
-
2026-06-17days on market $399,000 Active 22 DOM
-
2026-06-16days on market $399,000 Active 21 DOM
-
2026-06-15days on market $399,000 Active 20 DOM
-
2026-06-13days on market $399,000 Active 18 DOM
-
2026-06-10days on market $399,000 Active 15 DOM
-
2026-06-09days on market $399,000 Active 14 DOM
-
2026-06-08days on market $399,000 Active 13 DOM
-
2026-06-07days on market $399,000 Active 12 DOM
-
2026-06-03days on market $399,000 Active 8 DOM
-
2026-06-02days on market $399,000 Active 7 DOM
-
2026-06-01days on market $399,000 Active 6 DOM
-
2026-05-31days on market $399,000 Active 5 DOM
-
2026-05-26$399,000 Active
-
2012-12-11soldstatus $125,000
-
2010-01-25$189,900
-
2005-07-25soldstatus $448,000
-
2005-07-06soldstatus $448,000
-
2005-07-05soldstatus $350,000
-
2005-06-03price $398,000
-
1978-05-01soldstatus $27,000
ⓘ Source: listings_history table (triggers on properties + properties_extension) + one-shot
backfill from property_details.listing_events for pre-trigger history.
Tax reassessment forecast FL · Resets to sale price
- Current annual tax
- $1,900 · $158/mo
- Projected year-2 tax
- $3,312 · $276/mo
- Expected delta
- +$1,412/yr (+$118/mo · 74.3%)
ⓘ Screening estimate from a state-policy table — verify with the county assessor before closing.
Climate risk First Street
- Flood 8/10 Severe FEMA zone AE · 99% chance over 30 yrs
- Wildfire 4/10 Moderate
- Heat 9/10 Extreme 7 d/yr ≥108°F today · 26 d/yr by 30 yrs out
- Wind 10/10 Extreme 99% chance of damaging wind over 30 yrs
- Air quality 2/10 Low 1 unhealthy d/yr today · 1 by 30 yrs out
Nearby sold comps map
Loading sold comps map…
Walkable amenities ~0.75 mi
Loading nearby amenities…
Taxation est. · year 1
- Rental income
- $43,480
- − Mortgage interest
- −$22,350
- − Property taxes
- −$1,900
- − Insurance
- −$7,114
- − Repairs & maintenance
- −$3,478
- − Management
- −$3,478
- − Depreciation
- −$11,607
- Taxable loss
- −$6,448
- Est. tax savings @ 24.0%
- +$1,547
- After-tax cash flow
- $1,775/yr
For passive investors: Depreciation is non-cash, so a rental often shows a tax loss while cash-flowing — sheltering income. Rental losses are passive: they offset passive income freely, and up to $25,000/yr can offset ordinary (W-2) income if you actively participate and your MAGI is under $100k (phasing out to $0 by $150k); unused losses carry forward. On sale, claimed depreciation is recaptured at up to 25%, and gains may owe capital-gains tax (a 1031 exchange can defer both). Figures are a year-1 estimate at your 24.0% rate — not tax advice; consult a CPA.
Schools (NCES district)
- District
- Lee
- NCES district ID
- 1201080
- Math proficiency
- 47% ▼ -11.00%
- Reading proficiency
- 50% ▼ -4.00%
- Median HH income
- $49,518
- Composite
- 41.49/100
- National rank
- #3458
- State rank
- #42 of 73 in FL
Livability — Olga
- Score
- 63/100
- State rank
- #707
- US rank
- #15011
Category grades
Schools grade is shown separately in the Schools card above.
Census & demographics
- Census place
- Olga, FL
- Population (ZIP)
- 7,689
Population outlook (Lee County) Hauer SSP2
- Today (2025)
- 871,946 people
- By 2030
- 955,468 · +9.6%
- By 2040
- 1,113,587 · +27.7%
- By 2050
- 1,256,891 · +44.1%
- By 2075
- 1,560,270 · +78.9%
- By 2100
- 1,726,848 · +98.0%
Race, ethnicity, and origin ACS 2023
- Neighborhood character
- Predominantly White (82%)
- Race & ethnicity
- White 82% Hispanic / Latino 8% Two or more races 7% Asian 5% Black 1%
- Hispanic origin (detail)
- Mexican 3% Puerto Rican 2% Cuban 1%
- Common ancestry
- Romanian 6% Portuguese 5% German 3%
- Foreign-born
- 11% · Canada, Vietnam
- Languages at home
- 90% English-only · Spanish 5% Other Asian/Pacific 2% Vietnamese 2%
Political lean MEDSL · Lee
- 2024 margin
- Strong R (+28.4) · D 35.5% · R 63.9%
- 2008→2024 swing
- -18.0pp toward R · 2008: -10.4pp · 2024: -28.4pp
- All cycles
- 2024: R+28.4 2020: R+19.2 2016: R+20.4 2012: R+16.6 2008: R+10.4
Not yet ingested
- Civics
- —
Market trends
- HPI YoY
- ▼ -47.83%
- Current HPI
- 355.9229
- Rent YoY
- —
- Metro
- —
- State GDP YoY
- ▲ 3.28%
- F500 in state
- 36
Industry mix (Fortune 500 HQ in FL)
| Industry | F500 HQs | Revenue |
|---|---|---|
| Industrial Technology | 2 | $29B |
|
||
| Insurance | 2 | $17B |
|
||
| Retail | 1 | $60B |
|
||
| Technology Distribution | 1 | $58B |
|
||
| Homebuilding | 1 | $35B |
|
||
| Technology Manufacturing | 1 | $35B |
|
||
Price history
+1377.8% since first listed8 events — show timeline
- 2026-05-26 Listed $399,000 BEARMLS
- 2012-12-11 Sold (Public Records) $125,000 Public Records
- 2010-01-25 Listed $189,900 NAPLESMLS
- 2005-07-25 Sold (Public Records) $448,000 Public Records
- 2005-07-06 Sold (MLS) $448,000 FORTMLS
- 2005-07-05 Sold (MLS) $350,000 FORTMLS
- 2005-06-03 Price Changed $398,000 FORTMLS
- 1978-05-01 Sold (Public Records) $27,000 Public Records
Property tax history
+1.4%/yrLatest (2025): $1,900 · +5.2% YoY. Source: county tax records.
Cash-flow waterfall
monthlySold comps — $/sqft
last 12 mo · ≤1 miLoading sold comps…