 Multi-family
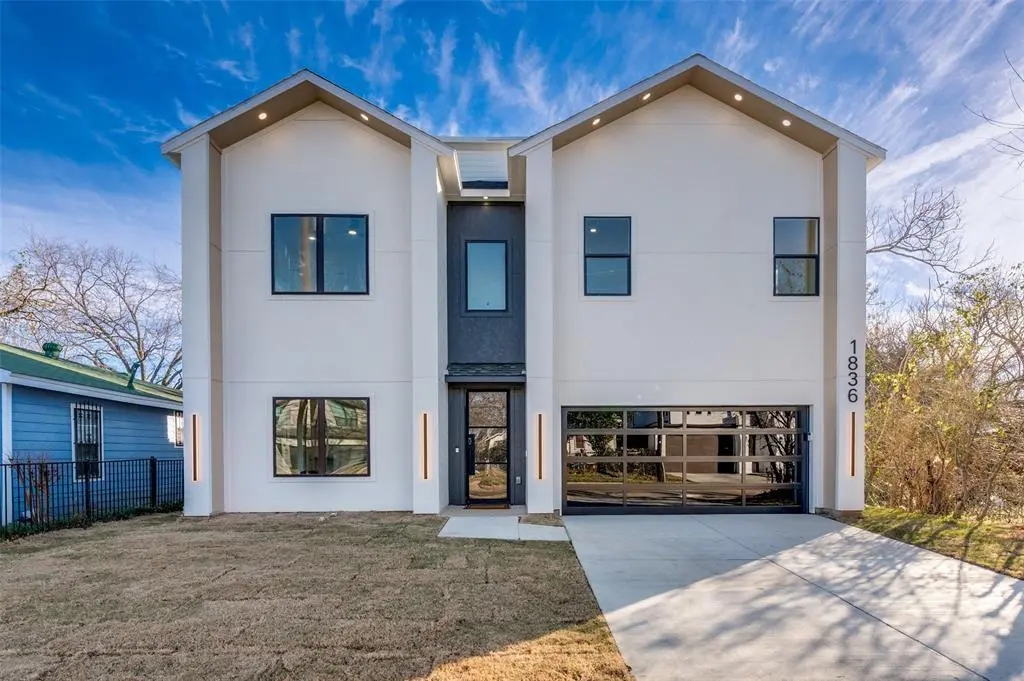
1836 Pueblo St · Dallas, TX
Flood risk 1/10 · Minimal
- FEMA flood zone
- X
- Chance of flooding over 30 yrs
- 0.0%
- Est. flood insurance / yr
- $507 – $1,088
Fire risk 1/10 · Minimal
- Est. fire insurance / yr
- $1,222 – $2,270
Heat risk 8/10 · Major
- Hot days now (above 109°F)
- 7 days/yr
- Hot days in 30 yrs
- 24 days/yr
Wind risk 6/10 · Moderate
- Chance of severe wind over 30 yrs
- 27.0%
Air-quality risk 3/10 · Minor
- Unhealthy air days now
- 2 days/yr
- Unhealthy air days in 30 yrs
- 3 days/yr
Risk factors via First Street. Map © Google.
Why this score? — see what drove the F grade
The composite is a weighted blend of 9 inputs, each scored 0–100. Each bar is that input's sub-score; the figure is the points it added to the 100-point composite (weight × sub-score).
- Appreciation +10.0/10.0
- ARV discount +7.5/15.0
- Livability +4.0/5.0
- Schools +2.8/10.0
- Condition / age +2.5/5.0
- Rent growth +1.4/5.0
- Cash flow +1.2/30.0
- 1% rule +0.0/10.0
- DSCR +0.0/10.0
$699,000
🖨 Deal sheet (PDF) 📄 Offer letter ✓ Due diligence
Multi-family units
County records classify this as Multi-Family (2-4 Unit). Listing-text estimate: 1 unit. estimate disagrees with records
Listing remarks
Experience elevated urban living in this stunning new construction residence located in the highly sought-after Victory Gardens neighborhood. Thoughtfully crafted across three spacious levels, this architecturally striking home offers 5 bedrooms, 3.5 bathrooms, and a seamless blend of modern sophistication, luxury finishes, and functional design. The heart of the home is an impressive European-inspired chef's kitchen, beautifully appointed with dramatic waterfall quartz countertops, sleek custom cabinetry, premium finishes, and a spacious butler-style pantry that provides additional prep space and effortless entertaining. The open-concept layout flows seamlessly into the dining and living a
Key facts
- Private rooftop deck
- Dallas skyline
- Butler style pantry
Tags
Property features AI
Finance
- Other: Builder special listing condition
- Financial info: Treat as clear loan type; No second mortgage
- HOA & community: No homeowners association
Exterior
- Parking: Attached 2-car garage; 2 covered parking spaces; Garage faces front
- Utilities: City water; City sewer; Not in a municipal utility district
- Home design: Single family residence; Two-story; New construction (completed 2026); Smart home features available
- Construction: Shingle roof; Slab foundation; New construction completed in 2026
- Exterior features: Lot less than 0.5 acre (approximately 0.13 acre); Subdivision: Victory Gardens
Interior
- Kitchen: Dishwasher; Disposal; Electric range; Microwave; Eat-in kitchen with kitchen island; Walk-in pantry; Pot filler
- Bedrooms: 5 bedrooms total; Primary bedroom on main level; Second primary bedroom on main level; Additional bedrooms on second level
- Bathrooms: 3 full bathrooms; 1 half bathroom
- Heating & cooling: Central heating; Central air; Ceiling fan(s)
- Interior features: Decorative lighting; Eat-in kitchen; High-speed internet available; In-law suite floorplan; Kitchen island; Open floorplan; Pantry; Walk-in closet(s); One living area; One dining area; Total of 9 rooms; Electric fireplace in living room
Neighborhood map
What this means for you Summary
Snapshot
- This is a 2-bed/2.0-bath multifamily listed at $699k.
Deal economics
- At list price, monthly cash flow is $-3k ($-34k/yr) — negative.
- To cash-flow at today's rent, offer at most $199k (71.6% below list).
- To meet the 1% rule (rent ≥ 1% of price), the offer needs to be $193k (72.4% below list).
- Recommended offer: $193k (72.4% below list) — sets the bar for 1% rule.
- Cap rate 1.4% vs local median 2.3% in Dallas — below-typical yield; the buyer is paying a premium for something (appreciation thesis, condition, location) that the cap rate doesn't capture.
Location & tenants
- Location reads 81/100 on livability (#24 in TX, #1,380 nationally) — a professional / high-income tenant draw. Strengths: amenities A+, commute A+, housing A+; Watch: crime F.
- Dallas ISD (urban): math 31% / reading 36% proficiency, ranked #559 of 826 in TX (top 68%) — families likely to look elsewhere, expect single-tenant / working-renter base with shorter leases; 83% free/reduced lunch — lower-income household profile, screen leases tightly.
- Zoned schools: Adelfa Botello Callejo El (math 33% / reading 45%, grade F, #1,651 of 4,322 statewide, top 39%, 542 students, 96% FRL); D A Hulcy Steam Middle (math 33% / reading 32%, grade F, #947 of 1,662 statewide, top 58%, 423 students, 88% FRL); L G Pinkston H S (math 10% / reading 21%, grade F, #1,505 of 1,632 statewide, top 92%, 1,139 students, 92% FRL).
- Market conditions: Rents falling (-4.2%/yr); 249 active listings in the ZIP; 40 comparable units currently listed for rent nearby; rentals at typical pace (median 21d on market — plan ~3-4 weeks tenant-placement turnaround); 12,577 units permitted in Dallas County in 2024 (6,829 in 5+ unit buildings).
- This rent runs 39% of the median local income ($60k/yr) — at the standard rent-burdened threshold; future hikes will face affordability resistance.
Forward outlook
- In year one you build about $75k of equity ($5k loan paydown + $70k appreciation (10.0% local appreciation)).
- Dallas County population projected at +35% by 2050 — long-run rental-demand tailwind backs the buy-and-hold thesis.
- By year 2, paydown + projected appreciation supports a ~$120k cash-out refi (75% LTV) — recoverable capital for the next deal without selling this one.
Negotiation context
- It's been on market 17 days — a 2% lower offer ($689k) is reasonable based on typical stale-listing flexibility.
- 3 sale attempts since 4y ago with the ask held roughly flat each time — persistent listings suggest the price (not the market) is what's stuck; bring a comps-based counter.
Risks & watch-outs
- Climate carrying-cost: major wind risk, 27% chance of damaging wind over 30y; extreme-heat days projected 7→24/yr by 2055 (HVAC capex compounding) — expect insurance premiums to compound above CPI over the hold.
Questions for the listing agent
- What do current leases actually rent for vs. the listed asking? Can we see a recent rent roll and the last 12 months of T-12 income?
- Is there a deadline driving the sale (1031 exchange, divorce, estate, relocation)? That informs how much negotiation room exists.
- Crime grade is F in this area — have there been break-ins, vandalism, or insurance claims at this property in the last 3 years? What carrier currently insures it and at what premium?
- The area grade is low — what's the realistic commute time and amenity access for the typical tenant pool here? Any planned neighborhood developments (good or bad) we should know about?
- What's the average days-on-market for RENTAL listings here right now (not sales)? A rising rental-DOM trend means longer vacancies and softer asking-rent achievability than the comps imply.
- What's the recent tenant-quality profile in this submarket — average credit score on applications, eviction rate, late-payment / NSF rate, and stable-employment percentage? A property-management company in the area should have these aggregated.
- How much new apartment / multifamily construction is in the pipeline within 1–3 miles? Heavy new supply (>2% of stock underway) typically softens rents 12–24 months out; light construction supports rent growth.
Investment metrics
- 1% rule
- 0.28% ✗
- Cap rate
- 1.43%
- Cash-on-cash
- -17.37%
- DSCR
- 0.23
- GRM
- 30.1
CMA / ARV
No comps found within radius.
Projected returns pro-forma
10.0% appreciation · 0.0% rent growth · sell at horizon
- IRR
- 11.9%
- Equity multiple
- 1.99×
- Total profit
- $194,329
- Equity at exit
- $629,715
- IRR
- 12.4%
- Equity multiple
- 4.59×
- Total profit
- $703,508
- Equity at exit
- $1,358,003
Cash invested: $195,720 (down + closing). Projections, not guarantees.
Landlord ↔ Tenant lean methodology
- Overall (STATE)
- 87 Strongly Landlord-Friendly
- State Texas
- 87 Strongly Landlord-Friendly · R+5
- County
- — inherits STATE
- City
- — inherits STATE
ZIP-level market 75212
- Rents YoY
- -4.2%
- Active inventory
- 249
- Price-to-rent
- 30.1×
Monthly cashflow live
- Estimated rent
- $1,932 high interval (Pro) →
- Mortgage (P&I)
- −$3,666
- Tax from tax record
- −$403 /mo · $4,833/yr
- Insurance
- −$291
- HOA
- −$0
- Vacancy / Maint / Mgmt
- −$406
- Net cashflow
- $-2,833
Break-even live
Sensitivity live
| Price | -10% $-2,437 | -5% $-2,635 | +0% $-2,833 | +5% $-3,031 | +10% $-3,229 |
|---|---|---|---|---|---|
| Rent | -10% $-2,986 | -5% $-2,909 | +0% $-2,833 | +5% $-2,757 | +10% $-2,680 |
| Rate | -1.0pp $-2,481 | -0.5pp $-2,655 | base $-2,833 | +0.5pp $-3,014 | +1.0pp $-3,198 |
UW: 25.0% down · 7.5% · 30yr · 1.5% tax · 5.0% vac · 8.0% maint · 8.0% mgmt
Financing live
Cash to close
- Down payment
- $174,750
- Closing costs
- $20,970
- Reserves months
- —
- Total cash needed
- —
Loan-product check · same deal, 3 products live
Conventional
25% down · 7.5% · 30yr
- Down + closing
- —
- Monthly P&I
- —
- Monthly cashflow
- —
- DSCR
- —
- Eligible?
- —
Personal DTI + credit; lowest rate.
DSCR
20% down · 8.5% · 30yr
- Down + closing
- —
- Monthly P&I
- —
- Monthly cashflow
- —
- DSCR
- —
- Eligible?
- —
No personal income docs; deal must DSCR.
Hard money
10% down · 12.0% · 12mo
- Down + closing
- —
- Monthly P&I
- —
- Monthly cashflow
- —
- DSCR
- —
- Eligible?
- —
Short-term bridge; refi at stabilization.
Rent comps 40 comps
| Address | Beds | Baths | Sqft | Rent | $/sqft | DOM | Units | Dist |
|---|---|---|---|---|---|---|---|---|
| 1907 Nomas St Dallas, TX | 3.0 | 2.0 | 1368 | $2,900 | $2.12 | 20d | 1 | 0.09mi |
| 3113 Navaro St Dallas, TX | 2.0 | 2.0 | 735 | $1,600 | $2.18 | 26d | 1 | 0.20mi |
| 3113 Navaro St Unit N/A Dallas, TX | 2.0 | 2.0 | 735 | $1,800 | $2.45 | 45d | 1 | 0.20mi |
| 1728 McBroom St Dallas, TX | 3.0 | 1.0 | 1027 | $1,695 | $1.65 | 45d | 1 | 0.21mi |
| 1739 McBroom St Dallas, TX | 3.0 | 2.0 | 1138 | $2,100 | $1.85 | 13d | 1 | 0.22mi |
| 3015 Chihuahua Ave Unit 1069902P Dallas, TX | 3.0 | 2.0 | 904 | $6,725 | $7.44 | 0d | 1 | 0.25mi |
| 3015 Chihuahua Ave Dallas, TX | 3.0 | 2.0 | 912 | $4,500 | $4.93 | 9d | 1 | 0.25mi |
| 3321 Rutz St Dallas, TX | 3.0 | 2.5 | 1436 | $2,550 | $1.78 | 5d | 1 | 0.34mi |
| 1944 Gallagher St Dallas, TX | 3.0 | 2.0 | 1125 | $1,961 | $1.74 | 7d | 1 | 0.34mi |
| 1520 McBroom St Dallas, TX | 2.0 | 1.0 | 900 | $1,590 | $1.77 | 45d | 1 | 0.35mi |
| 2901 Borger St Apt 511 Dallas, TX | 2.0 | 2.0 | 1084 | $1,799 | $1.66 | 0d | 1 | 0.48mi |
| 1218 Singleton Blvd Dallas, TX | 1.0 | 1.0 | 756 | $1,670 | $2.21 | 45d | 1 | 0.49mi |
| 1834 Bayside St Dallas, TX | 3.0 | 2.0 | 1322 | $2,000 | $1.51 | 19d | 1 | 0.58mi |
| 1010 Singleton Blvd Unit 1047 Dallas, TX | 2.0 | 2.0 | 990 | $2,276 | $2.30 | 0d | 1 | 0.63mi |
| 1010 Singleton Blvd Unit 1025 Dallas, TX | 1.0 | 1.0 | 756 | $2,081 | $2.75 | 0d | 1 | 0.63mi |
| 996 Singleton Blvd Dallas, TX | 2.0 | 2.0 | 1203 | $1,981 | $1.65 | 4d | 1 | 0.67mi |
| 996 Singleton Blvd Dallas, TX | 1.0 | 1.0 | 774 | $1,350 | $1.74 | 45d | 1 | 0.67mi |
| 996 Singleton Blvd Dallas, TX | 1.0 | 1.0 | 774 | $1,350 | $1.74 | 23d | 1 | 0.67mi |
| 1815 Leath St Dallas, TX | 2.0 | 2.0 | 832 | $2,100 | $2.52 | 3d | 1 | 0.67mi |
| 1902 Angelina Dr Dallas, TX | 3.0 | 1.0 | 1040 | $1,695 | $1.63 | 0d | 1 | 0.70mi |
| 941 Bayonne St Unit 941 Dallas, TX | 2.0 | 2.0 | 917 | $1,295 | $1.41 | 20d | 1 | 0.73mi |
| 941 Bayonne St Unit 939 Dallas, TX | 2.0 | 2.0 | 917 | $1,350 | $1.47 | 5d | 1 | 0.73mi |
| 990 Singleton Blvd Dallas, TX | 2.0 | 1.0–2.5 | 942 | $2,235 | $2.37 | 1d | 26 | 0.74mi |
| 3213 Obenchain St Dallas, TX | 3.0 | 1.0 | 1120 | $1,690 | $1.51 | 45d | 1 | 0.75mi |
| 1293 Clifftop Ln Dallas, TX | 2.0 | 2.5 | 1411 | $2,900 | $2.06 | 45d | 1 | 0.78mi |
| 1641 N Windomere Ave Dallas, TX | 1.0 | 1.0 | 700 | $1,500 | $2.14 | 45d | 1 | 0.98mi |
| 707 Seale St Dallas, TX | 1.0 | 1.0 | 720 | $1,575 | $2.19 | 45d | 1 | 1.04mi |
| 1000 Fort Worth Ave Dallas, TX | 2.0–3.0 | 2.0–2.5 | 1951 | $2,922 | $1.50 | 0d | 5 | 1.07mi |
| 718 Fort Worth Ave Dallas, TX | 3.0 | 3.0 | 1452 | $2,672 | $1.84 | 23d | 1 | 1.09mi |
| 718 Fort Worth Ave Dallas, TX | 1.0 | 1.0 | 744 | $1,391 | $1.87 | 45d | 1 | 1.09mi |
| 718 Fort Worth Ave Dallas, TX | 2.0 | 2.0 | 1163 | $2,026 | $1.74 | 14d | 1 | 1.09mi |
| 718 Fort Worth Ave Dallas, TX | 2.0 | 2.0 | 1163 | $2,026 | $1.74 | 21d | 1 | 1.09mi |
| 718 Fort Worth Ave Dallas, TX | 3.0 | 3.0 | 1452 | $2,672 | $1.84 | 14d | 1 | 1.09mi |
| 718 Fort Worth Ave Dallas, TX | 1.0 | 1.0 | 744 | $1,391 | $1.87 | 17d | 1 | 1.09mi |
| 710 Fort Worth Ave Dallas, TX | 2.0 | 2.0 | 1122 | $1,479 | $1.32 | 45d | 1 | 1.10mi |
| 4043 Gray Oak Pl Dallas, TX | 3.0 | 2.0 | 1152 | $1,999 | $1.74 | 18d | 1 | 1.12mi |
| 4043 Gray Oak Pl Dallas, TX | 3.0 | 2.0 | 1152 | $2,100 | $1.82 | 45d | 1 | 1.12mi |
| 750 Fort Worth Ave Dallas, TX | 2.0 | 2.0 | 1268 | $2,057 | $1.62 | 45d | 1 | 1.16mi |
| 750 Fort Worth Ave Dallas, TX | 2.0 | 1.0–2.0 | 930 | $1,903 | $2.05 | 26d | 10 | 1.16mi |
| 750 Fort Worth Ave Dallas, TX | 3.0 | 1.0–2.0 | 1000 | $1,768 | $1.77 | 0d | 23 | 1.16mi |
Listing history 11 events
-
2026-06-21days on market $699,000 Active 17 DOM
-
2026-06-18days on market $699,000 Active 14 DOM
-
2026-06-17days on market $699,000 Active 13 DOM
-
2026-06-16days on market $699,000 Active 12 DOM
-
2026-06-15days on market $699,000 Active 11 DOM
-
2026-06-13days on market $699,000 Active 9 DOM
-
2026-06-09days on market $699,000 Active 5 DOM
-
2026-06-08days on market $699,000 Active 4 DOM
-
2026-06-07days on market $699,000 Active 3 DOM
-
2026-06-04remarks 699-char remark
-
2026-06-04$699,000 Active 1 DOM
ⓘ Source: listings_history table (triggers on properties + properties_extension) + one-shot
backfill from property_details.listing_events for pre-trigger history.
Tax reassessment forecast TX · Resets to sale price
- Current annual tax
- $4,833 · $403/mo
- Projected year-2 tax
- $12,792 · $1,066/mo
- Expected delta
- +$7,959/yr (+$663/mo · 164.7%)
ⓘ Screening estimate from a state-policy table — verify with the county assessor before closing.
Climate risk First Street
- Flood 1/10 Low FEMA zone X · 0% chance over 30 yrs
- Wildfire 1/10 Low
- Heat 8/10 Severe 7 d/yr ≥109°F today · 24 d/yr by 30 yrs out
- Wind 6/10 Major 27% chance of damaging wind over 30 yrs
- Air quality 3/10 Moderate 2 unhealthy d/yr today · 3 by 30 yrs out
Nearby sold comps map
Loading sold comps map…
Walkable amenities ~0.75 mi
Loading nearby amenities…
Taxation est. · year 1
- Rental income
- $23,188
- − Mortgage interest
- −$39,155
- − Property taxes
- −$4,833
- − Insurance
- −$3,495
- − Repairs & maintenance
- −$1,855
- − Management
- −$1,855
- − Depreciation
- −$20,335
- Taxable loss
- −$48,340
- Est. tax savings @ 24.0%
- +$11,602
- After-tax cash flow
- $-22,396/yr
For passive investors: Depreciation is non-cash, so a rental often shows a tax loss while cash-flowing — sheltering income. Rental losses are passive: they offset passive income freely, and up to $25,000/yr can offset ordinary (W-2) income if you actively participate and your MAGI is under $100k (phasing out to $0 by $150k); unused losses carry forward. On sale, claimed depreciation is recaptured at up to 25%, and gains may owe capital-gains tax (a 1031 exchange can defer both). Figures are a year-1 estimate at your 24.0% rate — not tax advice; consult a CPA.
Schools (NCES district)
- District
- Dallas ISD
- NCES district ID
- 4816230
- Math proficiency
- 31% ▼ -16.00%
- Reading proficiency
- 36% ▼ -4.00%
- Median HH income
- $42,881
- Composite
- 28.41/100
- National rank
- #6763
- State rank
- #559 of 826 in TX
Livability — Dallas
- Score
- 81/100
- State rank
- #24
- US rank
- #1380
Category grades
Schools grade is shown separately in the Schools card above.
Census & demographics
- Census place
- Dallas, TX
- County
- Dallas County · 2,612,404 people
- City population
- 1,168,437
- Metro
- Dallas-Fort Worth-Arlington, TX
- Population (ZIP)
- 28,259
- Household income
- $59,750
- Rent vs Own
- Severe rent burden
- 892.0
Population outlook (Dallas County) Hauer SSP2
- Today (2025)
- 2,979,839 people
- By 2030
- 3,191,823 · +7.1%
- By 2040
- 3,619,611 · +21.5%
- By 2050
- 4,026,915 · +35.1%
- By 2075
- 4,957,073 · +66.4%
- By 2100
- 5,508,725 · +84.9%
Race, ethnicity, and origin ACS 2023
- Neighborhood character
- Predominantly Hispanic (67%)
- Race & ethnicity
- Hispanic / Latino 67% Two or more races 26% Black 23% White 6% Asian 2%
- Hispanic origin (detail)
- Mexican 55%
- Common ancestry
- Slovak 1%
- Foreign-born
- 27% · Canada, Vietnam, Jamaica
- Languages at home
- 42% English-only · Spanish 52% Vietnamese 1%
Political lean MEDSL · Dallas
- 2024 margin
- Strong D (+22.2) · D 60.2% · R 38.0% · Other 1.8%
- 2008→2024 swing
- +6.9pp toward D · 2008: 15.3pp · 2024: 22.2pp
- All cycles
- 2024: D+22.2 2020: D+31.6 2016: D+26.2 2012: D+15.4 2008: D+15.3
Not yet ingested
- Civics
- —
Market trends
- HPI YoY
- ▲ 138.69%
- Current HPI
- 477.2035
- Rent YoY
- ▼ -4.21%
- Metro
- Dallas-Fort Worth-Arlington, TX
- State GDP YoY
- ▲ 3.95%
- F500 in state
- 110
Industry mix (Fortune 500 HQ in TX)
| Industry | F500 HQs | Revenue |
|---|---|---|
| Energy | 16 | $1,198B |
|
||
| Technology | 5 | $198B |
|
||
| Engineering / Construction | 4 | $72B |
|
||
| Energy Services | 3 | $60B |
|
||
| Utilities | 3 | $41B |
|
||
| Healthcare | 2 | $330B |
|
||
Price history
+163.8% since first listed5 events — show timeline
- 2026-06-04 Listed $699,000 NTREIS
- 2026-01-24 Listed $744,900 NTREIS
- 2025-04-02 Sold (Public Records) — Public Records
- 2022-09-06 Listing Removed — NTREIS
- 2022-06-07 Listed $265,000 NTREIS
Property tax history
+16.1%/yrLatest (2025): $4,833 · +26.8% YoY. Source: county tax records.
Cash-flow waterfall
monthlySold comps — $/sqft
last 12 mo · ≤1 miLoading sold comps…