100 E Main St · West Plains, MO
Flood risk No data
- FEMA flood zone
- —
- Chance of flooding over 30 yrs
- —
- Est. flood insurance / yr
- —
Fire risk No data
- Est. fire insurance / yr
- —
Heat risk No data
- Hot days now (above threshold)
- —
- Hot days in 30 yrs
- —
Wind risk No data
- Chance of severe wind over 30 yrs
- —
Air-quality risk No data
- Unhealthy air days now
- —
- Unhealthy air days in 30 yrs
- —
Risk factors via First Street. Map © Google.
Why this score? — see what drove the B- grade
The composite is a weighted blend of 9 inputs, each scored 0–100. Each bar is that input's sub-score; the figure is the points it added to the 100-point composite (weight × sub-score).
- Cash flow +30.0/30.0
- 1% rule +10.0/10.0
- DSCR +10.0/10.0
- ARV discount +7.5/15.0
- Livability +3.9/5.0
- Schools +3.4/10.0
- Rent growth +2.5/5.0
- Condition / age +1.0/5.0
- Appreciation +0.0/10.0
$40,000
🖨 Deal sheet 📄 Offer letter ✓ Due diligence
Listing remarks
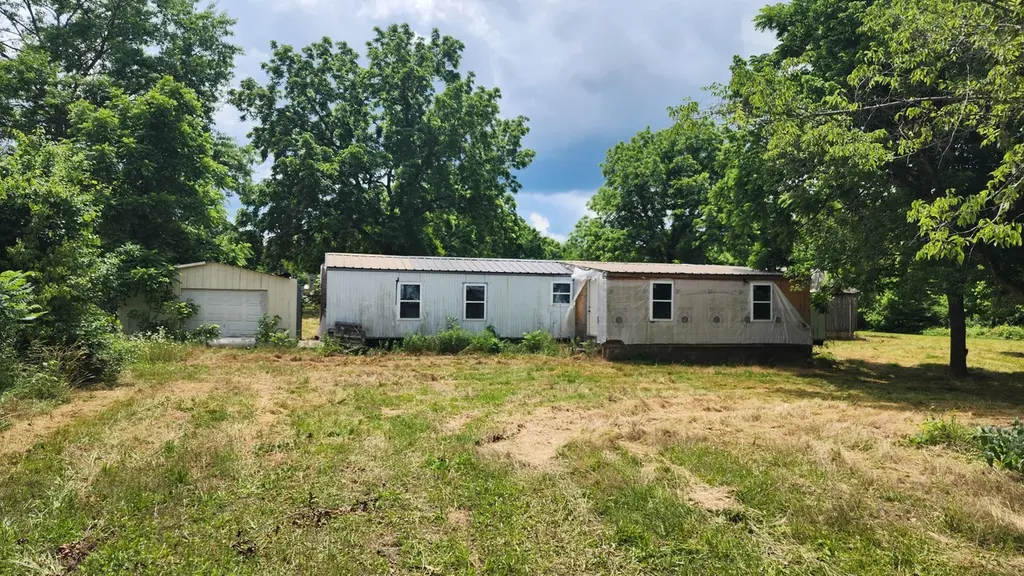
1.38 acres more or less in Brandsville MO. Property has multiple structures including a mobile home that could be finished out and liveable, old grandfathered in mercantile building with a history and another outbuilding. Property lays level with road access on 3 sides. Great location and acreage for a new build or the addition of duplexes and other options. Main Street frontage!
Key facts
- Multiple structures
- Outbuilding
- Mobile home
Tags
Property features AI
Finance
- Other: Directions provided: From West Plains take 63 south to VV Hwy/E Main St in Brandsville. Right on VV to property on left just before railroad tracks.
- Financial info: Annual tax shown (verify for current amount)
Exterior
- Utilities: Public sewer; Other water source
- Home design: Manufactured house; Residential single-family property; One or more stories (manufactured home configuration)
- Construction: Lot approximately 1.4 acres (140 x 300)
- Exterior features: Publicly maintained road access; City street frontage
Interior
- Heating & cooling: No heating; No cooling
- Interior features: No central heating or cooling
Neighborhood map
What this means for you Summary
Snapshot
- This is a 2-bed/2.0-bath single-family listed at $40k. Condition is rated poor.
Deal economics
- At list price, monthly cash flow is $217 ($3k/yr) — positive.
- The deal already cash-flows at list — no discount required.
- Meets the 1% rule at list price ($625 rent vs $40k).
- Cap rate 12.8% vs local median 3.1% in West Plains — top-decile yield for the area; either an underpriced asset or a hidden risk that comps aren't pricing in. Stress-test before assuming the spread holds.
Location & tenants
- Location reads 77/100 on livability (#34 in MO, #2,977 nationally) — a middle-class / working-renter tenant base. Strengths: cost of living A+, health & safety A+, housing A-; Watch: crime C-, commute C-, schools D.
- West Plains R-VII (rural): math 36% / reading 46% proficiency, ranked #152 of 324 in MO (top 47%) — families likely to look elsewhere, expect single-tenant / working-renter base with shorter leases.
- Market conditions: 315 active listings in the ZIP; 1 comparable units currently listed for rent nearby; 53 units permitted in Howell County in 2024 (0 in 5+ unit buildings).
Forward outlook
- Local home prices are declining (-3.0%/yr); year-one equity from $277 of loan paydown is wiped out by about $1k of value loss. Plan a longer hold.
- Howell County population projected at -18% by 2050 — secular population decline; favor cash flow + early exit over multi-decade hold.
- At projected returns (-3.0% appreciation + 3.0% rent growth), your $11k cash investment doubles in ~6 years — after that, you're playing with house money.
Negotiation context
- Only 7 days on market — expect competitive offers; lowballing is unlikely to land.
Questions for the listing agent
- Have any recent inspections been done? Can we get a copy of the seller's disclosures and any deferred-maintenance estimates?
- Is there a deadline driving the sale (1031 exchange, divorce, estate, relocation)? That informs how much negotiation room exists.
- Schools are D-rated, which usually means shorter tenancies and higher turnover. Who's the typical renter profile here, and what's been the actual vacancy rate?
- What's the average days-on-market for RENTAL listings here right now (not sales)? A rising rental-DOM trend means longer vacancies and softer asking-rent achievability than the comps imply.
- What's the recent tenant-quality profile in this submarket — average credit score on applications, eviction rate, late-payment / NSF rate, and stable-employment percentage? A property-management company in the area should have these aggregated.
- How much new for-sale + rental construction is in the pipeline within 1–3 miles? Heavy new supply typically softens prices + rents 12–24 months out; constrained supply supports both.
Investment metrics
- 1% rule
- 1.56% ✓
- Cap rate
- 12.81%
- Cash-on-cash
- 23.28%
- DSCR
- 2.04
- GRM
- 5.3
CMA / ARV
- ARV (on-the-fly)
- $143,344
- Comps found
- 12
Show comp detail 12 sales within ~0.75 mi
| Address | Dist | Beds/Ba | Sqft | Sold | Price | $/sf | Match |
|---|---|---|---|---|---|---|---|
| 609 Woodland Ave | 0.38mi | 2/2.0 | 1,166 (+1%) | 3mo | $159,900 | $137 | 79 |
| 212 W Leyda St | 0.17mi | 3/1.0 (+1) | 1,184 (+2%) | 9mo | $96,900 | $82 | 71 |
| 222 Johnson St | 0.46mi | 3/1.0 (+1) | 1,115 (-4%) | 1mo | $149,000 | $134 | 63 |
| 204 Bartley St | 0.60mi | 3/1.0 (+1) | 1,144 (-1%) | 6mo | $155,000 | $135 | 57 |
| 504 W Leyda St | 0.33mi | 3/1.0 (+1) | 1,064 (-8%) | 9mo | $89,900 | $84 | 55 |
| 824 W Leyda St | 0.55mi | 2/1.0 | 1,050 (-9%) | 2mo | $129,900 | $124 | 54 |
| 1037 W 3rd St | 0.72mi | 3/1.0 (+1) | 1,184 (+2%) | 1mo | $79,900 | $67 | 53 |
| 1021a N College St | 0.65mi | 3/1.0 (+1) | 1,107 (-4%) | 5mo | $124,900 | $113 | 50 |
| 712 S Howell Ave | 0.65mi | 3/1.0 (+1) | 1,236 (+7%) | 0mo | $139,000 | $112 | 49 |
| 914 Armstrong | 0.63mi | 2/1.0 | 1,002 (-13%) | 6mo | $109,000 | $109 | 39 |
| 1028 Armstrong St | 0.75mi | 3/2.0 (+1) | 1,288 (+11%) | 3mo | $199,900 | $155 | 38 |
| 1048 W 3rd St | 0.72mi | 3/1.0 (+1) | 1,308 (+13%) | 7mo | $174,900 | $134 | 29 |
Match score weights: distance 35% · size 25% · config 20% · recency 20%. Top-matched comps best support the ARV.
Projected returns pro-forma
-3.0% appreciation · 3.0% rent growth · sell at horizon
- IRR
- 16.3%
- Equity multiple
- 1.66×
- Total profit
- $7,369
- Equity at exit
- $5,964
- IRR
- 24.9%
- Equity multiple
- 3.17×
- Total profit
- $24,278
- Equity at exit
- $3,458
Cash invested: $11,200 (down + closing). Projections, not guarantees.
Landlord ↔ Tenant lean methodology
- Overall (STATE)
- 81 Strongly Landlord-Friendly
- State Missouri
- 81 Strongly Landlord-Friendly · R+10
- County
- — inherits STATE
- City
- — inherits STATE
ZIP-level market 65775
- Home prices YoY
- -16.4%
- Active inventory
- 315
- Price-to-rent
- 5.3×
Monthly cashflow live
- Estimated rent
- $625 medium interval (Pro) →
- Mortgage (P&I)
- −$210
- Tax est. 1.5%
- −$50 /mo · $600/yr
- Insurance
- −$17
- HOA
- −$0
- Vacancy / Maint / Mgmt
- −$131
- Net cashflow
- $217
Break-even live
UW: 25.0% down · 7.5% · 30yr · 1.5% tax · 5.0% vac · 8.0% maint · 8.0% mgmt
Financing live
Cash to close
- Down payment
- $10,000
- Closing costs
- $1,200
- Reserves months
- —
- Total cash needed
- —
Loan-product check · same deal, 3 products live
Conventional
25% down · 7.5% · 30yr
- Down + closing
- —
- Monthly P&I
- —
- Monthly cashflow
- —
- DSCR
- —
- Eligible?
- —
Personal DTI + credit; lowest rate.
DSCR
20% down · 8.5% · 30yr
- Down + closing
- —
- Monthly P&I
- —
- Monthly cashflow
- —
- DSCR
- —
- Eligible?
- —
No personal income docs; deal must DSCR.
Hard money
10% down · 12.0% · 12mo
- Down + closing
- —
- Monthly P&I
- —
- Monthly cashflow
- —
- DSCR
- —
- Eligible?
- —
Short-term bridge; refi at stabilization.
Rent comps 1 comps
| Address | Beds | Baths | Sqft | Rent | $/sqft | DOM | Units | Dist |
|---|---|---|---|---|---|---|---|---|
| W Main St West Plains, MO | 2.0 | 1.5 | 960 | $625 | $0.65 | 44d | 1 | 0.48mi |
Listing history 6 events
-
2026-06-16status $40,000 Pending 7 DOM
-
2026-06-15days on market $40,000 Active 7 DOM
-
2026-06-13days on market $40,000 Active 5 DOM
-
2026-06-12days on market $40,000 Active 4 DOM
-
2026-06-09remarks 382-char remark
-
2026-06-09$40,000 Active 1 DOM
ⓘ Source: listings_history table (triggers on properties + properties_extension) + one-shot
backfill from property_details.listing_events for pre-trigger history.
Nearby sold comps map
Loading sold comps map…
Walkable amenities ~0.75 mi
Loading nearby amenities…
Taxation est. · year 1
- Rental income
- $7,500
- − Mortgage interest
- −$2,241
- − Property taxes
- −$600
- − Insurance
- −$200
- − Repairs & maintenance
- −$600
- − Management
- −$600
- − Depreciation
- −$1,164
- Taxable income
- $2,096
- Est. tax owed @ 24.0%
- −$503
- After-tax cash flow
- $2,105/yr
For passive investors: Depreciation is non-cash, so a rental often shows a tax loss while cash-flowing — sheltering income. Rental losses are passive: they offset passive income freely, and up to $25,000/yr can offset ordinary (W-2) income if you actively participate and your MAGI is under $100k (phasing out to $0 by $150k); unused losses carry forward. On sale, claimed depreciation is recaptured at up to 25%, and gains may owe capital-gains tax (a 1031 exchange can defer both). Figures are a year-1 estimate at your 24.0% rate — not tax advice; consult a CPA.
Condition & rehab AI · 8 photos
This property requires extensive repairs and maintenance to stabilize the structure and improve its condition. Immediate attention to the roof, exterior siding, and structural repairs is necessary to prevent further damage and ensure safety.
Repairs flagged
- Major roof — Missing shingles, exposed framing
- Major exterior siding — Missing siding, overgrown vegetation
- Major interior structural repairs — Structural damage, debris
- Major electrical and plumbing systems — No visible systems, potential issues
Value-add opportunities
- Both Landscaping and vegetation removal — Improves curb appeal and safety
- Both Structural repairs and debris removal — Stabilizes the structure and removes hazards
- Both Roof replacement — Prevents water damage and improves safety
- Both Exterior siding repair/replacement — Enhances curb appeal and structural integrity
- Both Electrical and plumbing systems repair — Ensures safety and functionality
Renovation cost estimate screening
| Repair item | Severity | Est. cost |
|---|---|---|
| roof · Missing shingles, exposed framing | Major | $15,000–50,000 |
| exterior siding · Missing siding, overgrown vegetation | Major | $15,000–50,000 |
| interior structural repairs · Structural damage, debris | Major | $15,000–50,000 |
| electrical and plumbing systems · No visible systems, potential issues | Major | $15,000–50,000 |
| Total estimated repair cost · 4 items | $60,000–200,000 |
Value-add ROI direction
- Both Landscaping and vegetation removal — Improves curb appeal and safety ↑
- Both Structural repairs and debris removal — Stabilizes the structure and removes hazards ↑
- Both Roof replacement — Prevents water damage and improves safety ↑
- Both Exterior siding repair/replacement — Enhances curb appeal and structural integrity ↑
- Both Electrical and plumbing systems repair — Ensures safety and functionality ↑
ⓘ Cost ranges are severity-bucket heuristics (US national rule-of-thumb). Get contractor quotes + a written scope before underwriting a rehab budget.
Schools (NCES district)
- District
- West Plains R-VII
- NCES district ID
- 2931680
- Math proficiency
- 36% ▼ -5.00%
- Reading proficiency
- 46% ▲ 1.00%
- Median HH income
- $32,206
- Composite
- 33.59/100
- National rank
- #5419
- State rank
- #152 of 324 in MO
Livability — West Plains
- Score
- 77/100
- State rank
- #34
- US rank
- #2977
Category grades
Schools grade is shown separately in the Schools card above.
Census & demographics
- Census place
- West Plains, MO
- Population (ZIP)
- 24,950
Population outlook (Howell County) Hauer SSP2
- Today (2025)
- 38,462 people
- By 2030
- 37,240 · -3.2%
- By 2040
- 34,495 · -10.3%
- By 2050
- 31,450 · -18.2%
- By 2075
- 23,660 · -38.5%
- By 2100
- 16,373 · -57.4%
Race, ethnicity, and origin ACS 2023
- Neighborhood character
- Predominantly White (94%)
- Race & ethnicity
- White 94% Two or more races 4% Hispanic / Latino 2%
- Common ancestry
- Lithuanian 2% Portuguese 2% Slovak 1%
- Foreign-born
- 1% · Canada
- Languages at home
- 97% English-only · Spanish 1% German/W. Germanic 1%
Political lean MEDSL · Howell
- 2024 margin
- Solid R (+66.8) · D 16.2% · R 83.0%
- 2008→2024 swing
- -36.0pp toward R · 2008: -30.8pp · 2024: -66.8pp
- All cycles
- 2024: R+66.8 2020: R+64.2 2016: R+63.2 2012: R+43.8 2008: R+30.8
Not yet ingested
- Civics
- —
Market trends
- HPI YoY
- ▼ -44.99%
- Current HPI
- 228.8763
- Rent YoY
- —
- Metro
- —
- State GDP YoY
- ▲ 1.84%
- F500 in state
- 20
Industry mix (Fortune 500 HQ in MO)
| Industry | F500 HQs | Revenue |
|---|---|---|
| Healthcare | 1 | $163B |
|
||
| Insurance | 1 | $21B |
|
||
| Industrial Technology | 1 | $17B |
|
||
| Retail | 1 | $16B |
|
||
| Industrial Distribution | 1 | $10B |
|
||
| Utilities | 1 | $9B |
|
||
Price history
1 event — show timeline
- 2026-06-08 Listed $40,000 SOMO
Cash-flow waterfall
monthlySold comps — $/sqft
last 12 mo · ≤1 miLoading sold comps…