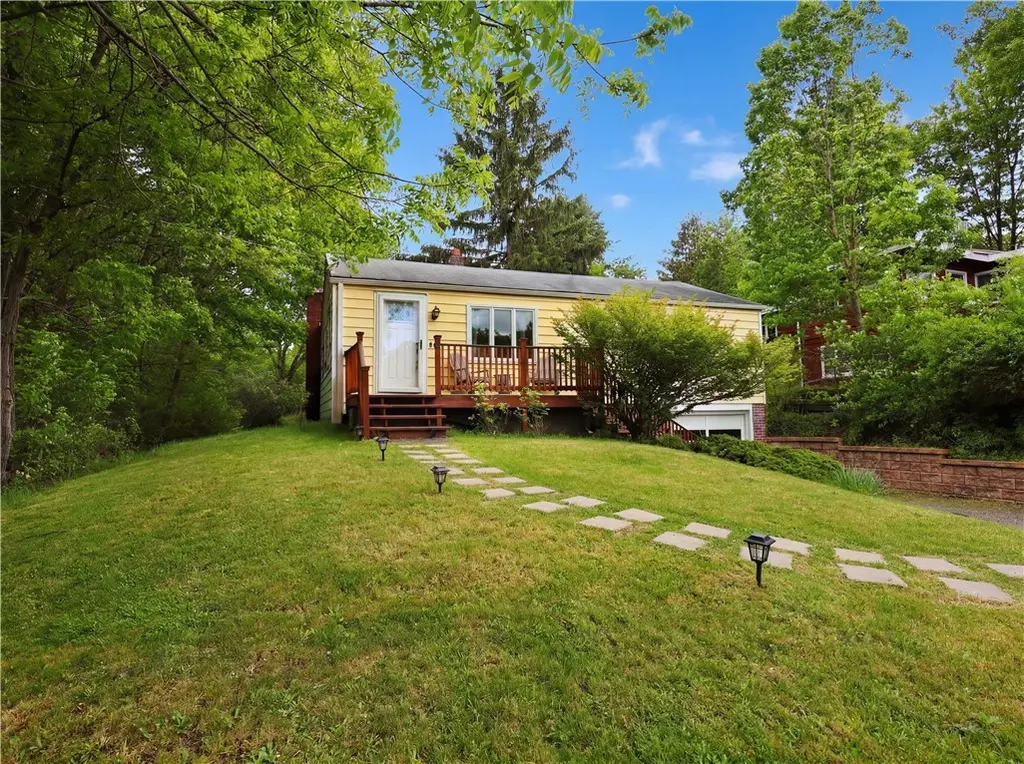
916 Hector St · Ithaca, NY
Flood risk 1/10 · Minimal
- FEMA flood zone
- X
- Chance of flooding over 30 yrs
- 0.0%
- Est. flood insurance / yr
- $473 – $860
Fire risk 3/10 · Minor
- Est. fire insurance / yr
- $691 – $1,283
Heat risk 2/10 · Minimal
- Hot days now (above 97°F)
- 6 days/yr
- Hot days in 30 yrs
- 13 days/yr
Wind risk 2/10 · Minimal
- Chance of severe wind over 30 yrs
- 1.0%
Air-quality risk 2/10 · Minimal
- Unhealthy air days now
- 0 days/yr
- Unhealthy air days in 30 yrs
- 1 days/yr
Risk factors via First Street. Map © Google.
Why this score? — see what drove the B- grade
The composite is a weighted blend of 9 inputs, each scored 0–100. Each bar is that input's sub-score; the figure is the points it added to the 100-point composite (weight × sub-score).
- Cash flow +25.6/30.0
- ARV discount +10.6/15.0
- DSCR +8.5/10.0
- 1% rule +6.8/10.0
- Schools +5.4/10.0
- Livability +3.9/5.0
- Rent growth +3.8/5.0
- Condition / age +2.5/5.0
- Appreciation +0.0/10.0
$339,000
🖨 Deal sheet 📄 Offer letter ✓ Due diligence
Listing remarks MLS
Remarkable Ranch in the City of Ithaca on an easy . 2 acres with a park-like, private back yard. The pictures really do all the talking. .. you'll be pleasantly surprised by the spaciousness of this 1950's home. Large dining room leads to spacious kitchen, and flex space into a palatial living room with sliders to the back deck. 3 sweet bedrooms and a full bath plus a full block basement, and a one car attached garage round out this home. Buy with confidence as the home inspection and radon test have already been done!
Key facts
- 9,525 sq ft lot
- Garage
- Built 1952
Tags
Property features AI
Exterior
- Parking: Underground parking; 1-car garage
- Utilities: Public water connected; Sewer connected
- Home design: Single-story home; Existing construction
- Construction: Vinyl siding; Blown-in insulation; Asphalt shingle roof; Block foundation
- Exterior features: Deck; Open porch; Private yard; Gravel driveway; See remarks
Interior
- Kitchen: Dishwasher; Refrigerator; Electric water heater
- Bedrooms: 3 bedrooms on the main level
- Flooring: Hardwood; Laminate; Varies
- Bathrooms: 1 full bathroom on the main level
- Heating & cooling: Gas forced air heating
- Interior features: Ceiling fan(s); Separate/formal living room; Living/dining room; Sliding glass door(s)
Neighborhood map
What this means for you Summary
Snapshot
- This is a 3-bed/1.0-bath single-family listed at $339k.
Deal economics
- At list price, monthly cash flow is $805 ($10k/yr) — positive.
- The deal already cash-flows at list — no discount required.
- Meets the 1% rule at list price ($4k rent vs $339k).
- Cap rate 9.1% vs local median 5.3% in Ithaca — top-decile yield for the area; either an underpriced asset or a hidden risk that comps aren't pricing in. Stress-test before assuming the spread holds.
Location & tenants
- Location reads 77/100 on livability (#210 in NY, #3,240 nationally) — a middle-class / working-renter tenant base. Strengths: amenities A+, commute A+, health & safety A+; Watch: housing C-, employment D+, cost of living D.
- Ithaca City School District (urban): math 57% / reading 71% proficiency, ranked #195 of 590 in NY (top 33%) — acceptable for families but not a draw, mixed tenant base, ~2y average lease.
- Market conditions: Rents rising fast (+5.2%/yr); 327 active listings in the ZIP; 2 comparable units currently listed for rent nearby; 382 units permitted in Tompkins County in 2024 (208 in 5+ unit buildings).
- At $4,007/mo this rent would consume 67% of the median local household income ($71k/yr) (locally 5169% of renters already pay >50% of income on rent) — very limited rent-growth headroom before tenants either downsize or default.
Forward outlook
- Local home prices are declining (-3.0%/yr); year-one equity from $2k of loan paydown is wiped out by about $10k of value loss. Plan a longer hold.
- Tompkins County population projected at +17% by 2050 — long-run rental-demand tailwind backs the buy-and-hold thesis.
- At projected returns (-3.0% appreciation + 5.2% rent growth), your $95k cash investment doubles in ~9 years — after that, you're playing with house money.
Negotiation context
- Only 3 days on market — expect competitive offers; lowballing is unlikely to land.
- 5 sale attempts since 11y ago with the ask held roughly flat each time — persistent listings suggest the price (not the market) is what's stuck; bring a comps-based counter.
- Current owner paid $220k; list at $339k implies a 54% gain — meaningful room to come down on a strong offer.
Risks & watch-outs
- Watch-outs: built in 1952 — expect roof / HVAC / electrical / plumbing capex.
Questions for the listing agent
- Built in 1952 — when were the roof, HVAC, electrical panel, plumbing, and water heater last replaced?
- Is there a deadline driving the sale (1031 exchange, divorce, estate, relocation)? That informs how much negotiation room exists.
- Schools are A-rated — typically a magnet for longer-tenancy family renters. What's the average tenant stay here, and is there a school-zone premium baked into asking?
- What's the average days-on-market for RENTAL listings here right now (not sales)? A rising rental-DOM trend means longer vacancies and softer asking-rent achievability than the comps imply.
- What's the recent tenant-quality profile in this submarket — average credit score on applications, eviction rate, late-payment / NSF rate, and stable-employment percentage? A property-management company in the area should have these aggregated.
- How much new for-sale + rental construction is in the pipeline within 1–3 miles? Heavy new supply typically softens prices + rents 12–24 months out; constrained supply supports both.
Investment metrics
- 1% rule
- 1.18% ✓
- Cap rate
- 9.14%
- Cash-on-cash
- 10.18%
- DSCR
- 1.45
- GRM
- 7.1
CMA / ARV
- ARV (on-the-fly)
- $364,320
- Comps found
- 8
Show comp detail 8 sales within ~0.75 mi
| Address | Dist | Beds/Ba | Sqft | Sold | Price | $/sf | Match |
|---|---|---|---|---|---|---|---|
| 103 Westmount Dr | 0.16mi | 2/1.5 (-1) | 1,568 (+9%) | 1mo | $361,000 | $230 | 70 |
| 101 Oakwood Ln | 0.04mi | 2/2.0 (-1) | 1,372 (-5%) | 15mo | $365,000 | $266 | 69 |
| 164 Oakwood Ln | 0.24mi | 3/2.0 | 1,440 (0%) | 21mo | $430,000 | $299 | 67 |
| 210 Fallview Ter | 0.13mi | 3/1.5 | 1,557 (+8%) | 17mo | $325,000 | $209 | 64 |
| 407 Richard Pl | 0.53mi | 3/2.0 | 1,400 (-3%) | 14mo | $410,000 | $293 | 55 |
| 325-27 Warren Pl | 0.57mi | 4/2.5 (+1) | 1,500 (+4%) | 3mo | $380,000 | $253 | 53 |
| 298 Westwood Knoll Knl | 0.15mi | 3/2.0 | 1,622 (+13%) | 21mo | $410,000 | $253 | 51 |
| 721 Cliff St | 0.43mi | 3/2.0 | 1,602 (+11%) | 23mo | $371,000 | $232 | 38 |
Match score weights: distance 35% · size 25% · config 20% · recency 20%. Top-matched comps best support the ARV.
Projected returns pro-forma
-3.0% appreciation · 5.22% rent growth · sell at horizon
- IRR
- 1.5%
- Equity multiple
- 1.06×
- Total profit
- $5,574
- Equity at exit
- $50,546
- IRR
- 13.2%
- Equity multiple
- 2.16×
- Total profit
- $110,468
- Equity at exit
- $29,311
Cash invested: $94,920 (down + closing). Projections, not guarantees.
Landlord ↔ Tenant lean methodology
- Overall (STATE)
- 15 Strongly Tenant-Friendly
- State New York
- 15 Strongly Tenant-Friendly · D+10
- County
- — inherits STATE
- City
- — inherits STATE
ZIP-level market 14850
- Rents YoY
- 5.2%
- Active inventory
- 327
- Price-to-rent
- 7.1×
Monthly cashflow live
- Estimated rent
- $4,007 medium interval (Pro) →
- Mortgage (P&I)
- −$1,778
- Tax from tax record
- −$441 /mo · $5,293/yr
- Insurance
- −$141
- HOA
- −$0
- Vacancy / Maint / Mgmt
- −$841
- Net cashflow
- $805
Break-even live
UW: 25.0% down · 7.5% · 30yr · 1.5% tax · 5.0% vac · 8.0% maint · 8.0% mgmt
Financing live
Cash to close
- Down payment
- $84,750
- Closing costs
- $10,170
- Reserves months
- —
- Total cash needed
- —
Loan-product check · same deal, 3 products live
Conventional
25% down · 7.5% · 30yr
- Down + closing
- —
- Monthly P&I
- —
- Monthly cashflow
- —
- DSCR
- —
- Eligible?
- —
Personal DTI + credit; lowest rate.
DSCR
20% down · 8.5% · 30yr
- Down + closing
- —
- Monthly P&I
- —
- Monthly cashflow
- —
- DSCR
- —
- Eligible?
- —
No personal income docs; deal must DSCR.
Hard money
10% down · 12.0% · 12mo
- Down + closing
- —
- Monthly P&I
- —
- Monthly cashflow
- —
- DSCR
- —
- Eligible?
- —
Short-term bridge; refi at stabilization.
Rent comps 2 comps
| Address | Beds | Baths | Sqft | Rent | $/sqft | DOM | Units | Dist |
|---|---|---|---|---|---|---|---|---|
| 323 Taughannock Blvd Ithaca, NY | 2.0 | 1.0–2.5 | 1167 | $6,402 | $5.48 | 43d | 6 | 0.90mi |
| 430 W State St Ithaca, NY | 2.0 | 1.0–2.0 | 727 | $3,410 | $4.69 | 43d | 34 | 1.27mi |
Listing history 3 events
-
2026-06-05statusdays on market $339,000 Pending 3 DOM
-
2026-06-02remarks 675-char remark
-
2026-06-02$339,000 Active 1 DOM
ⓘ Source: listings_history table (triggers on properties + properties_extension) + one-shot
backfill from property_details.listing_events for pre-trigger history.
Tax reassessment forecast NY · Partial reset (capped growth)
- Current annual tax
- $5,293 · $441/mo
- Projected year-2 tax
- $5,511 · $459/mo
- Expected delta
- +$218/yr (+$18/mo · 4.1%)
ⓘ Screening estimate from a state-policy table — verify with the county assessor before closing.
Climate risk First Street
- Flood 1/10 Low FEMA zone X · 0% chance over 30 yrs
- Wildfire 3/10 Moderate
- Heat 2/10 Low 6 d/yr ≥97°F today · 13 d/yr by 30 yrs out
- Wind 2/10 Low 100% chance of damaging wind over 30 yrs
- Air quality 2/10 Low 0 unhealthy d/yr today · 1 by 30 yrs out
Nearby sold comps map
Loading sold comps map…
Walkable amenities ~0.75 mi
Loading nearby amenities…
Taxation est. · year 1
- Rental income
- $48,082
- − Mortgage interest
- −$18,989
- − Property taxes
- −$5,293
- − Insurance
- −$1,695
- − Repairs & maintenance
- −$3,847
- − Management
- −$3,847
- − Depreciation
- −$9,862
- Taxable income
- $4,549
- Est. tax owed @ 24.0%
- −$1,092
- After-tax cash flow
- $8,571/yr
For passive investors: Depreciation is non-cash, so a rental often shows a tax loss while cash-flowing — sheltering income. Rental losses are passive: they offset passive income freely, and up to $25,000/yr can offset ordinary (W-2) income if you actively participate and your MAGI is under $100k (phasing out to $0 by $150k); unused losses carry forward. On sale, claimed depreciation is recaptured at up to 25%, and gains may owe capital-gains tax (a 1031 exchange can defer both). Figures are a year-1 estimate at your 24.0% rate — not tax advice; consult a CPA.
Schools (NCES district)
- District
- Ithaca City School District
- NCES district ID
- 3615570
- Math proficiency
- 57% ▼ -5.00%
- Reading proficiency
- 71% ▲ 11.00%
- Median HH income
- $46,528
- Composite
- 54.01/100
- National rank
- #1397
- State rank
- #195 of 590 in NY
Livability — Ithaca
- Score
- 77/100
- State rank
- #210
- US rank
- #3240
Category grades
Schools grade is shown separately in the Schools card above.
Census & demographics
- Census place
- Ithaca, NY
- County
- Tompkins County · 68,610 people
- City population
- 68,610
- Metro
- Ithaca, NY
- Population (ZIP)
- 68,610
- Household income
- $71,445
- Rent vs Own
- Severe rent burden
- 5169.0
Population outlook (Tompkins County) Hauer SSP2
- Today (2025)
- 113,958 people
- By 2030
- 118,774 · +4.2%
- By 2040
- 125,927 · +10.5%
- By 2050
- 133,599 · +17.2%
- By 2075
- 156,759 · +37.6%
- By 2100
- 169,896 · +49.1%
Race, ethnicity, and origin ACS 2023
- Neighborhood character
- Predominantly White (68%)
- Race & ethnicity
- White 68% Asian 13% Hispanic / Latino 8% Two or more races 8% Black 4%
- Hispanic origin (detail)
- Mexican 2% Puerto Rican 2%
- Common ancestry
- Romanian 3% Italian 3% Scotch-Irish 2%
- Foreign-born
- 18% · China, Canada, South Korea
- Languages at home
- 79% English-only · Chinese 5% Spanish 4% Other Indo-European 4%
Political lean MEDSL · Tompkins
- 2024 margin
- Solid D (+50.6) · D 75.3% · R 24.7%
- 2008→2024 swing
- +8.6pp toward D · 2008: 42.1pp · 2024: 50.6pp
- All cycles
- 2024: D+50.6 2020: D+49.2 2016: D+42.1 2012: D+39.8 2008: D+42.1
Not yet ingested
- Civics
- —
Market trends
- HPI YoY
- ▼ -276.59%
- Current HPI
- 389.7215
- Rent YoY
- ▲ 5.22%
- Metro
- Ithaca, NY
- State GDP YoY
- ▲ 2.60%
- F500 in state
- 92
Industry mix (Fortune 500 HQ in NY)
| Industry | F500 HQs | Revenue |
|---|---|---|
| Financial Services | 10 | $950B |
|
||
| Consumer Goods | 9 | $162B |
|
||
| Insurance | 4 | $225B |
|
||
| Telecommunications | 2 | $144B |
|
||
| Pharmaceuticals | 2 | $112B |
|
||
| Media / Entertainment | 2 | $69B |
|
||
Price history
+93.8% since first listed10 events — show timeline
- 2026-05-31 Listed $339,000 UNYREIS
- 2021-10-08 Sold (MLS) $220,000 UNYREIS
- 2021-10-08 Sold (MLS) $220,000 IBRMLS
- 2021-10-08 Sold (MLS) $220,000 IBRMLS
- 2021-06-10 Listed $225,000 UNYREIS
- 2021-06-10 Listed $225,000 IBRMLS
- 2021-06-10 Listed $225,000 IBRMLS
- 2015-08-13 Sold (Public Records) $174,900 Public Records
- 2015-08-13 Sold (MLS) $164,900 IBRMLS
- 2015-05-03 Listed $174,900 IBRMLS
Property tax history
-0.6%/yrLatest (2025): $5,293 · +2.3% YoY. Source: county tax records.
Cash-flow waterfall
monthlySold comps — $/sqft
last 12 mo · ≤1 miLoading sold comps…