 Multi-family
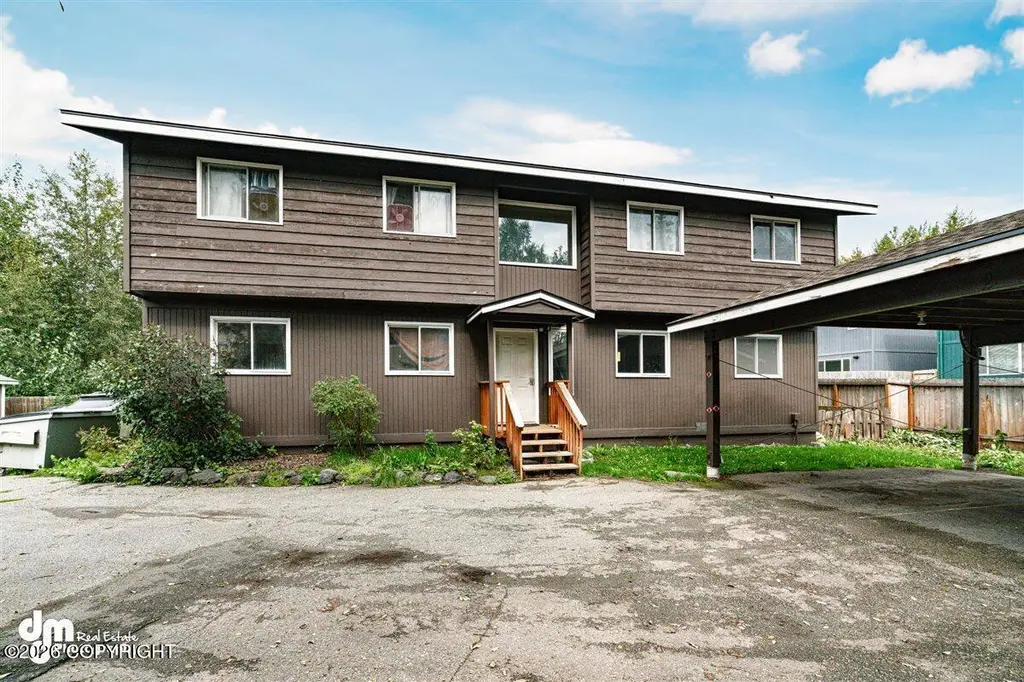
6607 Zurich St · Anchorage, AK
Flood risk 6/10 · Moderate
- FEMA flood zone
- X (unshaded)
- Chance of flooding over 30 yrs
- 0.68%
- Est. flood insurance / yr
- $507 – $1,088
Fire risk No data
- Est. fire insurance / yr
- —
Heat risk No data
- Hot days now (above threshold)
- —
- Hot days in 30 yrs
- —
Wind risk No data
- Chance of severe wind over 30 yrs
- —
Air-quality risk 1/10 · Minimal
- Unhealthy air days now
- —
- Unhealthy air days in 30 yrs
- —
Risk factors via First Street. Map © Google.
Why this score? — see what drove the C grade
The composite is a weighted blend of 9 inputs, each scored 0–100. Each bar is that input's sub-score; the figure is the points it added to the 100-point composite (weight × sub-score).
- Cash flow +20.1/30.0
- ARV discount +7.6/15.0
- DSCR +6.4/10.0
- 1% rule +5.3/10.0
- Rent growth +4.1/5.0
- Condition / age +4.0/5.0
- Livability +3.9/5.0
- Schools +3.7/10.0
- Appreciation +0.0/10.0
$775,000
🖨 Deal sheet 📄 Offer letter ✓ Due diligence
Multi-family units
County records classify this as Multi-Family (2-4 Unit). Listing-text estimate: 1 unit. estimate disagrees with records
Listing remarks
MULTIPLE OFFERS, offers by 4/27 5PM. Meticulously maintained 4plex offering 4 identical 2/1 units with a proven rental history and extensive recent upgrades. Every unit has been refreshed in the past 5 years with new paint, luxury vinyl plank flooring, updated fixtures, and new appliances. The building features in-unit laundry for all tenants and additional exterior storage closets on each deck Mechanical and structural updates are extensive, including a new roof (2020), new upper deck roof (2025), and new mailboxes (2026). The property also features updated dryer and bath exhaust ducting, along with multiple new boilers and water heaters. Upper units include covered decks, and lower units
Key facts
- 0.26 acre lot
- Garage
- Built 1983
Neighborhood map
What this means for you Summary
Snapshot
- This is a 8-bed/4.0-bath multifamily listed at $775k. Condition is rated good.
Deal economics
- At list price, monthly cash flow is $963 ($12k/yr) — positive.
- The deal already cash-flows at list — no discount required.
- Meets the 1% rule at list price ($8k rent vs $775k).
- Cap rate 7.8% vs local median 3.8% in Anchorage — top-decile yield for the area; either an underpriced asset or a hidden risk that comps aren't pricing in. Stress-test before assuming the spread holds.
Location & tenants
- Location reads 78/100 on livability (#6 in AK, #2,553 nationally) — a middle-class / working-renter tenant base. Strengths: amenities A+, commute A+, employment A+; Watch: crime F, cost of living F.
- Anchorage School District (urban): math 37% / reading 43% proficiency, ranked #6 of 21 in AK (top 29%) — families likely to look elsewhere, expect single-tenant / working-renter base with shorter leases.
- Zoned schools: Lake Otis Elementary (math 22% / reading 22%, grade F, #128 of 156 statewide, top 86%, 302 students, 72% FRL); Hanshew Middle School (math 24% / reading 37%, grade F, #27 of 36 statewide, top 74%, 691 students, 42% FRL); Service High School (math 40% / reading 41%, grade F, #21 of 61 statewide, top 33%, 1,544 students, 28% FRL).
- Market conditions: Rents rising fast (+6.3%/yr); 188 active listings in the ZIP; solid renter incomes; 306 units permitted in Anchorage Municipality in 2024 (90 in 5+ unit buildings).
- At $7,999/mo this rent would consume 89% of the median local household income ($108k/yr) (locally 775% of renters already pay >50% of income on rent) — very limited rent-growth headroom before tenants either downsize or default.
Forward outlook
- Local home prices are declining (-3.0%/yr); year-one equity from $5k of loan paydown is wiped out by about $23k of value loss. Plan a longer hold.
- Anchorage County population projected at +12% by 2050 — modest demand growth; plan on rents tracking national, not racing it.
- At projected returns (-3.0% appreciation + 6.3% rent growth), your $217k cash investment doubles in ~10 years — after that, you're playing with house money.
Negotiation context
- Only 6 days on market — expect competitive offers; lowballing is unlikely to land.
- 2 sale attempts since 6y ago with the ask held roughly flat each time — persistent listings suggest the price (not the market) is what's stuck; bring a comps-based counter.
Risks & watch-outs
- Climate carrying-cost: major flood risk — expect insurance premiums to compound above CPI over the hold.
Questions for the listing agent
- Is there a deadline driving the sale (1031 exchange, divorce, estate, relocation)? That informs how much negotiation room exists.
- Schools are B-rated — typically a magnet for longer-tenancy family renters. What's the average tenant stay here, and is there a school-zone premium baked into asking?
- Crime grade is F in this area — have there been break-ins, vandalism, or insurance claims at this property in the last 3 years? What carrier currently insures it and at what premium?
- What's the average days-on-market for RENTAL listings here right now (not sales)? A rising rental-DOM trend means longer vacancies and softer asking-rent achievability than the comps imply.
- What's the recent tenant-quality profile in this submarket — average credit score on applications, eviction rate, late-payment / NSF rate, and stable-employment percentage? A property-management company in the area should have these aggregated.
- How much new apartment / multifamily construction is in the pipeline within 1–3 miles? Heavy new supply (>2% of stock underway) typically softens rents 12–24 months out; light construction supports rent growth.
Investment metrics
- 1% rule
- 1.03% ✓
- Cap rate
- 7.78%
- Cash-on-cash
- 5.33%
- DSCR
- 1.24
- GRM
- 8.1
CMA / ARV
- ARV (on-the-fly)
- $776,540
- Comps found
- 4
Show comp detail 4 sales within ~0.75 mi
| Address | Dist | Beds/Ba | Sqft | Sold | Price | $/sf | Match |
|---|---|---|---|---|---|---|---|
| 6607 Zurich St | 0.00mi | 8/4.0 | 3,788 (0%) | 0mo | $775,000 | $205 | 100 |
| 2221 E 66th Ave | 0.13mi | 8/4.0 | 3,948 (+4%) | 7mo | $450,000 | $114 | 81 |
| 6670 OBrien St | 0.02mi | 7/5.0 (-1) | 3,319 (-12%) | 18mo | $749,000 | $226 | 54 |
| 1810 E 72nd Ave | 0.55mi | 9/6.0 (+1) | 4,328 (+14%) | 1mo | $800,000 | $185 | 37 |
Match score weights: distance 35% · size 25% · config 20% · recency 20%. Top-matched comps best support the ARV.
Projected returns pro-forma
-3.0% appreciation · 6.35% rent growth · sell at horizon
- IRR
- -4.3%
- Equity multiple
- 0.83×
- Total profit
- $-36,239
- Equity at exit
- $115,555
- IRR
- 8.9%
- Equity multiple
- 1.79×
- Total profit
- $170,451
- Equity at exit
- $67,008
Cash invested: $217,000 (down + closing). Projections, not guarantees.
Landlord ↔ Tenant lean methodology
- Overall (STATE)
- 80 Strongly Landlord-Friendly
- State Alaska
- 80 Strongly Landlord-Friendly · R+8
- County
- — inherits STATE
- City
- — inherits STATE
ZIP-level market 99507
- Rents YoY
- 6.3%
- Active inventory
- 188
- Price-to-rent
- 32.3×
Monthly cashflow live
- Estimated rent
- $7,999 high interval (Pro) →
- Mortgage (P&I)
- −$4,064
- Tax est. 1.5%
- −$969 /mo · $11,625/yr
- Insurance
- −$323
- HOA
- −$0
- Vacancy / Maint / Mgmt
- −$1,680
- Net cashflow
- $963
Break-even live
4-unit breakdown (identical units grouped — click to expand)
| Units | Beds | Baths | Est. rent |
|---|---|---|---|
| 4× units | 2 | 1 | $8,000 |
| #1 | 2 | 1 | $2,000 |
| #2 | 2 | 1 | $2,000 |
| #3 | 2 | 1 | $2,000 |
| #4 | 2 | 1 | $2,000 |
| Total (4 units) | $7,999 | ||
UW: 25.0% down · 7.5% · 30yr · 1.5% tax · 5.0% vac · 8.0% maint · 8.0% mgmt
Financing live
Cash to close
- Down payment
- $193,750
- Closing costs
- $23,250
- Reserves months
- —
- Total cash needed
- —
Loan-product check · same deal, 3 products live
Conventional
25% down · 7.5% · 30yr
- Down + closing
- —
- Monthly P&I
- —
- Monthly cashflow
- —
- DSCR
- —
- Eligible?
- —
Personal DTI + credit; lowest rate.
DSCR
20% down · 8.5% · 30yr
- Down + closing
- —
- Monthly P&I
- —
- Monthly cashflow
- —
- DSCR
- —
- Eligible?
- —
No personal income docs; deal must DSCR.
Hard money
10% down · 12.0% · 12mo
- Down + closing
- —
- Monthly P&I
- —
- Monthly cashflow
- —
- DSCR
- —
- Eligible?
- —
Short-term bridge; refi at stabilization.
Listing history 3 events
-
2026-04-28status Pending
-
2026-04-21$775,000 Active
-
2020-03-17$535,000
ⓘ Source: listings_history table (triggers on properties + properties_extension) + one-shot
backfill from property_details.listing_events for pre-trigger history.
Climate risk First Street
- Flood 6/10 Major FEMA zone X (unshaded) · 68% chance over 30 yrs
- Air quality 1/10 Low
Nearby sold comps map
Loading sold comps map…
Walkable amenities ~0.75 mi
Loading nearby amenities…
Taxation est. · year 1
- Rental income
- $95,988
- − Mortgage interest
- −$43,412
- − Property taxes
- −$11,625
- − Insurance
- −$3,875
- − Repairs & maintenance
- −$7,679
- − Management
- −$7,679
- − Depreciation
- −$22,545
- Taxable loss
- −$828
- Est. tax savings @ 24.0%
- +$199
- After-tax cash flow
- $11,759/yr
For passive investors: Depreciation is non-cash, so a rental often shows a tax loss while cash-flowing — sheltering income. Rental losses are passive: they offset passive income freely, and up to $25,000/yr can offset ordinary (W-2) income if you actively participate and your MAGI is under $100k (phasing out to $0 by $150k); unused losses carry forward. On sale, claimed depreciation is recaptured at up to 25%, and gains may owe capital-gains tax (a 1031 exchange can defer both). Figures are a year-1 estimate at your 24.0% rate — not tax advice; consult a CPA.
Condition & rehab AI · 12 photos
This multi-family property is in good condition with recent updates, making it move-in ready for both resale and rental markets.
Value-add opportunities
- Both Paint exterior siding — Enhances curb appeal and can increase both resale and rental value
- Both Replace countertops with quartz or granite — Improves aesthetics and can increase both resale and rental value
- Both Install smart home devices — Enhances convenience and can increase both resale and rental value
Renovation cost estimate screening
Value-add ROI direction
- Both Paint exterior siding — Enhances curb appeal and can increase both resale and rental value ↑
- Both Replace countertops with quartz or granite — Improves aesthetics and can increase both resale and rental value ↑
- Both Install smart home devices — Enhances convenience and can increase both resale and rental value ↑
ⓘ Cost ranges are severity-bucket heuristics (US national rule-of-thumb). Get contractor quotes + a written scope before underwriting a rehab budget.
Schools (NCES district)
- District
- Anchorage School District
- NCES district ID
- 0200180
- Math proficiency
- 37% ▼ -2.00%
- Reading proficiency
- 43% ▲ 1.00%
- Median HH income
- $76,447
- Composite
- 37.0/100
- National rank
- #4523
- State rank
- #6 of 21 in AK
Livability — Anchorage
- Score
- 78/100
- State rank
- #6
- US rank
- #2553
Category grades
Schools grade is shown separately in the Schools card above.
Census & demographics
- Census place
- Anchorage, AK
- County
- Anchorage Borough · 246,594 people
- City population
- 218,117
- Metro
- Anchorage, AK
- Population (ZIP)
- 37,301
- Household income
- $107,992
- Rent vs Own
- Severe rent burden
- 775.0
Population outlook (Anchorage County) Hauer SSP2
- Today (2025)
- 314,993 people
- By 2030
- 321,771 · +2.2%
- By 2040
- 335,493 · +6.5%
- By 2050
- 352,799 · +12.0%
- By 2075
- 414,771 · +31.7%
- By 2100
- 474,485 · +50.6%
Race, ethnicity, and origin ACS 2023
- Neighborhood character
- Diverse neighborhood (Simpson 0.68)
- Race & ethnicity
- White 53% Asian 16% Two or more races 11% Hispanic / Latino 9% Native American 6% Black 4% Pacific Islander 3%
- Hispanic origin (detail)
- Mexican 4% Puerto Rican 1%
- Common ancestry
- Portuguese 3% Romanian 2% Lithuanian 2%
- Foreign-born
- 16% · Canada, South Korea, China
- Languages at home
- 78% English-only · Tagalog/Filipino 8% Other Asian/Pacific 4% Spanish 3%
Political lean MEDSL · Anchorage
- 2024 margin
- D (+12.7) · D 56.3% · R 43.7%
- 2016→2024 swing
- +27.9pp toward D · 2016: -15.2pp · 2024: 12.7pp
- All cycles
- 2024: D+12.7 2016: R+15.2
Not yet ingested
- Civics
- —
Market trends
- HPI YoY
- ▼ -216.29%
- Current HPI
- 273.1227
- Rent YoY
- ▲ 6.35%
- Metro
- Anchorage, AK
- State GDP YoY
- —
- F500 in state
- 0
Price history
+44.9% since first listed3 events — show timeline
- 2026-04-28 Pending — AKMLS
- 2026-04-21 Listed $775,000 AKMLS
- 2020-03-17 Listed $535,000 AKMLS
Cash-flow waterfall
monthlySold comps — $/sqft
last 12 mo · ≤1 miLoading sold comps…