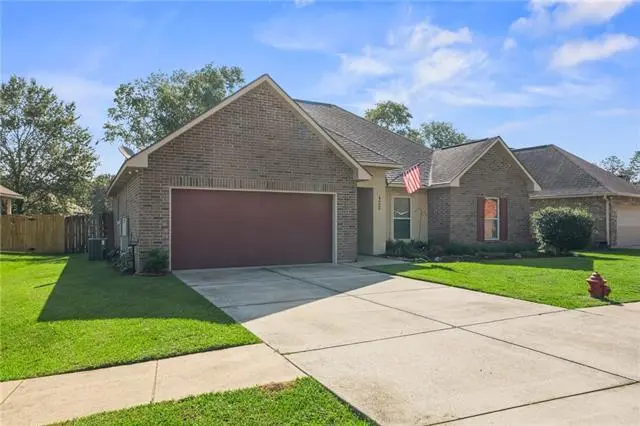
420 Oak Branch Dr · Covington, LA
Flood risk 4/10 · Minor
- FEMA flood zone
- X
- Chance of flooding over 30 yrs
- 0.22%
- Est. flood insurance / yr
- $507 – $1,088
Fire risk 6/10 · Moderate
- Est. fire insurance / yr
- $1,269 – $2,357
Heat risk 9/10 · Severe
- Hot days now (above 108°F)
- 7 days/yr
- Hot days in 30 yrs
- 22 days/yr
Wind risk 9/10 · Severe
- Chance of severe wind over 30 yrs
- 99.0%
Air-quality risk 2/10 · Minimal
- Unhealthy air days now
- 0 days/yr
- Unhealthy air days in 30 yrs
- 1 days/yr
Risk factors via First Street. Map © Google.
Why this score? — see what drove the D grade
The composite is a weighted blend of 9 inputs, each scored 0–100. Each bar is that input's sub-score; the figure is the points it added to the 100-point composite (weight × sub-score).
- Cash flow +12.0/30.0
- ARV discount +10.0/15.0
- Schools +4.3/10.0
- Livability +3.8/5.0
- DSCR +3.5/10.0
- Rent growth +2.5/5.0
- Condition / age +2.5/5.0
- 1% rule +2.4/10.0
- Appreciation +0.0/10.0
$265,000
🖨 Deal sheet (PDF) 📄 Offer letter ✓ Due diligence
Listing remarks MLS
This 3 bedroom 2 bath home has been meticulously cared for. The master bath has two sinks and an extra-large shower. The bedroom has no carpet and has been freshly painted.as a matter of fact the whole house has a fresh coat of Paint! The yard has been landscaped, and the back yard has an extensive concrete patio with a retractable awning for your entertaining delight on those hot summer days,
Key facts
- No carpet
- Freshly painted
- Landscaped yard
Tags
Property features AI
Finance
- HOA & community: Homeowners association with an annual fee of $385
Exterior
- Parking: Garage with two parking spaces; Garage door opener
- Utilities: Public water; Public sewer
- Home design: Single-story; Excellent condition; Slab foundation
- Construction: Brick, stucco, and vinyl siding construction; Shingle roof; Built on slab foundation
- Exterior features: Fence; Patio; Concrete patio; Shed(s)
Interior
- Kitchen: Dishwasher; Oven; Range; Refrigerator
- Bedrooms: Total rooms: 6
- Bathrooms: 2 full bathrooms
- Heating & cooling: Central heating; Central air conditioning
- Interior features: Ceiling fans; Pantry; Stainless steel appliances
Neighborhood map
What this means for you Summary
Snapshot
- This is a 3-bed/2.0-bath single-family listed at $265k.
Deal economics
- At list price, monthly cash flow is $-63 ($-760/yr) — negative.
- To cash-flow at today's rent, offer at most $254k (4.2% below list).
- To meet the 1% rule (rent ≥ 1% of price), the offer needs to be $196k (26.1% below list).
- Recommended offer: $196k (26.1% below list) — sets the bar for 1% rule.
- Cap rate 6.0% vs local median 3.9% in Covington — top-decile yield for the area; either an underpriced asset or a hidden risk that comps aren't pricing in. Stress-test before assuming the spread holds.
Location & tenants
- Location reads 75/100 on livability (#17 in LA, #3,876 nationally) — a middle-class / working-renter tenant base. Strengths: employment A+, housing A+, health & safety A+; Watch: amenities F, commute F.
- St. Tammany Parish (suburban): math 43% / reading 55% proficiency, ranked #11 of 98 in LA (top 11%) — families likely to look elsewhere, expect single-tenant / working-renter base with shorter leases.
- Zoned schools: E. E. Lyon Elementary School (math 57% / reading 57%, grade C+, #79 of 646 statewide, top 13%, 662 students, 63% FRL); Pine View Middle School (math 20% / reading 37%, grade F, #119 of 218 statewide, top 57%, 635 students, 62% FRL); Covington High School (math 32% / reading 44%, grade F, #90 of 265 statewide, top 34%, 1,660 students, 46% FRL) — zoned schools average 57% FRL vs 40% district-wide (17 pts higher); higher-poverty schools than district average — tighter screening recommended.
- Market conditions: 366 active listings in the ZIP; 8 comparable units currently listed for rent nearby; rentals at typical pace (median 26d on market — plan ~3-4 weeks tenant-placement turnaround); solid renter incomes; 1,064 units permitted in St. Tammany Parish in 2024 (0 in 5+ unit buildings).
Forward outlook
- Local home prices are declining (-3.0%/yr); year-one equity from $2k of loan paydown is wiped out by about $8k of value loss. Plan a longer hold.
- St. Tammany County population projected at +27% by 2050 — long-run rental-demand tailwind backs the buy-and-hold thesis.
Negotiation context
- It's been on market 38 days — a 3% lower offer ($257k) is reasonable based on typical stale-listing flexibility.
- 4 sale attempts since 15y ago with the ask held roughly flat each time — persistent listings suggest the price (not the market) is what's stuck; bring a comps-based counter.
- Current owner paid $158k; list at $265k implies a 68% gain — meaningful room to come down on a strong offer.
Risks & watch-outs
- Climate carrying-cost: severe wind risk, 99% chance of damaging wind over 30y; major wildfire risk; extreme-heat days projected 7→22/yr by 2055 (HVAC capex compounding) — expect insurance premiums to compound above CPI over the hold.
Questions for the listing agent
- What do current leases actually rent for vs. the listed asking? Can we see a recent rent roll and the last 12 months of T-12 income?
- It's been on market 38 days. Have you received any prior offers? Is the seller open to a 26% concession, seller financing, or rate buy-down credit?
- What does the HOA fee cover, when was the last increase, and are there any pending special assessments or reserve-fund shortfalls?
- Is there a deadline driving the sale (1031 exchange, divorce, estate, relocation)? That informs how much negotiation room exists.
- Schools are B-rated — typically a magnet for longer-tenancy family renters. What's the average tenant stay here, and is there a school-zone premium baked into asking?
- The area grade is low — what's the realistic commute time and amenity access for the typical tenant pool here? Any planned neighborhood developments (good or bad) we should know about?
- What's the average days-on-market for RENTAL listings here right now (not sales)? A rising rental-DOM trend means longer vacancies and softer asking-rent achievability than the comps imply.
- What's the recent tenant-quality profile in this submarket — average credit score on applications, eviction rate, late-payment / NSF rate, and stable-employment percentage? A property-management company in the area should have these aggregated.
- How much new for-sale + rental construction is in the pipeline within 1–3 miles? Heavy new supply typically softens prices + rents 12–24 months out; constrained supply supports both.
Investment metrics
- 1% rule
- 0.74% ✗
- Cap rate
- 6.01%
- Cash-on-cash
- -1.02%
- DSCR
- 0.95
- GRM
- 11.3
CMA / ARV
- ARV (median comp)
- $280,529
- List price
- $265,000
- Delta
- -5.54%
- Verdict
- FAIR
- Comps
- 20 within 1.0 mi
Show comp detail 12 sales within ~0.75 mi
| Address | Dist | Beds/Ba | Sqft | Sold | Price | $/sf | Match |
|---|---|---|---|---|---|---|---|
| 537 Piney Plains Ln | 0.07mi | 3/2.0 | 1,458 (+0%) | 2mo | $255,000 | $175 | 95 |
| 625 Wild Meadow Way | 0.04mi | 3/2.0 | 1,458 (+0%) | 9mo | $245,000 | $168 | 91 |
| 525 Piney Plains Ln | 0.06mi | 3/2.0 | 1,452 (-0%) | 8mo | $259,250 | $179 | 90 |
| 413 Oak Branch Dr | 0.03mi | 3/2.0 | 1,484 (+2%) | 9mo | $250,000 | $168 | 88 |
| 528 Buckthorne Pl | 0.33mi | 3/2.0 | 1,456 (0%) | 4mo | $233,000 | $160 | 82 |
| 207 Carriage Pines Ln | 0.34mi | 3/2.0 | 1,484 (+2%) | 2mo | $269,500 | $182 | 79 |
| 309 Branch Crossing Dr | 0.34mi | 3/2.5 | 1,569 (+8%) | 6mo | $240,000 | $153 | 65 |
| 700 Covington Point Dr | 0.54mi | 3/2.5 | 1,380 (-5%) | 5mo | $285,000 | $207 | 60 |
| 101 Saint John Cir | 0.44mi | 3/2.0 | 1,617 (+11%) | 2mo | $260,950 | $161 | 60 |
| 500 Buckthorne Pl | 0.40mi | 3/2.0 | 1,593 (+9%) | 10mo | $260,000 | $163 | 58 |
| 18165 Pheasant Ln | 0.37mi | 3/2.0 | 1,648 (+13%) | 9mo | $245,000 | $149 | 53 |
| 405 N Ozone Park Rd | 0.66mi | 3/1.0 | 1,286 (-12%) | 7mo | $110,000 | $86 | 40 |
Match score weights: distance 35% · size 25% · config 20% · recency 20%. Top-matched comps best support the ARV.
Projected returns pro-forma
-3.0% appreciation · 3.0% rent growth · sell at horizon
- IRR
- -18.0%
- Equity multiple
- 0.37×
- Total profit
- $-47,080
- Equity at exit
- $39,512
- IRR
- -10.4%
- Equity multiple
- 0.37×
- Total profit
- $-46,622
- Equity at exit
- $22,912
Cash invested: $74,200 (down + closing). Projections, not guarantees.
Landlord ↔ Tenant lean methodology
- Overall (STATE)
- 90 Strongly Landlord-Friendly
- State Louisiana
- 90 Strongly Landlord-Friendly · R+12
- County
- — inherits STATE
- City
- — inherits STATE
ZIP-level market 70435
- Home prices YoY
- -27.3%
- Active inventory
- 366
- Price-to-rent
- 11.3×
Monthly cashflow live
- Estimated rent
- $1,958 high interval (Pro) →
- Mortgage (P&I)
- −$1,390
- Tax from tax record
- −$78 /mo · $936/yr
- Insurance
- −$110
- HOA
- −$32
- Vacancy / Maint / Mgmt
- −$411
- Net cashflow
- $-63
Break-even live
Sensitivity live
| Price | -10% $87 | -5% $12 | +0% $-63 | +5% $-138 | +10% $-213 |
|---|---|---|---|---|---|
| Rent | -10% $-218 | -5% $-141 | +0% $-63 | +5% $14 | +10% $91 |
| Rate | -1.0pp $70 | -0.5pp $4 | base $-63 | +0.5pp $-132 | +1.0pp $-202 |
UW: 25.0% down · 7.5% · 30yr · 1.5% tax · 5.0% vac · 8.0% maint · 8.0% mgmt
Financing live
Cash to close
- Down payment
- $66,250
- Closing costs
- $7,950
- Reserves months
- —
- Total cash needed
- —
Loan-product check · same deal, 3 products live
Conventional
25% down · 7.5% · 30yr
- Down + closing
- —
- Monthly P&I
- —
- Monthly cashflow
- —
- DSCR
- —
- Eligible?
- —
Personal DTI + credit; lowest rate.
DSCR
20% down · 8.5% · 30yr
- Down + closing
- —
- Monthly P&I
- —
- Monthly cashflow
- —
- DSCR
- —
- Eligible?
- —
No personal income docs; deal must DSCR.
Hard money
10% down · 12.0% · 12mo
- Down + closing
- —
- Monthly P&I
- —
- Monthly cashflow
- —
- DSCR
- —
- Eligible?
- —
Short-term bridge; refi at stabilization.
Rent comps 8 comps
| Address | Beds | Baths | Sqft | Rent | $/sqft | DOM | Units | Dist |
|---|---|---|---|---|---|---|---|---|
| 208 Knoll Pine Cir Covington, LA | 3.0 | 2.0 | 1613 | $1,900 | $1.18 | 19d | 1 | 0.27mi |
| 1419 N Hosmer St Covington, LA | 3.0 | 2.0 | 1401 | $1,950 | $1.39 | 21d | 1 | 0.87mi |
| 325 E Hornsby St Covington, LA | 2.0 | 2.0 | 1040 | $1,650 | $1.59 | 25d | 1 | 0.94mi |
| 1016 Ronald Reagan Hwy Covington, LA | 1.0–3.0 | 1.0–2.0 | 1081 | $1,745 | $1.61 | 3d | 24 | 0.95mi |
| 17361 Regina Coeli Rd Covington, LA | 2.0 | 1.5 | 1100 | $1,350 | $1.23 | 25d | 1 | 1.10mi |
| 2000 Pine Crest Ave Covington, LA | 2.0–4.0 | 2.0 | 1121 | $1,411 | $1.26 | 25d | 1 | 1.11mi |
| 209 W 31st Ave Covington, LA | 3.0 | 2.0 | 1100 | $1,450 | $1.32 | 16d | 1 | 1.30mi |
| 720 N Tyler St Covington, LA | 3.0 | 2.0 | 1336 | $1,500 | $1.12 | 45d | 1 | 1.45mi |
HOA detail
- Monthly dues
- $32 · $384/yr
Listing history 19 events
-
2026-06-21days on market $265,000 Active 38 DOM
-
2026-06-18days on market $265,000 Active 35 DOM
-
2026-06-17days on market $265,000 Active 34 DOM
-
2026-06-16days on market $265,000 Active 33 DOM
-
2026-06-15days on market $265,000 Active 32 DOM
-
2026-06-13days on market $265,000 Active 30 DOM
-
2026-06-10days on market $265,000 Active 27 DOM
-
2026-06-09days on market $265,000 Active 26 DOM
-
2026-06-08days on market $265,000 Active 25 DOM
-
2026-06-07days on market $265,000 Active 24 DOM
-
2026-06-03days on market $265,000 Active 20 DOM
-
2026-06-02days on market $265,000 Active 19 DOM
-
2026-06-01days on market $265,000 Active 18 DOM
-
2026-05-31days on market $265,000 Active 17 DOM
-
2026-05-14$265,000 Active 397-char remark
Show marketing remark (396 chars)
This 3 bedroom 2 bath home has been meticulously cared for. The master bath has two sinks and an extra-large shower. The bedroom has no carpet and has been freshly painted.as a matter of fact the whole house has a fresh coat of Paint! The yard has been landscaped, and the back yard has an extensive concrete patio with a retractable awning for your entertaining delight on those hot summer days,
-
2026-05-14$265,000 Active 396-char remark
Show marketing remark (396 chars)
This 3 bedroom 2 bath home has been meticulously cared for. The master bath has two sinks and an extra-large shower. The bedroom has no carpet and has been freshly painted.as a matter of fact the whole house has a fresh coat of Paint! The yard has been landscaped, and the back yard has an extensive concrete patio with a retractable awning for your entertaining delight on those hot summer days,
-
2012-04-26soldstatus $157,900
Show marketing remark (329 chars)
The Nottingham Plan offers 3 bedrooms, 2 baths, and over 1400' of living area. The Master Suite features double sinks with a garden tub and spacious closet. Hurry while there in still time to pick colors and add upgrade options. Builder will pay up to $5000 in closing costs. (Some restricions apply) Completion Date: April 2012
-
2011-12-09$157,900
Show marketing remark (329 chars)
The Nottingham Plan offers 3 bedrooms, 2 baths, and over 1400' of living area. The Master Suite features double sinks with a garden tub and spacious closet. Hurry while there in still time to pick colors and add upgrade options. Builder will pay up to $5000 in closing costs. (Some restricions apply) Completion Date: April 2012
ⓘ Source: listings_history table (triggers on properties + properties_extension) + one-shot
backfill from property_details.listing_events for pre-trigger history.
Tax reassessment forecast LA · Resets to sale price
- Current annual tax
- $936 · $78/mo
- Projected year-2 tax
- $1,458 · $121/mo
- Expected delta
- +$522/yr (+$43/mo · 55.8%)
ⓘ Screening estimate from a state-policy table — verify with the county assessor before closing.
Climate risk First Street
- Flood 4/10 Moderate FEMA zone X · 22% chance over 30 yrs
- Wildfire 6/10 Major
- Heat 9/10 Extreme 7 d/yr ≥108°F today · 22 d/yr by 30 yrs out
- Wind 9/10 Extreme 99% chance of damaging wind over 30 yrs
- Air quality 2/10 Low 0 unhealthy d/yr today · 1 by 30 yrs out
Nearby sold comps map
Loading sold comps map…
Walkable amenities ~0.75 mi
Loading nearby amenities…
Taxation est. · year 1
- Rental income
- $23,495
- − Mortgage interest
- −$14,844
- − Property taxes
- −$936
- − Insurance
- −$1,325
- − Repairs & maintenance
- −$1,880
- − Management
- −$1,880
- − HOA
- −$384
- − Depreciation
- −$7,709
- Taxable loss
- −$5,462
- Est. tax savings @ 24.0%
- +$1,311
- After-tax cash flow
- $551/yr
For passive investors: Depreciation is non-cash, so a rental often shows a tax loss while cash-flowing — sheltering income. Rental losses are passive: they offset passive income freely, and up to $25,000/yr can offset ordinary (W-2) income if you actively participate and your MAGI is under $100k (phasing out to $0 by $150k); unused losses carry forward. On sale, claimed depreciation is recaptured at up to 25%, and gains may owe capital-gains tax (a 1031 exchange can defer both). Figures are a year-1 estimate at your 24.0% rate — not tax advice; consult a CPA.
Schools (NCES district)
- District
- St. Tammany Parish
- NCES district ID
- 2201650
- Math proficiency
- 43% ▼ -32.00%
- Reading proficiency
- 55% ▼ -26.00%
- Median HH income
- $61,752
- Composite
- 43.04/100
- National rank
- #3098
- State rank
- #11 of 98 in LA
Livability — Covington
- Score
- 75/100
- State rank
- #17
- US rank
- #3876
Category grades
Schools grade is shown separately in the Schools card above.
Census & demographics
- Census place
- Covington, LA
- County
- Saint Tammany Parish · 228,296 people
- City population
- 64,351
- Metro
- New Orleans-Metairie, LA
- Population (ZIP)
- 22,475
- Household income
- $80,926
- Rent vs Own
- Severe rent burden
- 296.0
Population outlook (St. Tammany County) Hauer SSP2
- Today (2025)
- 286,725 people
- By 2030
- 304,175 · +6.1%
- By 2040
- 336,203 · +17.3%
- By 2050
- 364,590 · +27.2%
- By 2075
- 433,362 · +51.1%
- By 2100
- 470,333 · +64.0%
Race, ethnicity, and origin ACS 2023
- Neighborhood character
- Predominantly White (84%)
- Race & ethnicity
- White 84% Black 9% Two or more races 4% Hispanic / Latino 3% Pacific Islander 2%
- Common ancestry
- Lithuanian 15% Serbian 1% Slovak 1%
- Foreign-born
- 2% · Canada
- Languages at home
- 97% English-only · Spanish 1% French/Haitian/Cajun 1%
Political lean MEDSL · St. Tammany
- 2024 margin
- Solid R (+43.8) · D 27.3% · R 71.1% · Other 1.6%
- 2008→2024 swing
- +9.6pp toward D · 2008: -53.4pp · 2024: -43.8pp
- All cycles
- 2024: R+43.8 2020: R+44.2 2016: R+50.8 2012: R+52.2 2008: R+53.4
Not yet ingested
- Civics
- —
Market trends
- HPI YoY
- ▼ -76.03%
- Current HPI
- 202.0458
- Rent YoY
- —
- Metro
- New Orleans-Metairie, LA
- State GDP YoY
- ▲ 3.29%
- F500 in state
- 10
Industry mix (Fortune 500 HQ in LA)
| Industry | F500 HQs | Revenue |
|---|---|---|
| Telecommunications | 2 | $23B |
|
||
| Utilities | 1 | $12B |
|
||
| Wholesale / Distribution | 1 | $5B |
|
||
| Advertising | 1 | $2B |
|
||
Price history
+67.8% since first listed5 events — show timeline
- 2026-05-14 Listed $265,000 AcadianaMLS
- 2026-05-14 Listed $265,000 GSREIN
- 2012-04-26 Sold (MLS) $157,900 GSREIN
- 2011-12-09 Listed $157,900 AcadianaMLS
- 2011-12-09 Listed $157,900 GSREIN
Property tax history
-5.8%/yrLatest (2025): $936 · -3.4% YoY. Source: county tax records.
Cash-flow waterfall
monthlySold comps — $/sqft
last 12 mo · ≤1 miLoading sold comps…