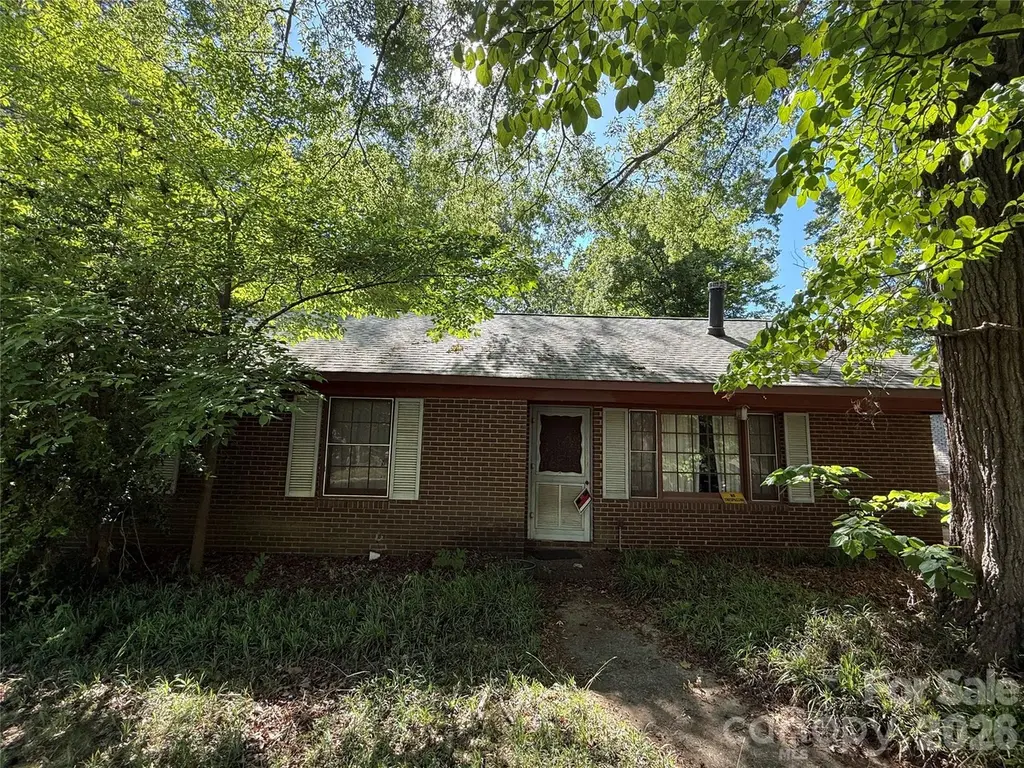
10100 Starwood Dr · Harrisburg, NC
Flood risk 1/10 · Minimal
- FEMA flood zone
- X (unshaded)
- Chance of flooding over 30 yrs
- 0.0%
- Est. flood insurance / yr
- $507 – $1,088
Fire risk 2/10 · Minimal
- Est. fire insurance / yr
- $906 – $1,684
Heat risk 6/10 · Moderate
- Hot days now (above 105°F)
- 7 days/yr
- Hot days in 30 yrs
- 17 days/yr
Wind risk 5/10 · Moderate
- Chance of severe wind over 30 yrs
- 25.0%
Air-quality risk 4/10 · Minor
- Unhealthy air days now
- 4 days/yr
- Unhealthy air days in 30 yrs
- 5 days/yr
Risk factors via First Street. Map © Google.
Why this score? — see what drove the B- grade
The composite is a weighted blend of 9 inputs, each scored 0–100. Each bar is that input's sub-score; the figure is the points it added to the 100-point composite (weight × sub-score).
- Cash flow +25.1/30.0
- ARV discount +15.0/15.0
- DSCR +8.2/10.0
- 1% rule +6.0/10.0
- Schools +4.7/10.0
- Livability +4.0/5.0
- Rent growth +2.9/5.0
- Condition / age +2.5/5.0
- Appreciation +0.0/10.0
$220,000
🖨 Deal sheet 📄 Offer letter ✓ Due diligence
Listing remarks
Welcome to 10100 Starwood Drive. This 3-bed 1.5 bath home located in Charlotte is suitable for first-time home buyers or investors looking to add value.
Key facts
- 0.26 acre lot
- Built 1976
- Listed 17 days
Property features AI
Finance
- HOA & community: No HOA
Exterior
- Parking: Driveway (no main level garage)
- Utilities: City water; Public sewer
- Home design: Single-family residence; One story; Site built; Brick exterior; Crawl space foundation
- Construction: Site built construction; Brick full exterior
- Exterior features: Stone and concrete road surfaces; Publicly maintained road
Interior
- Kitchen: No appliances listed
- Bedrooms: 3 bedrooms on the main level
- Bathrooms: 1 full bathroom; 1 half bathroom
- Heating & cooling: No heating system listed; No cooling system listed
- Interior features: 7 total rooms; Fireplace
- Laundry & utility: No laundry features listed
Neighborhood map
What this means for you Summary
Snapshot
- This is a 3-bed/1.5-bath single-family listed at $220k.
Deal economics
- At list price, monthly cash flow is $485 ($6k/yr) — positive.
- The deal already cash-flows at list — no discount required.
- Meets the 1% rule at list price ($2k rent vs $220k).
- Recommended offer: $217k (1.5% below list) — sets the bar for market timing.
- Cap rate 8.9% vs local median 3.1% in Harrisburg — top-decile yield for the area; either an underpriced asset or a hidden risk that comps aren't pricing in. Stress-test before assuming the spread holds.
Location & tenants
- Location reads 79/100 on livability (#23 in NC, #2,104 nationally) — a middle-class / working-renter tenant base. Strengths: employment A+, housing A+, crime A; Watch: cost of living C-, commute F.
- Cabarrus County Schools (rural): math 54% / reading 55% proficiency, ranked #44 of 178 in NC (top 25%) — acceptable for families but not a draw, mixed tenant base, ~2y average lease.
- Market conditions: Rents rising (+1.8%/yr); 562 active listings in the ZIP; 2 comparable units currently listed for rent nearby; 2,485 units permitted in Cabarrus County in 2024 (677 in 5+ unit buildings).
- This rent runs 41% of the median local income ($71k/yr) — at the standard rent-burdened threshold; future hikes will face affordability resistance.
Forward outlook
- Local home prices are declining (-3.0%/yr); year-one equity from $2k of loan paydown is wiped out by about $7k of value loss. Plan a longer hold.
- Cabarrus County population projected at +44% by 2050 — long-run rental-demand tailwind backs the buy-and-hold thesis.
Negotiation context
- It's been on market 17 days — a 2% lower offer ($217k) is reasonable based on typical stale-listing flexibility.
- Current owner paid $40k; list at $220k implies a 450% gain — meaningful room to come down on a strong offer.
Risks & watch-outs
- Climate carrying-cost: moderate wind risk, 25% chance of damaging wind over 30y; extreme-heat days projected 7→17/yr by 2055 (HVAC capex compounding) — expect insurance premiums to compound above CPI over the hold.
Questions for the listing agent
- Built in 1976 — when were the roof, HVAC, electrical panel, plumbing, and water heater last replaced?
- Is there a deadline driving the sale (1031 exchange, divorce, estate, relocation)? That informs how much negotiation room exists.
- Schools are B-rated — typically a magnet for longer-tenancy family renters. What's the average tenant stay here, and is there a school-zone premium baked into asking?
- What's the average days-on-market for RENTAL listings here right now (not sales)? A rising rental-DOM trend means longer vacancies and softer asking-rent achievability than the comps imply.
- What's the recent tenant-quality profile in this submarket — average credit score on applications, eviction rate, late-payment / NSF rate, and stable-employment percentage? A property-management company in the area should have these aggregated.
- How much new for-sale + rental construction is in the pipeline within 1–3 miles? Heavy new supply typically softens prices + rents 12–24 months out; constrained supply supports both.
Investment metrics
- 1% rule
- 1.10% ✓
- Cap rate
- 8.94%
- Cash-on-cash
- 9.45%
- DSCR
- 1.42
- GRM
- 7.6
CMA / ARV
- ARV (on-the-fly)
- $318,976
- Comps found
- 11
Show comp detail 11 sales within ~0.75 mi
| Address | Dist | Beds/Ba | Sqft | Sold | Price | $/sf | Match |
|---|---|---|---|---|---|---|---|
| 10201 Starwood Dr | 0.11mi | 3/2.0 | 1,240 (-0%) | 7mo | $270,000 | $218 | 87 |
| 5313 Larewood Dr | 0.21mi | 4/1.5 (+1) | 1,211 (-3%) | 1mo | $280,000 | $231 | 80 |
| 10101 Arbordale Ave | 0.04mi | 3/1.0 | 1,140 (-8%) | 3mo | $299,000 | $262 | 80 |
| 10108 Starwood Dr #13 | 0.03mi | 4/1.5 (+1) | 1,179 (-5%) | 10mo | $260,000 | $221 | 76 |
| 10129 Rockwood Rd | 0.27mi | 3/2.0 | 1,320 (+6%) | 2mo | $358,900 | $272 | 74 |
| 10305 Starwood Dr | 0.21mi | 3/2.0 | 1,344 (+8%) | 2mo | $345,000 | $257 | 73 |
| 10012 Rockwood Rd | 0.32mi | 3/2.0 | 1,170 (-6%) | 1mo | $300,000 | $256 | 72 |
| 10050 Lilac Ct | 0.10mi | 3/2.0 | 1,408 (+13%) | 8mo | $360,000 | $256 | 65 |
| 10356 Black Locust Ln | 0.37mi | 3/2.0 | 1,401 (+12%) | 3mo | $383,000 | $273 | 57 |
| 10308 Starwood Dr | 0.23mi | 3/2.0 | 1,375 (+10%) | 19mo | $278,000 | $202 | 54 |
| 10249 Black Locust Ln | 0.23mi | 3/2.0 | 1,430 (+15%) | 17mo | $402,500 | $281 | 49 |
Match score weights: distance 35% · size 25% · config 20% · recency 20%. Top-matched comps best support the ARV.
Projected returns pro-forma
-3.0% appreciation · 1.76% rent growth · sell at horizon
- IRR
- -3.4%
- Equity multiple
- 0.87×
- Total profit
- $-7,759
- Equity at exit
- $32,803
- IRR
- 4.9%
- Equity multiple
- 1.34×
- Total profit
- $21,019
- Equity at exit
- $19,022
Cash invested: $61,600 (down + closing). Projections, not guarantees.
Landlord ↔ Tenant lean methodology
- Overall (STATE)
- 85 Strongly Landlord-Friendly
- State North Carolina
- 85 Strongly Landlord-Friendly · R+3
- County
- — inherits STATE
- City
- — inherits STATE
ZIP-level market 28215
- Rents YoY
- 1.8%
- Active inventory
- 562
- Price-to-rent
- 7.6×
Monthly cashflow live
- Estimated rent
- $2,411 medium interval (Pro) →
- Mortgage (P&I)
- −$1,154
- Tax from tax record
- −$174 /mo · $2,093/yr
- Insurance
- −$92
- HOA
- −$0
- Vacancy / Maint / Mgmt
- −$506
- Net cashflow
- $485
Break-even live
UW: 25.0% down · 7.5% · 30yr · 1.5% tax · 5.0% vac · 8.0% maint · 8.0% mgmt
Financing live
Cash to close
- Down payment
- $55,000
- Closing costs
- $6,600
- Reserves months
- —
- Total cash needed
- —
Loan-product check · same deal, 3 products live
Conventional
25% down · 7.5% · 30yr
- Down + closing
- —
- Monthly P&I
- —
- Monthly cashflow
- —
- DSCR
- —
- Eligible?
- —
Personal DTI + credit; lowest rate.
DSCR
20% down · 8.5% · 30yr
- Down + closing
- —
- Monthly P&I
- —
- Monthly cashflow
- —
- DSCR
- —
- Eligible?
- —
No personal income docs; deal must DSCR.
Hard money
10% down · 12.0% · 12mo
- Down + closing
- —
- Monthly P&I
- —
- Monthly cashflow
- —
- DSCR
- —
- Eligible?
- —
Short-term bridge; refi at stabilization.
Rent comps 2 comps
| Address | Beds | Baths | Sqft | Rent | $/sqft | DOM | Units | Dist |
|---|---|---|---|---|---|---|---|---|
| 914 Grays Mill Rd Charlotte, NC | 1.0–3.0 | 1.0–3.0 | 1240 | $2,701 | $2.18 | 1d | 18 | 1.12mi |
| 8701 Brookstead Dr Charlotte, NC | 3.0 | 2.0 | 1294 | $1,849 | $1.43 | 3d | 1 | 1.26mi |
Listing history 12 events
-
2026-06-18days on market $220,000 Active 17 DOM
-
2026-06-17days on market $220,000 Active 16 DOM
-
2026-06-16days on market $220,000 Active 15 DOM
-
2026-06-15days on market $220,000 Active 14 DOM
-
2026-06-13days on market $220,000 Active 12 DOM
-
2026-06-09days on market $220,000 Active 8 DOM
-
2026-06-08days on market $220,000 Active 7 DOM
-
2026-06-07days on market $220,000 Active 6 DOM
-
2026-06-04days on market $220,000 Active 3 DOM
-
2026-06-03days on market $220,000 Active 2 DOM
-
2026-06-02remarks 152-char remark
-
2026-06-02$220,000 Active 1 DOM
ⓘ Source: listings_history table (triggers on properties + properties_extension) + one-shot
backfill from property_details.listing_events for pre-trigger history.
Tax reassessment forecast NC · Resets to sale price
- Current annual tax
- $2,093 · $174/mo
- Projected year-2 tax
- $2,093 · $174/mo
- Expected delta
- $0/yr ($0/mo · 0.0%)
ⓘ Screening estimate from a state-policy table — verify with the county assessor before closing.
Climate risk First Street
- Flood 1/10 Low FEMA zone X (unshaded) · 0% chance over 30 yrs
- Wildfire 2/10 Low
- Heat 6/10 Major 7 d/yr ≥105°F today · 17 d/yr by 30 yrs out
- Wind 5/10 Major 25% chance of damaging wind over 30 yrs
- Air quality 4/10 Moderate 4 unhealthy d/yr today · 5 by 30 yrs out
Nearby sold comps map
Loading sold comps map…
Walkable amenities ~0.75 mi
Loading nearby amenities…
Taxation est. · year 1
- Rental income
- $28,933
- − Mortgage interest
- −$12,323
- − Property taxes
- −$2,093
- − Insurance
- −$1,100
- − Repairs & maintenance
- −$2,315
- − Management
- −$2,315
- − Depreciation
- −$6,400
- Taxable income
- $2,387
- Est. tax owed @ 24.0%
- −$573
- After-tax cash flow
- $5,247/yr
For passive investors: Depreciation is non-cash, so a rental often shows a tax loss while cash-flowing — sheltering income. Rental losses are passive: they offset passive income freely, and up to $25,000/yr can offset ordinary (W-2) income if you actively participate and your MAGI is under $100k (phasing out to $0 by $150k); unused losses carry forward. On sale, claimed depreciation is recaptured at up to 25%, and gains may owe capital-gains tax (a 1031 exchange can defer both). Figures are a year-1 estimate at your 24.0% rate — not tax advice; consult a CPA.
Schools (NCES district)
- District
- Cabarrus County Schools
- NCES district ID
- 3700530
- Math proficiency
- 54% ▲ 4.00%
- Reading proficiency
- 55% ▲ 3.00%
- Median HH income
- $59,442
- Composite
- 47.42/100
- National rank
- #2282
- State rank
- #44 of 178 in NC
Livability — Harrisburg
- Score
- 79/100
- State rank
- #23
- US rank
- #2104
Category grades
Schools grade is shown separately in the Schools card above.
Census & demographics
- County
- Mecklenburg County · 1,167,319 people
- City population
- 21,517
- Metro
- Charlotte-Concord-Gastonia, NC-SC
- Population (ZIP)
- 66,674
- Household income
- $71,162
- Rent vs Own
- Severe rent burden
- 1952.0
Population outlook (Cabarrus County) Hauer SSP2
- Today (2025)
- 239,273 people
- By 2030
- 260,754 · +9.0%
- By 2040
- 303,953 · +27.0%
- By 2050
- 344,827 · +44.1%
- By 2075
- 435,623 · +82.1%
- By 2100
- 490,119 · +104.8%
Race, ethnicity, and origin ACS 2023
- Neighborhood character
- Diverse neighborhood (Simpson 0.66)
- Race & ethnicity
- Black 50% Hispanic / Latino 23% White 21% Two or more races 7% Asian 3%
- Hispanic origin (detail)
- Mexican 8% Puerto Rican 1% Dominican 1%
- Common ancestry
- Slovak 1% Serbian 1% Romanian 1%
- Foreign-born
- 19% · Canada, Vietnam
- Languages at home
- 73% English-only · Spanish 19% French/Haitian/Cajun 2% Other Asian/Pacific 2%
Political lean MEDSL · Cabarrus
- 2024 margin
- Lean R (+7.7) · D 45.5% · R 53.2% · Other 1.3%
- 2008→2024 swing
- +10.7pp toward D · 2008: -18.4pp · 2024: -7.7pp
- All cycles
- 2024: R+7.7 2020: R+9.4 2016: R+20.0 2012: R+20.2 2008: R+18.4
Not yet ingested
- Civics
- —
Market trends
- HPI YoY
- ▼ -201.15%
- Current HPI
- 286.5413
- Rent YoY
- ▲ 1.76%
- Metro
- Charlotte-Concord-Gastonia, NC-SC
- State GDP YoY
- ▲ 3.28%
- F500 in state
- 26
Industry mix (Fortune 500 HQ in NC)
| Industry | F500 HQs | Revenue |
|---|---|---|
| Financial Services | 2 | $213B |
|
||
| Retail | 2 | $95B |
|
||
| Industrial Conglomerate | 1 | $38B |
|
||
| Metals / Steel | 1 | $35B |
|
||
| Utilities | 1 | $30B |
|
||
| Industrial Machinery | 1 | $19B |
|
||
Price history
+450.0% since first listed2 events — show timeline
- 2026-06-01 Listed $220,000 CANOPYMLS as Distributed by MLS Grid
- 1986-08-01 Sold (Public Records) $40,000 Public Records
Property tax history
+7.6%/yrLatest (2025): $2,093 · +100.0% YoY. Source: county tax records.
Cash-flow waterfall
monthlySold comps — $/sqft
last 12 mo · ≤1 miLoading sold comps…