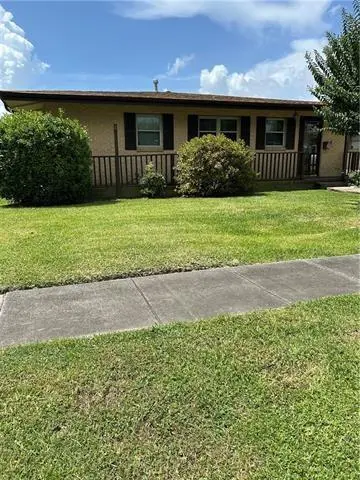
705 Gerry Dr · Kenner, LA
Flood risk 8/10 · Major
- FEMA flood zone
- X
- Chance of flooding over 30 yrs
- 0.6%
- Est. flood insurance / yr
- $507 – $1,088
Fire risk 2/10 · Minimal
- Est. fire insurance / yr
- $1,269 – $2,357
Heat risk 10/10 · Severe
- Hot days now (above 108°F)
- 7 days/yr
- Hot days in 30 yrs
- 21 days/yr
Wind risk 10/10 · Severe
- Chance of severe wind over 30 yrs
- 99.0%
Air-quality risk 3/10 · Minor
- Unhealthy air days now
- 2 days/yr
- Unhealthy air days in 30 yrs
- 3 days/yr
Risk factors via First Street. Map © Google.
Why this score? — see what drove the D grade
The composite is a weighted blend of 9 inputs, each scored 0–100. Each bar is that input's sub-score; the figure is the points it added to the 100-point composite (weight × sub-score).
- Cash flow +15.8/30.0
- ARV discount +8.7/15.0
- DSCR +4.9/10.0
- Livability +3.9/5.0
- 1% rule +3.1/10.0
- Rent growth +2.5/5.0
- Schools +2.5/10.0
- Condition / age +2.5/5.0
- Appreciation +0.0/10.0
$189,900
🖨 Deal sheet (PDF) 📄 Offer letter ✓ Due diligence
Listing remarks MLS
Very nice home with lots of space for entertaining. Formal dining room can easily be converted back to 3ed bedroom. Lots of storage space. Fenced yard, quiet neighborhood. Roof and h/w heater 2yrs old. Oversized garage with workshop area and loft storage.
Key facts
- Fenced yard
- Workshop area
- Quiet neighborhood
Tags
Neighborhood map
What this means for you Summary
Snapshot
- This is a 2-bed/2.0-bath single-family listed at $190k.
Deal economics
- At list price, monthly cash flow is $20 ($234/yr) — positive.
- The deal already cash-flows at list — no discount required.
- To meet the 1% rule (rent ≥ 1% of price), the offer needs to be $154k (18.8% below list).
- Recommended offer: $154k (18.8% below list) — sets the bar for 1% rule.
- Cap rate 6.8% vs local median 5.3% in Kenner — meaningfully above typical; check what's discounted (condition, days-on-market, listing class) to confirm the premium yield is real.
Location & tenants
- Location reads 78/100 on livability (#6 in LA, #2,414 nationally) — a middle-class / working-renter tenant base. Strengths: cost of living A+, housing A+, health & safety A+; Watch: amenities C-, employment C-, crime D.
- Jefferson Parish (suburban): math 24% / reading 34% proficiency, ranked #44 of 98 in LA (top 45%) — low school quality limits family demand, transient renter base, plan for 1-2y turnover; 70% free/reduced lunch — lower-income household profile, screen leases tightly.
- Zoned schools: Airline Park Academy For Advanced Studies (math 92% / reading 92%, grade A+, #3 of 646 statewide, top 0%, 418 students, 16% FRL); Tom Benson School (math 11% / reading 14%, grade F, #546 of 646 statewide, top 85%, 753 students, 60% FRL); Bonnabel Magnet Academy High School (math 12% / reading 21%, grade F, #214 of 265 statewide, top 81%, 1,478 students, 52% FRL) — zoned schools average 43% FRL vs 70% district-wide (28 pts lower); this property's tenant base skews higher-income than the district average.
- Market conditions: 91 active listings in the ZIP; 40 comparable units currently listed for rent nearby; rentals lingering (median 46d on market — plan ~5-8 weeks vacancy on turnover, expect pricing pressure); 52% of comp listings sitting > 30 days — soft ceiling on asking rent; 518 units permitted in Jefferson Parish in 2024 (43 in 5+ unit buildings).
- This rent runs 36% of the median local income ($51k/yr) — at the standard rent-burdened threshold; future hikes will face affordability resistance.
Forward outlook
- Local home prices are declining (-3.0%/yr); year-one equity from $1k of loan paydown is wiped out by about $6k of value loss. Plan a longer hold.
Negotiation context
- It's been on market 163 days — a 12% lower offer ($167k) is reasonable based on typical stale-listing flexibility.
- 3 sale attempts with the ask held roughly flat each time — persistent listings suggest the price (not the market) is what's stuck; bring a comps-based counter.
Risks & watch-outs
- Watch-outs: flood insurance adds $66/mo; built in 1958 — expect roof / HVAC / electrical / plumbing capex.
- Climate carrying-cost: severe flood risk; severe wind risk, 99% chance of damaging wind over 30y; extreme-heat days projected 7→21/yr by 2055 (HVAC capex compounding) — expect insurance premiums to compound above CPI over the hold.
Questions for the listing agent
- It's been on market 163 days. Have you received any prior offers? Is the seller open to a 19% concession, seller financing, or rate buy-down credit?
- Built in 1958 — when were the roof, HVAC, electrical panel, plumbing, and water heater last replaced?
- What's the actual annual flood-insurance premium (NFIP or private), and is the property in a SFHA with mandatory coverage?
- Why hasn't it sold? Are there any deal-killer items the seller is aware of (foundation, flood, title, zoning, code violations)?
- Is there a deadline driving the sale (1031 exchange, divorce, estate, relocation)? That informs how much negotiation room exists.
- Crime grade is D in this area — have there been break-ins, vandalism, or insurance claims at this property in the last 3 years? What carrier currently insures it and at what premium?
- The area grade is low — what's the realistic commute time and amenity access for the typical tenant pool here? Any planned neighborhood developments (good or bad) we should know about?
- What's the average days-on-market for RENTAL listings here right now (not sales)? A rising rental-DOM trend means longer vacancies and softer asking-rent achievability than the comps imply.
- What's the recent tenant-quality profile in this submarket — average credit score on applications, eviction rate, late-payment / NSF rate, and stable-employment percentage? A property-management company in the area should have these aggregated.
- How much new for-sale + rental construction is in the pipeline within 1–3 miles? Heavy new supply typically softens prices + rents 12–24 months out; constrained supply supports both.
Investment metrics
- 1% rule
- 0.81% ✗
- Cap rate
- 6.84%
- Cash-on-cash
- 1.94%
- DSCR
- 1.09
- GRM
- 10.3
CMA / ARV
- ARV (median comp)
- $195,146
- List price
- $189,900
- Delta
- -2.69%
- Verdict
- FAIR
- Comps
- 20 within 1.0 mi
Show comp detail 12 sales within ~0.75 mi
| Address | Dist | Beds/Ba | Sqft | Sold | Price | $/sf | Match |
|---|---|---|---|---|---|---|---|
| 709 29th St | 0.05mi | 3/2.0 (+1) | 1,350 (-2%) | 10mo | $190,000 | $141 | 81 |
| 822 Veterans Blvd | 0.20mi | 3/1.5 (+1) | 1,275 (-7%) | 2mo | $125,000 | $98 | 70 |
| 3244 Continental Dr | 0.51mi | 3/2.0 (+1) | 1,472 (+7%) | 1mo | $214,000 | $145 | 59 |
| 3287 Chateau Blvd | 0.67mi | 3/2.0 (+1) | 1,434 (+4%) | 3mo | $269,900 | $188 | 54 |
| 3141 Ohio St | 0.70mi | 3/2.0 (+1) | 1,450 (+5%) | 2mo | $182,000 | $126 | 52 |
| 812 Dolphin Ct | 0.69mi | 3/2.0 (+1) | 1,325 (-4%) | 10mo | $275,000 | $208 | 48 |
| 828 Libra Ln | 0.65mi | 3/2.0 (+1) | 1,450 (+5%) | 10mo | $250,000 | $172 | 47 |
| 3283 Chateau Blvd | 0.65mi | 3/2.0 (+1) | 1,461 (+6%) | 10mo | $259,000 | $177 | 46 |
| 3293 Chateau Blvd | 0.70mi | 3/2.0 (+1) | 1,300 (-6%) | 12mo | $220,000 | $169 | 43 |
| 933 Ronson Dr | 0.54mi | 3/2.0 (+1) | 1,200 (-13%) | 8mo | $223,000 | $186 | 42 |
| 937 Ronson Ave | 0.54mi | 3/2.0 (+1) | 1,568 (+14%) | 6mo | $172,000 | $110 | 41 |
| 149 Baylor Pl | 0.72mi | 3/2.0 (+1) | 1,220 (-11%) | 8mo | $154,325 | $126 | 36 |
Match score weights: distance 35% · size 25% · config 20% · recency 20%. Top-matched comps best support the ARV.
Projected returns pro-forma
-3.0% appreciation · 3.0% rent growth · sell at horizon
- IRR
- -15.6%
- Equity multiple
- 0.44×
- Total profit
- $-29,575
- Equity at exit
- $28,315
- IRR
- -7.2%
- Equity multiple
- 0.54×
- Total profit
- $-24,340
- Equity at exit
- $16,419
Cash invested: $53,172 (down + closing). Projections, not guarantees.
Landlord ↔ Tenant lean methodology
- Overall (STATE)
- 90 Strongly Landlord-Friendly
- State Louisiana
- 90 Strongly Landlord-Friendly · R+12
- County
- — inherits STATE
- City
- — inherits STATE
ZIP-level market 70062
- Active inventory
- 91
- Price-to-rent
- 10.3×
Monthly cashflow live
- Estimated rent
- $1,542 high interval (Pro) →
- Mortgage (P&I)
- −$996
- Tax from tax record
- −$58 /mo · $691/yr
- Insurance
- −$79
- Flood insurance flood zone
- −$66 /mo · $798/yr
- HOA
- −$0
- Vacancy / Maint / Mgmt
- −$324
- Net cashflow
- $20
Break-even live
Sensitivity live
| Price | -10% $127 | -5% $73 | +0% $20 | +5% $-34 | +10% $-88 |
|---|---|---|---|---|---|
| Rent | -10% $-102 | -5% $-41 | +0% $20 | +5% $80 | +10% $141 |
| Rate | -1.0pp $115 | -0.5pp $68 | base $20 | +0.5pp $-30 | +1.0pp $-80 |
UW: 25.0% down · 7.5% · 30yr · 1.5% tax · 5.0% vac · 8.0% maint · 8.0% mgmt
Financing live
Cash to close
- Down payment
- $47,475
- Closing costs
- $5,697
- Reserves months
- —
- Total cash needed
- —
Loan-product check · same deal, 3 products live
Conventional
25% down · 7.5% · 30yr
- Down + closing
- —
- Monthly P&I
- —
- Monthly cashflow
- —
- DSCR
- —
- Eligible?
- —
Personal DTI + credit; lowest rate.
DSCR
20% down · 8.5% · 30yr
- Down + closing
- —
- Monthly P&I
- —
- Monthly cashflow
- —
- DSCR
- —
- Eligible?
- —
No personal income docs; deal must DSCR.
Hard money
10% down · 12.0% · 12mo
- Down + closing
- —
- Monthly P&I
- —
- Monthly cashflow
- —
- DSCR
- —
- Eligible?
- —
Short-term bridge; refi at stabilization.
Rent comps 40 comps
| Address | Beds | Baths | Sqft | Rent | $/sqft | DOM | Units | Dist |
|---|---|---|---|---|---|---|---|---|
| 2752 Jasper St Unit A Kenner, LA | 3.0 | 1.5 | 1400 | $1,450 | $1.04 | 45d | 1 | 0.10mi |
| 2755 Huntsville St Apt C Kenner, LA | 3.0 | 2.0 | 1216 | $1,575 | $1.30 | 6d | 1 | 0.11mi |
| 2755 Huntsville St Unit B Kenner, LA | 3.0 | 1.5 | 1500 | $1,650 | $1.10 | 45d | 1 | 0.11mi |
| 2759 Albany St Unit B Kenner, LA | 3.0 | 2.0 | 1250 | $1,500 | $1.20 | 45d | 1 | 0.20mi |
| 2755 Albany St Unit D Kenner, LA | 3.0 | 2.0 | 1250 | $1,500 | $1.20 | 45d | 1 | 0.20mi |
| 2625 Panama St Kenner, LA | 2.0 | 1.0 | 930 | $1,300 | $1.40 | 4d | 1 | 0.30mi |
| 2617 Phoenix St Kenner, LA | 3.0 | 2.0 | 1350 | $1,800 | $1.33 | 45d | 1 | 0.33mi |
| 511 27th St Kenner, LA | 3.0 | 2.0 | 1200 | $1,575 | $1.31 | 6d | 1 | 0.34mi |
| 2603 Panama St Kenner, LA | 3.0 | 1.5 | 1400 | $1,400 | $1.00 | 25d | 1 | 0.34mi |
| 3120 Phoenix St Unit D Kenner, LA | 2.0 | 1.5 | 1075 | $1,100 | $1.02 | 45d | 1 | 0.35mi |
| 2609 Dawson Ave Kenner, LA | 3.0 | 2.0 | 1300 | $1,600 | $1.23 | 45d | 1 | 0.41mi |
| 2710 Helena St Kenner, LA | 3.0 | 1.5 | 1400 | $1,200 | $0.86 | 16d | 1 | 0.42mi |
| 2700 Helena St Kenner, LA | 3.0 | 1.5 | 1355 | $1,700 | $1.25 | 45d | 1 | 0.42mi |
| 2723 Tifton Ave Kenner, LA | 3.0 | 2.0 | 1200 | $1,800 | $1.50 | 25d | 1 | 0.43mi |
| 2611 Augusta St Kenner, LA | 3.0 | 2.0 | 1300 | $1,900 | $1.46 | 45d | 1 | 0.44mi |
| 2726 Greenwood St Kenner, LA | 2.0 | 1.5 | 980 | $1,200 | $1.22 | 45d | 1 | 0.46mi |
| 2714 Tifton St Kenner, LA | 3.0 | 2.0 | 1275 | $1,800 | $1.41 | 45d | 1 | 0.46mi |
| 2804 Salem St Kenner, LA | 2.0 | 2.0 | 1450 | $1,400 | $0.97 | 45d | 1 | 0.53mi |
| 3127 Marietta St Kenner, LA | 3.0 | 1.0 | 1600 | $1,600 | $1.00 | 45d | 1 | 0.55mi |
| 2838 Kingston St Unit A Kenner, LA | 3.0 | 1.5 | 1500 | $1,600 | $1.07 | 6d | 1 | 0.59mi |
| 300 Clemson Dr Kenner, LA | 2.0 | 1.5 | 1025 | $1,500 | $1.46 | 16d | 1 | 0.60mi |
| 309 Emerson Dr Unit C Kenner, LA | 3.0 | 1.0 | 900 | $1,200 | $1.33 | 6d | 1 | 0.62mi |
| 2800 Richland St Unit B Kenner, LA | 2.0 | 2.5 | 1000 | $1,600 | $1.60 | 23d | 1 | 0.64mi |
| 135 27th St Kenner, LA | 3.0 | 2.0 | 1205 | $1,200 | $1.00 | 6d | 1 | 0.67mi |
| 2604 Richland St Unit 1 Kenner, LA | 3.0 | 2.0 | 1442 | $1,500 | $1.04 | 6d | 1 | 0.70mi |
| 2611 Richland St Kenner, LA | 3.0 | 2.5 | 1443 | $2,200 | $1.52 | 3d | 1 | 0.72mi |
| 3318 Cannes Pl Kenner, LA | 3.0 | 2.0 | 1700 | $2,100 | $1.24 | 45d | 1 | 0.78mi |
| 129 Auburn Pl Kenner, LA | 3.0 | 2.0 | 1200 | $1,800 | $1.50 | 3d | 1 | 0.79mi |
| 1516 Mayfield St Kenner, LA | 3.0 | 2.0 | 1407 | $1,900 | $1.35 | 45d | 1 | 0.81mi |
| 1516 Mayfield St Kenner, LA | 3.0 | 2.0 | 1407 | $1,900 | $1.35 | 46d | 1 | 0.81mi |
| 215 Avant Garde Cir Kenner, LA | 2.0 | 2.0 | 1200 | $1,500 | $1.25 | 4d | 1 | 1.00mi |
| 187 Avant Garde Cir #187 Kenner, LA | 2.0 | 1.5 | 1050 | $1,500 | $1.43 | 16d | 1 | 1.00mi |
| 1201 W Esplanade Ave Kenner, LA | 1.0–2.0 | 1.0–2.0 | 746 | $1,110 | $1.49 | 45d | 1 | 1.02mi |
| 2127 Connecticut Ave Unit A Kenner, LA | 3.0 | 2.0 | 1310 | $2,000 | $1.53 | 45d | 1 | 1.23mi |
| 1400 W Esplanade Ave Kenner, LA | 2.0 | 1.0–2.5 | 801 | $1,370 | $1.71 | 45d | 1 | 1.24mi |
| 1500 W Esplanade Ave Unit 29D Kenner, LA | 3.0 | 2.0 | 1725 | $1,900 | $1.10 | 3d | 1 | 1.25mi |
| 1500 W Esplanade Ave Kenner, LA | 3.0 | 2.0 | 1725 | $1,750 | $1.01 | 4d | 2 | 1.25mi |
| 1500 W Esplanade Ave Kenner, LA | 2.0–3.0 | 2.0 | 1587 | $1,700 | $1.07 | 45d | 1 | 1.25mi |
| 3304 Delaware Ave Unit B Kenner, LA | 2.0 | 1.5 | 1100 | $1,295 | $1.18 | 6d | 1 | 1.29mi |
| 3308 Delaware Ave Unit C Kenner, LA | 2.0 | 1.5 | 1125 | $1,400 | $1.24 | 45d | 1 | 1.29mi |
Listing history 22 events
-
2026-06-21days on market $189,900 Active 163 DOM
-
2026-06-18days on market $189,900 Active 160 DOM
-
2026-06-17days on market $189,900 Active 159 DOM
-
2026-06-16days on market $189,900 Active 158 DOM
-
2026-06-15days on market $189,900 Active 157 DOM
-
2026-06-13days on market $189,900 Active 155 DOM
-
2026-06-10days on market $189,900 Active 152 DOM
-
2026-06-09days on market $189,900 Active 151 DOM
-
2026-06-08days on market $189,900 Active 150 DOM
-
2026-06-07days on market $189,900 Active 149 DOM
-
2026-06-03days on market $189,900 Active 145 DOM
-
2026-06-02days on market $189,900 Active 144 DOM
-
2026-06-01days on market $189,900 Active 143 DOM
-
2026-05-31days on market $189,900 Active 142 DOM
-
2026-01-09$189,900 Active 255-char remark
Show marketing remark (255 chars)
Very nice home with lots of space for entertaining. Formal dining room can easily be converted back to 3ed bedroom. Lots of storage space. Fenced yard, quiet neighborhood. Roof and h/w heater 2yrs old. Oversized garage with workshop area and loft storage.
-
2025-10-14price $198,000
-
2025-10-14price $198,000
-
2025-08-21price $208,000
-
2025-08-21price $208,000
-
2025-07-06$225,000 Active
-
2004-04-01soldstatus
ⓘ Source: listings_history table (triggers on properties + properties_extension) + one-shot
backfill from property_details.listing_events for pre-trigger history.
Tax reassessment forecast LA · Resets to sale price
- Current annual tax
- $691 · $58/mo
- Projected year-2 tax
- $1,044 · $87/mo
- Expected delta
- +$354/yr (+$29/mo · 51.2%)
ⓘ Screening estimate from a state-policy table — verify with the county assessor before closing.
Climate risk First Street
- Flood 8/10 Severe FEMA zone X · 60% chance over 30 yrs
- Wildfire 2/10 Low
- Heat 10/10 Extreme 7 d/yr ≥108°F today · 21 d/yr by 30 yrs out
- Wind 10/10 Extreme 99% chance of damaging wind over 30 yrs
- Air quality 3/10 Moderate 2 unhealthy d/yr today · 3 by 30 yrs out
Nearby sold comps map
Loading sold comps map…
Walkable amenities ~0.75 mi
Loading nearby amenities…
Taxation est. · year 1
- Rental income
- $18,509
- − Mortgage interest
- −$10,637
- − Property taxes
- −$691
- − Insurance
- −$1,747
- − Repairs & maintenance
- −$1,481
- − Management
- −$1,481
- − Depreciation
- −$5,524
- Taxable loss
- −$3,052
- Est. tax savings @ 24.0%
- +$732
- After-tax cash flow
- $967/yr
For passive investors: Depreciation is non-cash, so a rental often shows a tax loss while cash-flowing — sheltering income. Rental losses are passive: they offset passive income freely, and up to $25,000/yr can offset ordinary (W-2) income if you actively participate and your MAGI is under $100k (phasing out to $0 by $150k); unused losses carry forward. On sale, claimed depreciation is recaptured at up to 25%, and gains may owe capital-gains tax (a 1031 exchange can defer both). Figures are a year-1 estimate at your 24.0% rate — not tax advice; consult a CPA.
Schools (NCES district)
- District
- Jefferson Parish
- NCES district ID
- 2200840
- Math proficiency
- 24% ▼ -36.00%
- Reading proficiency
- 34% ▼ -30.00%
- Median HH income
- $48,421
- Composite
- 25.19/100
- National rank
- #7511
- State rank
- #44 of 98 in LA
Livability — Kenner
- Score
- 78/100
- State rank
- #6
- US rank
- #2414
Category grades
Schools grade is shown separately in the Schools card above.
Census & demographics
- Census place
- Kenner, LA
- County
- Jefferson Parish · 426,999 people
- City population
- 66,707
- Metro
- New Orleans-Metairie, LA
- Population (ZIP)
- 17,771
- Household income
- $51,477
- Rent vs Own
- Severe rent burden
- 1082.0
Population outlook (Jefferson County) Hauer SSP2
- Today (2025)
- 451,696 people
- By 2030
- 455,451 · +0.8%
- By 2040
- 458,308 · +1.5%
- By 2050
- 461,031 · +2.1%
- By 2075
- 476,351 · +5.5%
- By 2100
- 499,377 · +10.6%
Race, ethnicity, and origin ACS 2023
- Neighborhood character
- Highly diverse neighborhood (Simpson 0.70)
- Race & ethnicity
- Hispanic / Latino 37% Black 29% White 27% Two or more races 17% Asian 2% Native American 1%
- Hispanic origin (detail)
- Mexican 6% Cuban 2% Dominican 2%
- Common ancestry
- Lithuanian 5%
- Foreign-born
- 22% · Canada
- Languages at home
- 66% English-only · Spanish 32% Other Indo-European 2%
Political lean MEDSL · Jefferson
- 2024 margin
- R (+12.9) · D 42.5% · R 55.5% · Other 2.1%
- 2008→2024 swing
- +13.6pp toward D · 2008: -26.6pp · 2024: -12.9pp
- All cycles
- 2024: R+12.9 2020: R+11.1 2016: R+14.8 2012: R+18.4 2008: R+26.6
Not yet ingested
- Civics
- —
Market trends
- HPI YoY
- ▼ -108.55%
- Current HPI
- 105.3411
- Rent YoY
- —
- Metro
- New Orleans-Metairie, LA
- State GDP YoY
- ▲ 3.29%
- F500 in state
- 10
Industry mix (Fortune 500 HQ in LA)
| Industry | F500 HQs | Revenue |
|---|---|---|
| Telecommunications | 2 | $23B |
|
||
| Utilities | 1 | $12B |
|
||
| Wholesale / Distribution | 1 | $5B |
|
||
| Advertising | 1 | $2B |
|
||
Price history
-15.6% since first listed8 events — show timeline
- 2026-01-09 Listed $189,900 GSREIN
- 2026-01-09 Listed $189,900 AcadianaMLS
- 2025-10-14 Price Changed $198,000 AcadianaMLS
- 2025-10-14 Price Changed $198,000 GSREIN
- 2025-08-21 Price Changed $208,000 AcadianaMLS
- 2025-08-21 Price Changed $208,000 GSREIN
- 2025-07-06 Listed $225,000 AcadianaMLS
- 2004-04-01 Sold (Public Records) — Public Records
Property tax history
+3.9%/yrLatest (2025): $691 · -0.4% YoY. Source: county tax records.
Cash-flow waterfall
monthlySold comps — $/sqft
last 12 mo · ≤1 miLoading sold comps…