 🏗️ New Construction
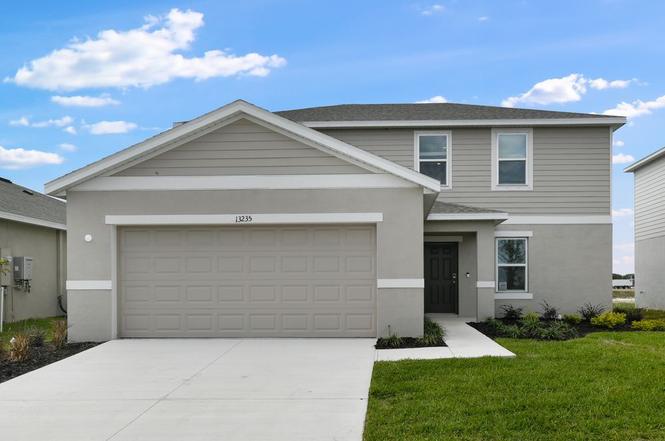
Redbud Plan · Ruskin, FL
Flood risk 1/10 · Minimal
- FEMA flood zone
- X (unshaded)
- Chance of flooding over 30 yrs
- 0.0%
- Est. flood insurance / yr
- $507 – $1,088
Fire risk 5/10 · Moderate
- Est. fire insurance / yr
- $947 – $1,759
Heat risk 10/10 · Severe
- Hot days now (above 108°F)
- 7 days/yr
- Hot days in 30 yrs
- 30 days/yr
Wind risk 10/10 · Severe
- Chance of severe wind over 30 yrs
- 99.0%
Air-quality risk 3/10 · Minor
- Unhealthy air days now
- 3 days/yr
- Unhealthy air days in 30 yrs
- 3 days/yr
Risk factors via First Street. Map © Google.
Why this score? — see what drove the F grade
The composite is a weighted blend of 9 inputs, each scored 0–100. Each bar is that input's sub-score; the figure is the points it added to the 100-point composite (weight × sub-score).
- ARV discount +7.5/15.0
- Cash flow +5.3/30.0
- Schools +4.4/10.0
- Livability +3.6/5.0
- Condition / age +2.5/5.0
- Rent growth +2.3/5.0
- 1% rule +1.0/10.0
- DSCR +0.0/10.0
- Appreciation +0.0/10.0
$359,999
🖨 Deal sheet (PDF) 📄 Offer letter ✓ Due diligence
Listing remarks
The Redbud is a spacious four-bedroom plan that offers plenty of room for expansion. An additional bedroom can be added to each level of the home, including a junior suite on the top floor with ensuite bath. An extensive living area comprises most of the ground floor of the home, with the kitchen on one end and the gathering room on the other. A casual dining room connects the two spaces and leads outside to the patio via sliding glass doors. An oversized walk-in pantry is conveniently located next to the owner's entrance for easy unloading and a powder room and coat closet is found adjacent to the foyer. Upstairs, a deluxe primary retreat includes a well-equipped bath and large walk-in clo
Key facts
- Casual dining room
- Sliding glass doors
- Ensuite bath
Tags
Property features AI
Finance
- Other: Active listing priced at $359,999; Address: 13610 Cornerstone Way, Parrish, FL 34219
Exterior
- Parking: 2-car garage (2 total parking spaces)
- Home design: Single-family plan named Redbud; New construction (Plan)
Interior
- Bedrooms: 4 bedrooms
- Bathrooms: 2 full bathrooms and 1 half bathroom
- Interior features: Open living area totaling 2,143 square feet
Neighborhood map
What this means for you Summary
Snapshot
- This is a 4-bed/2.5-bath single-family listed at $360k.
Deal economics
- At list price, monthly cash flow is $-1k ($-13k/yr) — negative.
- To cash-flow at today's rent, offer at most $346k (3.8% below list).
- To meet the 1% rule (rent ≥ 1% of price), the offer needs to be $303k (15.8% below list).
- Recommended offer: $303k (15.8% below list) — sets the bar for 1% rule.
- Cap rate 3.6% vs local median 4.7% in Ruskin — below-typical yield; the buyer is paying a premium for something (appreciation thesis, condition, location) that the cap rate doesn't capture.
Location & tenants
- Location reads 71/100 on livability (#392 in FL) — a middle-class / working-renter tenant base. Strengths: cost of living A+, housing A+, commute B+; Watch: amenities F, health & safety F.
- Manatee (suburban): math 54% / reading 50% proficiency, ranked #26 of 73 in FL (top 36%) — acceptable for families but not a draw, mixed tenant base, ~2y average lease.
- Zoned schools: Virgil Mills Elementary School (math 69% / reading 65%, grade B+, #450 of 2,144 statewide, top 22%, 818 students, 43% FRL); Buffalo Creek Middle School (math 59% / reading 51%, grade B-, #180 of 571 statewide, top 32%, 1,127 students, 44% FRL); Palmetto High School (math 22% / reading 36%, grade F, #456 of 667 statewide, top 68%, 2,100 students, 61% FRL) — zoned schools at 50% FRL track the district average.
- Market conditions: Rents soft (-0.9%/yr); 2194 active listings in the ZIP; 3 comparable units currently listed for rent nearby; rentals leasing fast (median 5d on market — plan ~1-2 weeks tenant-placement turnaround); high-income renter base; 7,472 units permitted in Manatee County in 2024 (1,782 in 5+ unit buildings).
- This rent runs 32% of the median local income ($114k/yr) — at the standard rent-burdened threshold; future hikes will face affordability resistance.
Forward outlook
- Local home prices are declining (-3.0%/yr); year-one equity from $4k of loan paydown is wiped out by about $15k of value loss. Plan a longer hold.
- Manatee County population projected at +43% by 2050 — long-run rental-demand tailwind backs the buy-and-hold thesis.
Negotiation context
- It's been on market 302 days — a 12% lower offer ($317k) is reasonable based on typical stale-listing flexibility.
Risks & watch-outs
- Climate carrying-cost: severe wind risk, 99% chance of damaging wind over 30y; moderate wildfire risk; extreme-heat days projected 7→30/yr by 2055 (HVAC capex compounding) — expect insurance premiums to compound above CPI over the hold.
Questions for the listing agent
- What do current leases actually rent for vs. the listed asking? Can we see a recent rent roll and the last 12 months of T-12 income?
- It's been on market 302 days. Have you received any prior offers? Is the seller open to a 16% concession, seller financing, or rate buy-down credit?
- Why hasn't it sold? Are there any deal-killer items the seller is aware of (foundation, flood, title, zoning, code violations)?
- Is there a deadline driving the sale (1031 exchange, divorce, estate, relocation)? That informs how much negotiation room exists.
- Schools are F-rated, which usually means shorter tenancies and higher turnover. Who's the typical renter profile here, and what's been the actual vacancy rate?
- The area grade is low — what's the realistic commute time and amenity access for the typical tenant pool here? Any planned neighborhood developments (good or bad) we should know about?
- This sits on a lake — are riparian / water-frontage rights deeded with the parcel? Any dock permits, shoreline easements, or HOA water-use restrictions?
- What's the documented flood / surge / shoreline-erosion history here (FEMA AND non-FEMA — e.g., storm surge, creek backup, septic-field saturation)?
- Any water-quality or seasonal algae-bloom issues that affect tenant satisfaction or short-term-rental demand?
- What's the average days-on-market for RENTAL listings here right now (not sales)? A rising rental-DOM trend means longer vacancies and softer asking-rent achievability than the comps imply.
- What's the recent tenant-quality profile in this submarket — average credit score on applications, eviction rate, late-payment / NSF rate, and stable-employment percentage? A property-management company in the area should have these aggregated.
- How much new for-sale + rental construction is in the pipeline within 1–3 miles? Heavy new supply typically softens prices + rents 12–24 months out; constrained supply supports both.
Investment metrics
- 1% rule
- 0.60% ✗
- Cap rate
- 3.64%
- Cash-on-cash
- -9.46%
- DSCR
- 0.58
- GRM
- 14.0
CMA / ARV
- ARV (on-the-fly)
- $509,177
- Comps found
- 12
Show comp detail 12 sales within ~0.75 mi
| Address | Dist | Beds/Ba | Sqft | Sold | Price | $/sf | Match |
|---|---|---|---|---|---|---|---|
| 13239 Commons Ave | 0.11mi | 5/3.0 (+1) | 2,287 (+7%) | 1mo | $385,999 | $169 | 76 |
| 13215 Commons Ave | 0.09mi | 5/3.0 (+1) | 2,287 (+7%) | 4mo | $379,999 | $166 | 74 |
| 13815 Sawmill St | 0.13mi | 4/2.0 | 1,848 (-14%) | 1mo | $319,704 | $173 | 68 |
| 13508 Cornerstone Way | 0.05mi | 4/2.0 | 1,853 (-14%) | 6mo | $365,999 | $198 | 68 |
| 13219 Commons Ave | 0.09mi | 4/2.0 | 1,848 (-14%) | 6mo | $341,619 | $185 | 66 |
| 14270 Sawmill St | 0.41mi | 3/2.0 (-1) | 2,055 (-4%) | 6mo | $454,999 | $221 | 62 |
| 13210 Rowhouse Ct | 0.30mi | 3/2.0 (-1) | 2,400 (+12%) | 2mo | $587,079 | $245 | 57 |
| 13065 Empress Jewel Trl | 0.39mi | 4/2.5 | 1,870 (-13%) | 7mo | $329,400 | $176 | 55 |
| 13608 Sunset Sapphire Ct | 0.51mi | 4/2.0 | 1,935 (-10%) | 9mo | $325,000 | $168 | 51 |
| 13127 Empress Jewel Trl | 0.43mi | 4/2.5 | 1,870 (-13%) | 10mo | $337,100 | $180 | 50 |
| 13130 Empress Jewel Trl | 0.40mi | 5/2.5 (+1) | 2,389 (+12%) | 10mo | $373,700 | $156 | 49 |
| 13209 Sunset Sapphire Cir | 0.53mi | 5/2.5 (+1) | 2,389 (+12%) | 4mo | $346,000 | $145 | 48 |
Match score weights: distance 35% · size 25% · config 20% · recency 20%. Top-matched comps best support the ARV.
Projected returns pro-forma
-3.0% appreciation · 0.0% rent growth · sell at horizon
- IRR
- -36.5%
- Equity multiple
- -0.14×
- Total profit
- $-162,957
- Equity at exit
- $75,920
- IRR
- -74.1%
- Equity multiple
- -0.88×
- Total profit
- $-268,252
- Equity at exit
- $44,024
Cash invested: $142,570 (down + closing). Projections, not guarantees.
Landlord ↔ Tenant lean methodology
- Overall (STATE)
- 87 Strongly Landlord-Friendly
- State Florida
- 87 Strongly Landlord-Friendly · R+3
- County
- — inherits STATE
- City
- — inherits STATE
ZIP-level market 34219
- Home prices YoY
- -23.7%
- Rents YoY
- -0.9%
- Active inventory
- 2194
- Price-to-rent
- 9.9×
Monthly cashflow live
- Estimated rent
- $3,031 medium interval (Pro) →
- Mortgage (P&I)
- −$2,670
- Tax est. 1.5%
- −$636 /mo · $7,638/yr
- Insurance
- −$212
- HOA
- −$0
- Vacancy / Maint / Mgmt
- −$636
- Net cashflow
- $-1,124
Break-even live
Sensitivity live
| Price | -10% $-772 | -5% $-948 | +0% $-1,124 | +5% $-1,300 | +10% $-1,476 |
|---|---|---|---|---|---|
| Rent | -10% $-1,364 | -5% $-1,244 | +0% $-1,124 | +5% $-1,005 | +10% $-885 |
| Rate | -1.0pp $-868 | -0.5pp $-995 | base $-1,124 | +0.5pp $-1,256 | +1.0pp $-1,391 |
UW: 25.0% down · 7.5% · 30yr · 1.5% tax · 5.0% vac · 8.0% maint · 8.0% mgmt
Financing live
Cash to close
- Down payment
- $127,294
- Closing costs
- $15,275
- Reserves months
- —
- Total cash needed
- —
Loan-product check · same deal, 3 products live
Conventional
25% down · 7.5% · 30yr
- Down + closing
- —
- Monthly P&I
- —
- Monthly cashflow
- —
- DSCR
- —
- Eligible?
- —
Personal DTI + credit; lowest rate.
DSCR
20% down · 8.5% · 30yr
- Down + closing
- —
- Monthly P&I
- —
- Monthly cashflow
- —
- DSCR
- —
- Eligible?
- —
No personal income docs; deal must DSCR.
Hard money
10% down · 12.0% · 12mo
- Down + closing
- —
- Monthly P&I
- —
- Monthly cashflow
- —
- DSCR
- —
- Eligible?
- —
Short-term bridge; refi at stabilization.
Rent comps 3 comps
| Address | Beds | Baths | Sqft | Rent | $/sqft | DOM | Units | Dist |
|---|---|---|---|---|---|---|---|---|
| 13420 Noble Garnet Ln Parrish, FL | 3.0 | 2.5 | 1767 | $2,250 | $1.27 | 4d | 1 | 0.29mi |
| 12805 Crystal Jade Way Parrish, FL | 4.0 | 2.5 | 2162 | $2,800 | $1.30 | 5d | 1 | 0.32mi |
| 12215 Radiant Gem Trl Parrish, FL | 4.0 | 2.5 | 2584 | $3,000 | $1.16 | 17d | 1 | 0.71mi |
Listing history 15 events
-
2026-06-22days on market $359,999 Active 302 DOM
-
2026-06-18days on market $359,999 Active 299 DOM
-
2026-06-17days on market $359,999 Active 298 DOM
-
2026-06-16days on market $359,999 Active 297 DOM
-
2026-06-15days on market $359,999 Active 296 DOM
-
2026-06-13days on market $359,999 Active 294 DOM
-
2026-06-13days on market $359,999 Active 293 DOM
-
2026-06-10days on market $359,999 Active 291 DOM
-
2026-06-09days on market $359,999 Active 290 DOM
-
2026-06-08days on market $359,999 Active 289 DOM
-
2026-06-08days on market $359,999 Active 288 DOM
-
2026-06-03days on market $359,999 Active 284 DOM
-
2026-06-02days on market $359,999 Active 283 DOM
-
2026-06-01days on market $359,999 Active 282 DOM
-
2026-05-31days on market $359,999 Active 281 DOM
ⓘ Source: listings_history table (triggers on properties + properties_extension) + one-shot
backfill from property_details.listing_events for pre-trigger history.
Climate risk First Street
- Flood 1/10 Low FEMA zone X (unshaded) · 0% chance over 30 yrs
- Wildfire 5/10 Major
- Heat 10/10 Extreme 7 d/yr ≥108°F today · 30 d/yr by 30 yrs out
- Wind 10/10 Extreme 99% chance of damaging wind over 30 yrs
- Air quality 3/10 Moderate 3 unhealthy d/yr today · 3 by 30 yrs out
Nearby sold comps map
Loading sold comps map…
Walkable amenities ~0.75 mi
Loading nearby amenities…
Taxation est. · year 1
- Rental income
- $36,371
- − Mortgage interest
- −$28,522
- − Property taxes
- −$7,638
- − Insurance
- −$2,546
- − Repairs & maintenance
- −$2,910
- − Management
- −$2,910
- − Depreciation
- −$14,812
- Taxable loss
- −$22,966
- Est. tax savings @ 24.0%
- +$5,512
- After-tax cash flow
- $-7,981/yr
For passive investors: Depreciation is non-cash, so a rental often shows a tax loss while cash-flowing — sheltering income. Rental losses are passive: they offset passive income freely, and up to $25,000/yr can offset ordinary (W-2) income if you actively participate and your MAGI is under $100k (phasing out to $0 by $150k); unused losses carry forward. On sale, claimed depreciation is recaptured at up to 25%, and gains may owe capital-gains tax (a 1031 exchange can defer both). Figures are a year-1 estimate at your 24.0% rate — not tax advice; consult a CPA.
Schools (NCES district)
- District
- Manatee
- NCES district ID
- 1201230
- Math proficiency
- 54% ▼ -6.00%
- Reading proficiency
- 50% ▼ -2.00%
- Median HH income
- $49,607
- Composite
- 44.43/100
- National rank
- #2806
- State rank
- #26 of 73 in FL
Livability — Ruskin
- Score
- 71/100
- State rank
- #392
- US rank
- #6879
Category grades
Schools grade is shown separately in the Schools card above.
Census & demographics
- County
- Manatee County · 416,364 people
- City population
- 33,319
- Metro
- North Port-Sarasota-Bradenton, FL
- Population (ZIP)
- 33,296
- Household income
- $113,773
- Rent vs Own
- Severe rent burden
- 219.0
Population outlook (Manatee County) Hauer SSP2
- Today (2025)
- 447,342 people
- By 2030
- 488,911 · +9.3%
- By 2040
- 567,934 · +27.0%
- By 2050
- 637,995 · +42.6%
- By 2075
- 781,970 · +74.8%
- By 2100
- 848,272 · +89.6%
Race, ethnicity, and origin ACS 2023
- Neighborhood character
- Predominantly White (75%)
- Race & ethnicity
- White 75% Hispanic / Latino 11% Two or more races 8% Black 8% Asian 2%
- Hispanic origin (detail)
- Mexican 2% Puerto Rican 3%
- Common ancestry
- Romanian 4% Hispanic 2% Russian 2%
- Foreign-born
- 10% · Canada, Dominican Republic, Jamaica
- Languages at home
- 88% English-only · Spanish 7% French/Haitian/Cajun 2% Other Asian/Pacific 1%
Political lean MEDSL · Manatee
- 2024 margin
- Strong R (+23.5) · D 37.9% · R 61.4%
- 2008→2024 swing
- -16.5pp toward R · 2008: -7.0pp · 2024: -23.5pp
- All cycles
- 2024: R+23.5 2020: R+16.1 2016: R+17.1 2012: R+12.5 2008: R+7.0
Not yet ingested
- Civics
- —
Market trends
- HPI YoY
- ▼ -84.45%
- Current HPI
- 271.7131
- Rent YoY
- ▼ -0.95%
- Metro
- North Port-Sarasota-Bradenton, FL
- State GDP YoY
- ▲ 3.28%
- F500 in state
- 36
Industry mix (Fortune 500 HQ in FL)
| Industry | F500 HQs | Revenue |
|---|---|---|
| Industrial Technology | 2 | $29B |
|
||
| Insurance | 2 | $17B |
|
||
| Retail | 1 | $60B |
|
||
| Technology Distribution | 1 | $58B |
|
||
| Homebuilding | 1 | $35B |
|
||
| Technology Manufacturing | 1 | $35B |
|
||
Cash-flow waterfall
monthlySold comps — $/sqft
last 12 mo · ≤1 miLoading sold comps…