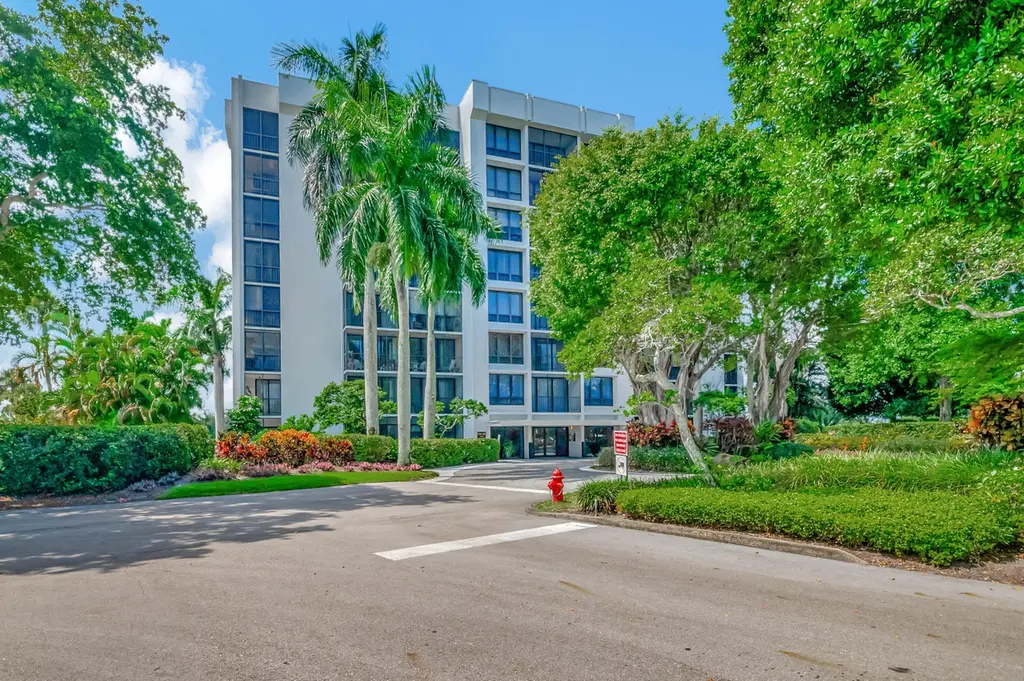
6805 Willow Wood Dr #5061 · Boca Raton, FL
Flood risk 1/10 · Minimal
- FEMA flood zone
- X (unshaded)
- Chance of flooding over 30 yrs
- 0.0%
- Est. flood insurance / yr
- $507 – $1,088
Fire risk 1/10 · Minimal
- Est. fire insurance / yr
- $947 – $1,759
Heat risk 9/10 · Severe
- Hot days now (above 107°F)
- 7 days/yr
- Hot days in 30 yrs
- 26 days/yr
Wind risk 10/10 · Severe
- Chance of severe wind over 30 yrs
- 99.0%
Air-quality risk 3/10 · Minor
- Unhealthy air days now
- 2 days/yr
- Unhealthy air days in 30 yrs
- 3 days/yr
Risk factors via First Street. Map © Google.
Why this score? — see what drove the D grade
The composite is a weighted blend of 9 inputs, each scored 0–100. Each bar is that input's sub-score; the figure is the points it added to the 100-point composite (weight × sub-score).
- Cash flow +11.4/30.0
- ARV discount +7.5/15.0
- 1% rule +6.7/10.0
- Schools +4.3/10.0
- Livability +3.9/5.0
- DSCR +3.3/10.0
- Rent growth +3.0/5.0
- Condition / age +2.5/5.0
- Appreciation +0.0/10.0
$349,000
🖨 Deal sheet (PDF) 📄 Offer letter ✓ Due diligence
Listing remarks
Imagine life inside the Nation's #1 Private Residential Country Club Lifestyle offering resort-style living. PLAY our 4 Golf courses, 27 Tennis courts and 14 Pickleball courts; SHOP our retail store, golf and tennis pro shops, DINE in our 10 dining venues. Spend the day RELAXING at our 5-star fitness center, pool, spa and salon. ENJOY endless activities in over 400,000 sq. ft. of exceptional amenities & stellar service. Mandatory Joining Fee: $150,000, BWMA Capital Contribution: $10,000, Annual Social Dues: $24,454. Club's Joining Fee & CC will be increasing by $75,000 on October 1st. Act now to beat the increase!
Key facts
- $1,178 HOA
- Parking
- Community pool
Neighborhood map
What this means for you Summary
Snapshot
- This is a 2-bed/2.0-bath condo listed at $349k.
Deal economics
- At list price, monthly cash flow is $-121 ($-1k/yr) — negative.
- To cash-flow at today's rent, offer at most $328k (6.1% below list).
- Meets the 1% rule at list price ($4k rent vs $349k).
- Recommended offer: $328k (6.1% below list) — sets the bar for cash-flow.
- Cap rate 5.9% vs local median 2.7% in Boca Raton — top-decile yield for the area; either an underpriced asset or a hidden risk that comps aren't pricing in. Stress-test before assuming the spread holds.
Location & tenants
- Location reads 77/100 on livability (#192 in FL, #3,070 nationally) — a middle-class / working-renter tenant base. Strengths: employment A+, health & safety A+, crime B+; Watch: amenities D, cost of living F.
- Palm Beach (suburban): math 46% / reading 53% proficiency, ranked #34 of 73 in FL (top 47%) — families likely to look elsewhere, expect single-tenant / working-renter base with shorter leases.
- Zoned schools: Whispering Pines Elementary School (math 62% / reading 69%, grade B+, #500 of 2,144 statewide, top 24%, 1,015 students, 25% FRL); Omni Middle School (math 66% / reading 66%, grade A-, #93 of 571 statewide, top 16%, 1,128 students, 29% FRL); Spanish River Community High School (math 64% / reading 74%, grade B, #63 of 667 statewide, top 10%, 2,578 students, 25% FRL) — zoned schools average 26% FRL vs 52% district-wide (26 pts lower); this property's tenant base skews higher-income than the district average.
- Zoned-school proficiency averages 67% at this address vs 50% district-wide (+17 pts) — the actual schools serving this property are materially stronger than the Palm Beach average implies; a family-tenant draw the district grade alone would hide.
- Market conditions: Rents rising (+1.8%/yr); 421 active listings in the ZIP; 34 comparable units currently listed for rent nearby; rentals at typical pace (median 26d on market — plan ~3-4 weeks tenant-placement turnaround); solid renter incomes; 3,974 units permitted in Palm Beach County in 2024 (1,012 in 5+ unit buildings).
Forward outlook
- Local home prices are declining (-3.0%/yr); year-one equity from $2k of loan paydown is wiped out by about $10k of value loss. Plan a longer hold.
- Palm Beach County population projected at +30% by 2050 — long-run rental-demand tailwind backs the buy-and-hold thesis.
Negotiation context
- Only 0 days on market — expect competitive offers; lowballing is unlikely to land.
- 3 sale attempts since 15y ago with the ask held roughly flat each time — persistent listings suggest the price (not the market) is what's stuck; bring a comps-based counter.
- Current owner paid $120k; list at $349k implies a 191% gain — meaningful room to come down on a strong offer.
Risks & watch-outs
- Watch-outs: HOA is 29% of rent.
- Climate carrying-cost: severe wind risk, 99% chance of damaging wind over 30y; extreme-heat days projected 7→26/yr by 2055 (HVAC capex compounding) — expect insurance premiums to compound above CPI over the hold.
Questions for the listing agent
- What do current leases actually rent for vs. the listed asking? Can we see a recent rent roll and the last 12 months of T-12 income?
- What does the HOA fee cover, when was the last increase, and are there any pending special assessments or reserve-fund shortfalls?
- Any open or pending special assessments — roof, HVAC, plumbing, elevator, façade? What's the per-unit balance and payoff schedule, and is the seller paying it off at close or rolling it to the buyer?
- Is there a deadline driving the sale (1031 exchange, divorce, estate, relocation)? That informs how much negotiation room exists.
- Schools are A-rated — typically a magnet for longer-tenancy family renters. What's the average tenant stay here, and is there a school-zone premium baked into asking?
- The area grade is low — what's the realistic commute time and amenity access for the typical tenant pool here? Any planned neighborhood developments (good or bad) we should know about?
- What's the average days-on-market for RENTAL listings here right now (not sales)? A rising rental-DOM trend means longer vacancies and softer asking-rent achievability than the comps imply.
- What's the recent tenant-quality profile in this submarket — average credit score on applications, eviction rate, late-payment / NSF rate, and stable-employment percentage? A property-management company in the area should have these aggregated.
- How much new apartment / multifamily construction is in the pipeline within 1–3 miles? Heavy new supply (>2% of stock underway) typically softens rents 12–24 months out; light construction supports rent growth.
Investment metrics
- 1% rule
- 1.17% ✓
- Cap rate
- 5.88%
- Cash-on-cash
- -1.48%
- DSCR
- 0.93
- GRM
- 7.1
CMA / ARV
No comps found within radius.
Projected returns pro-forma
-3.0% appreciation · 1.81% rent growth · sell at horizon
- IRR
- -20.4%
- Equity multiple
- 0.30×
- Total profit
- $-68,454
- Equity at exit
- $52,037
- IRR
- -17.1%
- Equity multiple
- 0.12×
- Total profit
- $-86,322
- Equity at exit
- $30,175
Cash invested: $97,720 (down + closing). Projections, not guarantees.
Landlord ↔ Tenant lean methodology
- Overall (STATE)
- 87 Strongly Landlord-Friendly
- State Florida
- 87 Strongly Landlord-Friendly · R+3
- County
- — inherits STATE
- City
- — inherits STATE
ZIP-level market 33434
- Rents YoY
- 1.8%
- Active inventory
- 421
- Price-to-rent
- 7.1×
Monthly cashflow live
- Estimated rent
- $4,093 high interval (Pro) →
- Mortgage (P&I)
- −$1,830
- Tax from tax record
- −$201 /mo · $2,410/yr
- Insurance
- −$145
- HOA
- −$1,178
- Vacancy / Maint / Mgmt
- −$860
- Net cashflow
- $-121
Break-even live
Sensitivity live
| Price | -10% $77 | -5% $-22 | +0% $-121 | +5% $-220 | +10% $-318 |
|---|---|---|---|---|---|
| Rent | -10% $-444 | -5% $-283 | +0% $-121 | +5% $41 | +10% $202 |
| Rate | -1.0pp $55 | -0.5pp $-32 | base $-121 | +0.5pp $-211 | +1.0pp $-303 |
UW: 25.0% down · 7.5% · 30yr · 1.5% tax · 5.0% vac · 8.0% maint · 8.0% mgmt
Financing live
Cash to close
- Down payment
- $87,250
- Closing costs
- $10,470
- Reserves months
- —
- Total cash needed
- —
Loan-product check · same deal, 3 products live
Conventional
25% down · 7.5% · 30yr
- Down + closing
- —
- Monthly P&I
- —
- Monthly cashflow
- —
- DSCR
- —
- Eligible?
- —
Personal DTI + credit; lowest rate.
DSCR
20% down · 8.5% · 30yr
- Down + closing
- —
- Monthly P&I
- —
- Monthly cashflow
- —
- DSCR
- —
- Eligible?
- —
No personal income docs; deal must DSCR.
Hard money
10% down · 12.0% · 12mo
- Down + closing
- —
- Monthly P&I
- —
- Monthly cashflow
- —
- DSCR
- —
- Eligible?
- —
Short-term bridge; refi at stabilization.
Rent comps 34 comps
| Address | Beds | Baths | Sqft | Rent | $/sqft | DOM | Units | Dist |
|---|---|---|---|---|---|---|---|---|
| 6805 Willow Wood Dr #5042 Boca Raton, FL | 2.0 | 2.0 | 1260 | $5,500 | $4.37 | 23d | 1 | 0.01mi |
| 6797 Willow Wood Dr #6034 Boca Raton, FL | 2.0 | 2.0 | 1260 | $4,900 | $3.89 | 26d | 1 | 0.10mi |
| 7067 Rain Forest Dr Boca Raton, FL | 2.0 | 2.0 | 1271 | $3,000 | $2.36 | 26d | 1 | 0.54mi |
| 10235 Entrada Pl Boca Raton, FL | 1.0–3.0 | 1.0–2.0 | 952 | $2,358 | $2.48 | 0d | 29 | 0.65mi |
| 23392 Country Club Dr Boca Raton, FL | 3.0 | 2.0 | 1200 | $3,500 | $2.92 | 1d | 1 | 0.69mi |
| 3509 NW 26th Ct Boca Raton, FL | 3.0 | 3.0 | 1804 | $5,100 | $2.83 | 19d | 1 | 0.70mi |
| 3205 Bridgewood Dr #3205 Boca Raton, FL | 2.0 | 2.5 | 1400 | $3,200 | $2.29 | 26d | 1 | 0.74mi |
| 3289 NW 25th Way Boca Raton, FL | 3.0 | 2.0 | 1622 | $4,500 | $2.77 | 26d | 1 | 0.77mi |
| 3289 NW 25th Way Unit 3289 Boca Raton, FL | 3.0 | 2.0 | 1622 | $4,500 | $2.77 | 18d | 1 | 0.77mi |
| 2598 NW 36th St Boca Raton, FL | 3.0 | 2.0 | 1800 | $4,900 | $2.72 | 26d | 1 | 0.78mi |
| 3509 NW 25th Way Boca Raton, FL | 3.0 | 2.0 | 1427 | $5,200 | $3.64 | 26d | 1 | 0.82mi |
| 3604 Bridgewood Dr Boca Raton, FL | 2.0 | 2.5 | 1400 | $2,450 | $1.75 | 26d | 1 | 0.83mi |
| 115 Saint Cloud Ln Boca Raton, FL | 3.0 | 2.0 | 1750 | $5,950 | $3.40 | 4d | 1 | 0.87mi |
| 20889 Saint Andrews Blvd Boca Raton, FL | 2.0 | 2.0 | 1200 | $3,090 | $2.58 | 22d | 1 | 0.90mi |
| 3705 Bridgewood Dr Boca Raton, FL | 2.0 | 2.0 | 1400 | $3,500 | $2.50 | 26d | 1 | 0.90mi |
| 20901 St Andrews Blvd Boca Raton, FL | 1.0–3.0 | 1.0–3.0 | 1356 | $3,100 | $2.29 | 12d | 1 | 0.95mi |
| 6079 Town Colony Dr Boca Raton, FL | 1.0–2.0 | 1.0–2.0 | 902 | $3,188 | $3.53 | 0d | 19 | 0.97mi |
| 2404 Bridgewood Dr Boca Raton, FL | 2.0 | 2.5 | 1400 | $4,700 | $3.36 | 26d | 1 | 0.98mi |
| 1002 Bridgewood Pl #1002 Boca Raton, FL | 3.0 | 2.5 | 1550 | $3,500 | $2.26 | 26d | 1 | 1.04mi |
| 1405 Bridgewood Dr Unit 1405 Boca Raton, FL | 2.0 | 2.5 | 1400 | $3,100 | $2.21 | 26d | 1 | 1.05mi |
| 1405 Bridgewood Dr Unit 1405 Boca Raton, FL | 2.0 | 2.5 | 1400 | $3,000 | $2.14 | 23d | 1 | 1.05mi |
| 2411 NW 31st St Boca Raton, FL | 3.0 | 2.0 | 1777 | $5,800 | $3.26 | 26d | 1 | 1.07mi |
| 2411 NW 31st St Boca Raton, FL | 3.0 | 2.0 | 1777 | $5,800 | $3.26 | 0d | 1 | 1.07mi |
| 19809 Boca West Dr Unit 4043 Boca Raton, FL | 2.0 | 2.0 | 1400 | $3,100 | $2.21 | 26d | 1 | 1.08mi |
| 19550 Sawgrass Dr #2102 Boca Raton, FL | 2.0 | 2.0 | 1460 | $5,500 | $3.77 | 26d | 1 | 1.09mi |
| 7738 Lakeside Blvd #373 Boca Raton, FL | 2.0 | 2.0 | 1050 | $2,200 | $2.10 | 26d | 1 | 1.09mi |
| 7835 Lakeside Blvd #946 Boca Raton, FL | 2.0 | 2.0 | 1050 | $3,800 | $3.62 | 7d | 1 | 1.19mi |
| 3210 NW 23rd Ter Boca Raton, FL | 3.0 | 2.0 | 1742 | $6,300 | $3.62 | 26d | 1 | 1.20mi |
| 7754 Lakeside Blvd #483 Boca Raton, FL | 2.0 | 2.0 | 1050 | $2,700 | $2.57 | 4d | 1 | 1.23mi |
| 7754 Lakeside Blvd #446 Boca Raton, FL | 2.0 | 2.0 | 1050 | $3,500 | $3.33 | 26d | 1 | 1.23mi |
| 5881 Town Bay Dr Boca Raton, FL | 1.0–3.0 | 1.0–2.0 | 1050 | $2,905 | $2.77 | 0d | 24 | 1.33mi |
| 21543 Saint Andrews Grand Cir Boca Raton, FL | 3.0 | 3.0 | 1825 | $4,300 | $2.36 | 26d | 1 | 1.39mi |
| 21543 Saint Andrews Grand Cir #41 Boca Raton, FL | 3.0 | 2.5 | 1825 | $4,000 | $2.19 | 9d | 1 | 1.39mi |
| 6050 Amberwoods Dr Boca Raton, FL | 3.0 | 2.0 | 1654 | $3,995 | $2.42 | 23d | 1 | 1.49mi |
HOA detail condo
- Monthly dues
- $1,178 · $14,136/yr
- Likely covers
- poolgym
- Assessments
- None detected in remarks — confirm with the listing agent.
Listing history 7 events
-
2026-05-18historical
-
2026-05-18$349,000
-
2024-10-03historical
-
2024-08-19$350,000 Active
-
2012-09-27historical
-
2011-04-29$150,000
-
1997-02-21soldstatus $120,000
ⓘ Source: listings_history table (triggers on properties + properties_extension) + one-shot
backfill from property_details.listing_events for pre-trigger history.
Tax reassessment forecast FL · Resets to sale price
- Current annual tax
- $2,410 · $201/mo
- Projected year-2 tax
- $2,897 · $241/mo
- Expected delta
- +$487/yr (+$41/mo · 20.2%)
ⓘ Screening estimate from a state-policy table — verify with the county assessor before closing.
Climate risk First Street
- Flood 1/10 Low FEMA zone X (unshaded) · 0% chance over 30 yrs
- Wildfire 1/10 Low
- Heat 9/10 Extreme 7 d/yr ≥107°F today · 26 d/yr by 30 yrs out
- Wind 10/10 Extreme 99% chance of damaging wind over 30 yrs
- Air quality 3/10 Moderate 2 unhealthy d/yr today · 3 by 30 yrs out
Nearby sold comps map
Loading sold comps map…
Walkable amenities ~0.75 mi
Loading nearby amenities…
Taxation est. · year 1
- Rental income
- $49,118
- − Mortgage interest
- −$19,549
- − Property taxes
- −$2,410
- − Insurance
- −$1,745
- − Repairs & maintenance
- −$3,929
- − Management
- −$3,929
- − HOA
- −$14,136
- − Depreciation
- −$10,153
- Taxable loss
- −$6,734
- Est. tax savings @ 24.0%
- +$1,616
- After-tax cash flow
- $166/yr
For passive investors: Depreciation is non-cash, so a rental often shows a tax loss while cash-flowing — sheltering income. Rental losses are passive: they offset passive income freely, and up to $25,000/yr can offset ordinary (W-2) income if you actively participate and your MAGI is under $100k (phasing out to $0 by $150k); unused losses carry forward. On sale, claimed depreciation is recaptured at up to 25%, and gains may owe capital-gains tax (a 1031 exchange can defer both). Figures are a year-1 estimate at your 24.0% rate — not tax advice; consult a CPA.
Schools (NCES district)
- District
- Palm Beach
- NCES district ID
- 1201500
- Math proficiency
- 46% ▼ -16.00%
- Reading proficiency
- 53% ▼ -4.00%
- Median HH income
- $53,943
- Composite
- 42.72/100
- National rank
- #3160
- State rank
- #34 of 73 in FL
Livability — Boca Raton
- Score
- 77/100
- State rank
- #192
- US rank
- #3070
Category grades
Schools grade is shown separately in the Schools card above.
Census & demographics
- County
- Palm Beach County · 1,438,312 people
- City population
- 250,102
- Metro
- Miami-Fort Lauderdale-Pompano Beach, FL
- Population (ZIP)
- 21,686
- Household income
- $77,269
- Rent vs Own
- Severe rent burden
- 812.0
Population outlook (Palm Beach County) Hauer SSP2
- Today (2025)
- 1,637,487 people
- By 2030
- 1,743,255 · +6.5%
- By 2040
- 1,948,712 · +19.0%
- By 2050
- 2,132,979 · +30.3%
- By 2075
- 2,530,027 · +54.5%
- By 2100
- 2,706,979 · +65.3%
Race, ethnicity, and origin ACS 2023
- Neighborhood character
- Predominantly White (72%)
- Race & ethnicity
- White 72% Hispanic / Latino 18% Two or more races 13% Asian 3% Black 3%
- Hispanic origin (detail)
- Mexican 2% Puerto Rican 2% Cuban 1%
- Common ancestry
- Romanian 9% Scotch-Irish 8% Italian 2%
- Foreign-born
- 25% · Canada, Jamaica, South Korea
- Languages at home
- 73% English-only · Spanish 15% Other Indo-European 4% Russian/Polish/Slavic 1%
Political lean MEDSL · Palm Beach
- 2024 margin
- Toss-up / Even · D 50.0% · R 49.2%
- 2008→2024 swing
- -22.1pp toward R · 2008: 22.9pp · 2024: 0.8pp
- All cycles
- 2024: D+0.8 2020: D+12.8 2016: D+15.3 2012: D+17.0 2008: D+22.9
Not yet ingested
- Civics
- —
Market trends
- HPI YoY
- ▼ -279.89%
- Current HPI
- 271.1328
- Rent YoY
- ▲ 1.81%
- Metro
- Miami-Fort Lauderdale-Pompano Beach, FL
- State GDP YoY
- ▲ 3.28%
- F500 in state
- 36
Industry mix (Fortune 500 HQ in FL)
| Industry | F500 HQs | Revenue |
|---|---|---|
| Industrial Technology | 2 | $29B |
|
||
| Insurance | 2 | $17B |
|
||
| Retail | 1 | $60B |
|
||
| Technology Distribution | 1 | $58B |
|
||
| Homebuilding | 1 | $35B |
|
||
| Technology Manufacturing | 1 | $35B |
|
||
Price history
+190.8% since first listed7 events — show timeline
- 2026-05-18 Listed $349,000 Beaches MLS
- 2026-05-18 Listing Removed — Beaches MLS
- 2024-10-03 Listing Removed — Beaches MLS
- 2024-08-19 Listed $350,000 Beaches MLS
- 2012-09-27 Listing Removed — Beaches MLS
- 2011-04-29 Listed $150,000 Beaches MLS
- 1997-02-21 Sold (Public Records) $120,000 Public Records
Property tax history
+5.6%/yrLatest (2025): $2,410 · +6.9% YoY. Source: county tax records.
Cash-flow waterfall
monthlySold comps — $/sqft
last 12 mo · ≤1 miLoading sold comps…