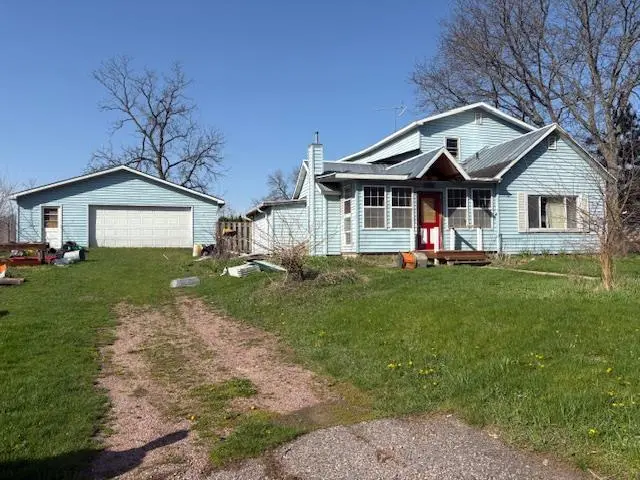
908 Mound St · Baraboo, WI
Flood risk 1/10 · Minimal
- FEMA flood zone
- X (unshaded)
- Chance of flooding over 30 yrs
- 0.0%
- Est. flood insurance / yr
- $473 – $860
Fire risk 2/10 · Minimal
- Est. fire insurance / yr
- $636 – $1,182
Heat risk 2/10 · Minimal
- Hot days now (above 99°F)
- 7 days/yr
- Hot days in 30 yrs
- 14 days/yr
Wind risk 2/10 · Minimal
- Chance of severe wind over 30 yrs
- —
Air-quality risk 2/10 · Minimal
- Unhealthy air days now
- 0 days/yr
- Unhealthy air days in 30 yrs
- 1 days/yr
Risk factors via First Street. Map © Google.
Why this score? — see what drove the C grade
The composite is a weighted blend of 9 inputs, each scored 0–100. Each bar is that input's sub-score; the figure is the points it added to the 100-point composite (weight × sub-score).
- Cash flow +23.1/30.0
- ARV discount +7.5/15.0
- DSCR +7.4/10.0
- 1% rule +7.2/10.0
- Livability +3.9/5.0
- Schools +3.0/10.0
- Rent growth +2.5/5.0
- Condition / age +2.5/5.0
- Appreciation +0.0/10.0
$125,000
🖨 Deal sheet 📄 Offer letter ✓ Due diligence
Listing remarks
A great opportunity for contractors, investors, or buyers looking to renovate! Bring your tools and your vision to bring this single-family residence back to vibrance. The Baraboo Riverwalk, Circus World Museum, and historic Downtown Baraboo are all within walking distance. Contact us to set up a private showing!
Key facts
- 0.44 acre lot
- 2 garage spots
- Listed 2 days
Property features AI
Finance
- Other: Appliances included: Range/oven and refrigerator; Sellers will exclude personal property
- Financial info: No investor or income/expense details provided
- HOA & community: No HOA information provided
Exterior
- Parking: 2-car garage (detached/attached type not specified)
- Security: No security features listed
- Utilities: Municipal water; Municipal sewer
- Home design: Single-family, 2-story home; Estimated finished above-grade living area about 1,700; Information lists year built as 'Other - See Remarks'; Zoned residential; Lot around 0.44 acre
- Construction: Vinyl siding; Basement partial with block foundation
- Exterior features: Vinyl exterior
Interior
- Kitchen: Includes refrigerator; Kitchen on main level approximately 13 x 9
- Bedrooms: Master bedroom (Upper) approximately 18 x 12; Bedroom 2 (Upper) approximately 7 x 20; Bedroom 3 (Lower) approximately 7 x 13
- Flooring: No flooring details provided
- Bathrooms: Two full bathrooms; Master bedroom has a full bath and tub
- Heating & cooling: Forced air heating; Natural gas fuel
- Interior features: Cable/Satellite available; High-speed internet available; Partial basement with outside entry and block foundation
- Laundry & utility: No specific laundry appliances listed
Neighborhood map
What this means for you Summary
Snapshot
- This is a 3-bed/2.0-bath single-family listed at $125k.
Deal economics
- At list price, monthly cash flow is $224 ($3k/yr) — positive.
- The deal already cash-flows at list — no discount required.
- Meets the 1% rule at list price ($2k rent vs $125k).
- Cap rate 8.4% vs local median 2.4% in Baraboo — top-decile yield for the area; either an underpriced asset or a hidden risk that comps aren't pricing in. Stress-test before assuming the spread holds.
Location & tenants
- Location reads 77/100 on livability (#118 in WI, #3,059 nationally) — a middle-class / working-renter tenant base. Strengths: cost of living A+, housing A+, health & safety A+; Watch: employment D, commute F.
- Baraboo School District (town): math 34% / reading 35% proficiency, ranked #232 of 342 in WI (top 68%) — families likely to look elsewhere, expect single-tenant / working-renter base with shorter leases.
- Zoned schools: East Elementary (math 57% / reading 42%, grade D, #257 of 1,041 statewide, top 30%, 343 students, 48% FRL); Baraboo High (math 31% / reading 31%, grade F, #204 of 483 statewide, top 43%, 917 students, 42% FRL) — zoned schools at 45% FRL track the district average.
- Market conditions: 102 active listings in the ZIP; 2 comparable units currently listed for rent nearby; 527 units permitted in Sauk County in 2024 (268 in 5+ unit buildings).
Forward outlook
- Local home prices are declining (-3.0%/yr); year-one equity from $864 of loan paydown is wiped out by about $4k of value loss. Plan a longer hold.
Negotiation context
- Only 2 days on market — expect competitive offers; lowballing is unlikely to land.
Risks & watch-outs
- Watch-outs: property tax is 2.6% of price.
Questions for the listing agent
- Property tax is high relative to price — has the assessment been appealed recently, and will the sale trigger a re-assessment?
- Is there a deadline driving the sale (1031 exchange, divorce, estate, relocation)? That informs how much negotiation room exists.
- What's the average days-on-market for RENTAL listings here right now (not sales)? A rising rental-DOM trend means longer vacancies and softer asking-rent achievability than the comps imply.
- What's the recent tenant-quality profile in this submarket — average credit score on applications, eviction rate, late-payment / NSF rate, and stable-employment percentage? A property-management company in the area should have these aggregated.
- How much new for-sale + rental construction is in the pipeline within 1–3 miles? Heavy new supply typically softens prices + rents 12–24 months out; constrained supply supports both.
Investment metrics
- 1% rule
- 1.22% ✓
- Cap rate
- 8.44%
- Cash-on-cash
- 7.68%
- DSCR
- 1.34
- GRM
- 6.8
CMA / ARV
- ARV (on-the-fly)
- $258,400
- Comps found
- 12
Show comp detail 12 sales within ~0.75 mi
| Address | Dist | Beds/Ba | Sqft | Sold | Price | $/sf | Match |
|---|---|---|---|---|---|---|---|
| 908 Mound St | 0.00mi | 3/2.0 | 1,700 (0%) | 1mo | $146,500 | $86 | 100 |
| 736 Mound St | 0.13mi | 3/2.0 | 1,760 (+4%) | 8mo | $292,000 | $166 | 81 |
| 1017 4th St | 0.30mi | 3/1.5 | 1,638 (-4%) | 11mo | $300,000 | $183 | 69 |
| 216 Washington Ave | 0.22mi | 3/2.0 | 1,842 (+8%) | 9mo | $300,000 | $163 | 69 |
| 414 8th St | 0.65mi | 3/2.5 | 1,659 (-2%) | 8mo | $252,200 | $152 | 57 |
| 303 3rd St | 0.54mi | 3/1.5 | 1,564 (-8%) | 6mo | $151,000 | $97 | 55 |
| 1140 4th St | 0.40mi | 3/2.0 | 1,472 (-13%) | 8mo | $255,000 | $173 | 53 |
| 227 1st St | 0.54mi | 4/1.5 (+1) | 1,592 (-6%) | 10mo | $230,000 | $144 | 49 |
| 204 South St | 0.72mi | 3/2.0 | 1,837 (+8%) | 10mo | $245,000 | $133 | 44 |
| 617 East St | 0.61mi | 4/2.0 (+1) | 1,938 (+14%) | 3mo | $206,360 | $106 | 41 |
| 330 7th St | 0.63mi | 4/1.0 (+1) | 1,502 (-12%) | 2mo | $228,500 | $152 | 40 |
| 525 10th St | 0.74mi | 3/2.0 | 1,478 (-13%) | 8mo | $305,000 | $206 | 37 |
Match score weights: distance 35% · size 25% · config 20% · recency 20%. Top-matched comps best support the ARV.
Projected returns pro-forma
-3.0% appreciation · 3.0% rent growth · sell at horizon
- IRR
- -4.5%
- Equity multiple
- 0.83×
- Total profit
- $-5,893
- Equity at exit
- $18,638
- IRR
- 5.3%
- Equity multiple
- 1.39×
- Total profit
- $13,620
- Equity at exit
- $10,808
Cash invested: $35,000 (down + closing). Projections, not guarantees.
Landlord ↔ Tenant lean methodology
- Overall (STATE)
- 73 Landlord-Friendly
- State Wisconsin
- 73 Landlord-Friendly · R+2
- County
- — inherits STATE
- City
- — inherits STATE
ZIP-level market 53913
- Active inventory
- 102
- Price-to-rent
- 6.8×
Monthly cashflow live
- Estimated rent
- $1,522 medium interval (Pro) →
- Mortgage (P&I)
- −$656
- Tax from tax record
- −$271 /mo · $3,247/yr
- Insurance
- −$52
- HOA
- −$0
- Vacancy / Maint / Mgmt
- −$320
- Net cashflow
- $224
Break-even live
UW: 25.0% down · 7.5% · 30yr · 1.5% tax · 5.0% vac · 8.0% maint · 8.0% mgmt
Financing live
Cash to close
- Down payment
- $31,250
- Closing costs
- $3,750
- Reserves months
- —
- Total cash needed
- —
Loan-product check · same deal, 3 products live
Conventional
25% down · 7.5% · 30yr
- Down + closing
- —
- Monthly P&I
- —
- Monthly cashflow
- —
- DSCR
- —
- Eligible?
- —
Personal DTI + credit; lowest rate.
DSCR
20% down · 8.5% · 30yr
- Down + closing
- —
- Monthly P&I
- —
- Monthly cashflow
- —
- DSCR
- —
- Eligible?
- —
No personal income docs; deal must DSCR.
Hard money
10% down · 12.0% · 12mo
- Down + closing
- —
- Monthly P&I
- —
- Monthly cashflow
- —
- DSCR
- —
- Eligible?
- —
Short-term bridge; refi at stabilization.
Rent comps 2 comps
| Address | Beds | Baths | Sqft | Rent | $/sqft | DOM | Units | Dist |
|---|---|---|---|---|---|---|---|---|
| 915 Ellis Ave Baraboo, WI | 1.0–2.0 | 1.0–2.0 | 1010 | $1,850 | $1.83 | 14d | 4 | 0.94mi |
| 1101 Silver Dr Baraboo, WI | 1.0–3.0 | 1.0 | 950 | $1,399 | $1.47 | 14d | 9 | 1.18mi |
Listing history 2 events
-
2026-05-01status Pending
-
2026-04-27$125,000 Active
ⓘ Source: listings_history table (triggers on properties + properties_extension) + one-shot
backfill from property_details.listing_events for pre-trigger history.
Tax reassessment forecast WI · Partial reset (capped growth)
- Current annual tax
- $3,247 · $271/mo
- Projected year-2 tax
- $3,247 · $271/mo
- Expected delta
- $0/yr ($0/mo · 0.0%)
ⓘ Screening estimate from a state-policy table — verify with the county assessor before closing.
Climate risk First Street
- Flood 1/10 Low FEMA zone X (unshaded) · 0% chance over 30 yrs
- Wildfire 2/10 Low
- Heat 2/10 Low 7 d/yr ≥99°F today · 14 d/yr by 30 yrs out
- Wind 2/10 Low
- Air quality 2/10 Low 0 unhealthy d/yr today · 1 by 30 yrs out
Nearby sold comps map
Loading sold comps map…
Walkable amenities ~0.75 mi
Loading nearby amenities…
Taxation est. · year 1
- Rental income
- $18,261
- − Mortgage interest
- −$7,002
- − Property taxes
- −$3,247
- − Insurance
- −$625
- − Repairs & maintenance
- −$1,461
- − Management
- −$1,461
- − Depreciation
- −$3,636
- Taxable income
- $829
- Est. tax owed @ 24.0%
- −$199
- After-tax cash flow
- $2,489/yr
For passive investors: Depreciation is non-cash, so a rental often shows a tax loss while cash-flowing — sheltering income. Rental losses are passive: they offset passive income freely, and up to $25,000/yr can offset ordinary (W-2) income if you actively participate and your MAGI is under $100k (phasing out to $0 by $150k); unused losses carry forward. On sale, claimed depreciation is recaptured at up to 25%, and gains may owe capital-gains tax (a 1031 exchange can defer both). Figures are a year-1 estimate at your 24.0% rate — not tax advice; consult a CPA.
Schools (NCES district)
- District
- Baraboo School District
- NCES district ID
- 5500810
- Math proficiency
- 34% ▼ -8.00%
- Reading proficiency
- 35% ▼ -6.00%
- Median HH income
- $49,101
- Composite
- 29.85/100
- National rank
- #6412
- State rank
- #232 of 342 in WI
Livability — Baraboo
- Score
- 77/100
- State rank
- #118
- US rank
- #3059
Category grades
Schools grade is shown separately in the Schools card above.
Census & demographics
- Census place
- Baraboo, WI
- County
- Sauk County · 36,155 people
- City population
- 21,704
- Metro
- Baraboo, WI
- Population (ZIP)
- 21,704
- Household income
- $74,629
- Rent vs Own
- Severe rent burden
- 651.0
Population outlook (Sauk County) Hauer SSP2
- Today (2025)
- 66,065 people
- By 2030
- 66,755 · +1.0%
- By 2040
- 66,999 · +1.4%
- By 2050
- 65,499 · -0.9%
- By 2075
- 60,000 · -9.2%
- By 2100
- 51,070 · -22.7%
Race, ethnicity, and origin ACS 2023
- Neighborhood character
- Predominantly White (88%)
- Race & ethnicity
- White 88% Two or more races 5% Hispanic / Latino 4% Native American 1% Black 1%
- Common ancestry
- Portuguese 8% Romanian 4% Slovak 3%
- Foreign-born
- 3% · Canada, Jamaica
- Languages at home
- 94% English-only · Spanish 3% Russian/Polish/Slavic 1% French/Haitian/Cajun 1%
Political lean MEDSL · Sauk
- 2024 margin
- Toss-up / Even · D 48.4% · R 50.0% · Other 1.6%
- 2008→2024 swing
- -23.2pp toward R · 2008: 21.6pp · 2024: -1.7pp
- All cycles
- 2024: R+1.7 2020: D+1.7 2016: R+0.3 2012: D+18.5 2008: D+21.6
Not yet ingested
- Civics
- —
Market trends
- HPI YoY
- ▼ -156.28%
- Current HPI
- 195.5466
- Rent YoY
- —
- Metro
- Baraboo, WI
- State GDP YoY
- ▲ 2.10%
- F500 in state
- 20
Industry mix (Fortune 500 HQ in WI)
| Industry | F500 HQs | Revenue |
|---|---|---|
| Industrial Machinery | 4 | $23B |
|
||
| Industrial Technology | 2 | $36B |
|
||
| Insurance | 1 | $36B |
|
||
| Professional Services | 1 | $19B |
|
||
| Utilities | 1 | $9B |
|
||
| Consumer Goods | 1 | $3B |
|
||
Price history
2 events — show timeline
- 2026-05-01 Pending — SCWMLS
- 2026-04-27 Listed $125,000 SCWMLS
Property tax history
+3.6%/yrLatest (2025): $3,247 · +7.0% YoY. Source: county tax records.
Cash-flow waterfall
monthlySold comps — $/sqft
last 12 mo · ≤1 miLoading sold comps…