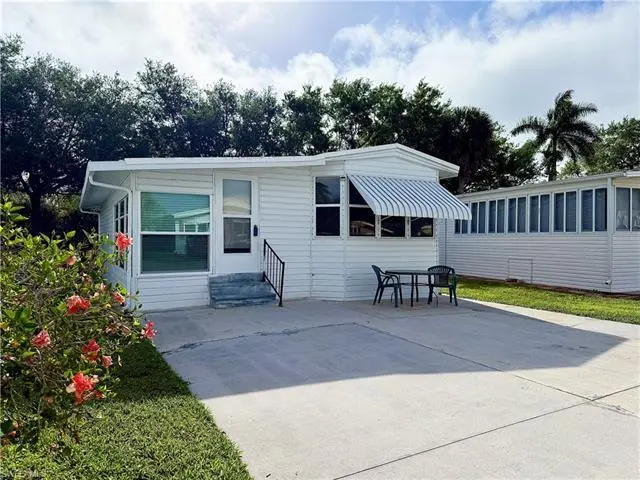
5 Bass Ln #5 · Winding Cypress, FL
Flood risk 8/10 · Major
- FEMA flood zone
- AE
- Chance of flooding over 30 yrs
- 0.98%
- Est. flood insurance / yr
- $1,737 – $8,500
Fire risk 4/10 · Minor
- Est. fire insurance / yr
- $947 – $1,759
Heat risk 10/10 · Severe
- Hot days now (above 108°F)
- 7 days/yr
- Hot days in 30 yrs
- 29 days/yr
Wind risk 10/10 · Severe
- Chance of severe wind over 30 yrs
- 99.0%
Air-quality risk 3/10 · Minor
- Unhealthy air days now
- 3 days/yr
- Unhealthy air days in 30 yrs
- 3 days/yr
Risk factors via First Street. Map © Google.
Why this score? — see what drove the B+ grade
The composite is a weighted blend of 9 inputs, each scored 0–100. Each bar is that input's sub-score; the figure is the points it added to the 100-point composite (weight × sub-score).
- Cash flow +30.0/30.0
- 1% rule +10.0/10.0
- DSCR +10.0/10.0
- ARV discount +7.5/15.0
- Schools +5.0/10.0
- Appreciation +4.3/10.0
- Rent growth +3.3/5.0
- Livability +2.5/5.0
- Condition / age +2.5/5.0
$115,000
🖨 Deal sheet 📄 Offer letter ✓ Due diligence
Listing remarks
Excellent location! Affordable Living! Plus, YOU OWN the LAND! Thank you for viewing 5 Bass Lane in Imperial Wilderness Condominium Association---a gated 55+ community that is conveniently located! It is approximately 2 miles to shopping and restaurants, 8 miles to Marco Island beaches, and 10 miles to Naples beaches. This 2Br/1.5Ba home offers a spacious kitchen, living room with a sleeper-sofa, and furnishings that stay. Since 2024 the following updates occurred: stainless-steel appliances, A/C, vinyl roof-over, siding, some windows, some flooring, and the LR ceiling fan. The HOA fee of $898. per quarter is very reasonable and covers many of your needs: water, lawn care, basic cable, tras
Key facts
- Gated community
- Vinyl roof over
- Community amenities
Tags
Property features AI
Finance
- Other: Part of a larger complex with 546 units; Single unit in building on one floor; Lot restrictions: limited number of vehicles
- HOA & community: Quarterly condo fee ($898); Annual recurring fees total $3,592; One-time fees $150; Professional management; Community amenities include billiards, bocce court, clubhouse, community pool, spa/hot tub, dog park, fishing pier, library, pickleball, shuffleboard, and tennis courts; Maintenance covers cable, lawn/land maintenance, sewer, trash removal, and water; Gated community
Exterior
- Parking: Paved parking
- Security: Gated
- Utilities: Central water; Central sewer; Cable available
- Home design: Manufactured residential home; Single-story; Rear exposure faces east
- Construction: Manufactured construction; Metal roof; Built in 1985
- Exterior features: Shutters for storm protection; Vinyl siding exterior; Gated community; Wooded area view; Public road access; Reclaimed irrigation
Interior
- Kitchen: Dishwasher; Microwave; Range; Refrigerator/Freezer
- Bedrooms: 2 bedrooms
- Flooring: Carpet; Tile; Vinyl
- Bathrooms: 1 full bathroom; 1 half bathroom; Master bathroom: None
- Heating & cooling: Central electric heat; Central electric cooling
- Interior features: Eat-in kitchen; Partially furnished; See remarks for additional interior details
Neighborhood map
What this means for you Summary
Snapshot
- This is a 2-bed/1.5-bath condo listed at $115k.
Deal economics
- At list price, monthly cash flow is $227 ($3k/yr) — positive.
- The deal already cash-flows at list — no discount required.
- Meets the 1% rule at list price ($2k rent vs $115k).
- Recommended offer: $108k (6.0% below list) — sets the bar for market timing.
Location & tenants
- Location reads: area grade B — affects rentability + tenant quality, not the cash-flow math above.
- Collier (suburban): math 60% / reading 56% proficiency, ranked #16 of 73 in FL (top 22%) — acceptable for families but not a draw, mixed tenant base, ~2y average lease.
- Market conditions: Rents rising (+3.2%/yr); 900 active listings in the ZIP; solid renter incomes; 3,520 units permitted in Collier County in 2024 (959 in 5+ unit buildings).
Forward outlook
- Local home prices are declining (-1.5%/yr); year-one equity from $795 of loan paydown is wiped out by about $2k of value loss. Plan a longer hold.
- Collier County population projected at +30% by 2050 — long-run rental-demand tailwind backs the buy-and-hold thesis.
- At projected returns (-1.5% appreciation + 3.2% rent growth), your $32k cash investment doubles in ~9 years — after that, you're playing with house money.
Negotiation context
- It's been on market 70 days — a 6% lower offer ($108k) is reasonable based on typical stale-listing flexibility.
- 8 sale attempts since 14y ago with the ask held roughly flat each time — persistent listings suggest the price (not the market) is what's stuck; bring a comps-based counter.
- Current owner paid $60k; list at $115k implies a 92% gain — meaningful room to come down on a strong offer.
Risks & watch-outs
- Watch-outs: flood insurance adds $427/mo.
- Climate carrying-cost: in FEMA flood zone AE (mandatory federal flood insurance); severe wind risk, 99% chance of damaging wind over 30y; extreme-heat days projected 7→29/yr by 2055 (HVAC capex compounding) — expect insurance premiums to compound above CPI over the hold.
Questions for the listing agent
- It's been on market 70 days. Have you received any prior offers? Is the seller open to a 6% concession, seller financing, or rate buy-down credit?
- What's the actual annual flood-insurance premium (NFIP or private), and is the property in a SFHA with mandatory coverage?
- What does the HOA fee cover, when was the last increase, and are there any pending special assessments or reserve-fund shortfalls?
- Any open or pending special assessments — roof, HVAC, plumbing, elevator, façade? What's the per-unit balance and payoff schedule, and is the seller paying it off at close or rolling it to the buyer?
- Why hasn't it sold? Are there any deal-killer items the seller is aware of (foundation, flood, title, zoning, code violations)?
- Is there a deadline driving the sale (1031 exchange, divorce, estate, relocation)? That informs how much negotiation room exists.
- What's the average days-on-market for RENTAL listings here right now (not sales)? A rising rental-DOM trend means longer vacancies and softer asking-rent achievability than the comps imply.
- What's the recent tenant-quality profile in this submarket — average credit score on applications, eviction rate, late-payment / NSF rate, and stable-employment percentage? A property-management company in the area should have these aggregated.
- How much new apartment / multifamily construction is in the pipeline within 1–3 miles? Heavy new supply (>2% of stock underway) typically softens rents 12–24 months out; light construction supports rent growth.
Investment metrics
- 1% rule
- 1.85% ✓
- Cap rate
- 13.11%
- Cash-on-cash
- 24.34%
- DSCR
- 2.08
- GRM
- 4.5
CMA / ARV
No comps found within radius.
Projected returns pro-forma
-1.48% appreciation · 3.21% rent growth · sell at horizon
- IRR
- 3.0%
- Equity multiple
- 1.13×
- Total profit
- $4,199
- Equity at exit
- $25,129
- IRR
- 10.7%
- Equity multiple
- 2.02×
- Total profit
- $32,771
- Equity at exit
- $24,206
Cash invested: $32,200 (down + closing). Projections, not guarantees.
Landlord ↔ Tenant lean methodology
- Overall (STATE)
- 87 Strongly Landlord-Friendly
- State Florida
- 87 Strongly Landlord-Friendly · R+3
- County
- — inherits STATE
- City
- — inherits STATE
ZIP-level market 34114
- Home prices YoY
- -0.6%
- Rents YoY
- 3.2%
- Active inventory
- 900
- Price-to-rent
- 4.5×
Monthly cashflow live
- Estimated rent
- $2,133 medium interval (Pro) →
- Mortgage (P&I)
- −$603
- Tax from tax record
- −$81 /mo · $978/yr
- Insurance
- −$48
- Flood insurance flood zone
- −$427 /mo · $5,118/yr
- HOA
- −$299
- Vacancy / Maint / Mgmt
- −$448
- Net cashflow
- $227
Break-even live
UW: 25.0% down · 7.5% · 30yr · 1.5% tax · 5.0% vac · 8.0% maint · 8.0% mgmt
Financing live
Cash to close
- Down payment
- $28,750
- Closing costs
- $3,450
- Reserves months
- —
- Total cash needed
- —
Loan-product check · same deal, 3 products live
Conventional
25% down · 7.5% · 30yr
- Down + closing
- —
- Monthly P&I
- —
- Monthly cashflow
- —
- DSCR
- —
- Eligible?
- —
Personal DTI + credit; lowest rate.
DSCR
20% down · 8.5% · 30yr
- Down + closing
- —
- Monthly P&I
- —
- Monthly cashflow
- —
- DSCR
- —
- Eligible?
- —
No personal income docs; deal must DSCR.
Hard money
10% down · 12.0% · 12mo
- Down + closing
- —
- Monthly P&I
- —
- Monthly cashflow
- —
- DSCR
- —
- Eligible?
- —
Short-term bridge; refi at stabilization.
HOA detail condo
- Monthly dues
- $299 · $3,588/yr
- Likely covers
- watercablelandscapingsecurity
- Assessments
- None detected in remarks — confirm with the listing agent.
Listing history 33 events
-
2026-06-18days on market $115,000 Active 70 DOM
-
2026-06-17days on market $115,000 Active 69 DOM
-
2026-06-16days on market $115,000 Active 68 DOM
-
2026-06-15days on market $115,000 Active 67 DOM
-
2026-06-14days on market $115,000 Active 65 DOM
-
2026-06-10days on market $115,000 Active 62 DOM
-
2026-06-09days on market $115,000 Active 61 DOM
-
2026-06-08days on market $115,000 Active 60 DOM
-
2026-06-07days on market $115,000 Active 59 DOM
-
2026-06-03days on market $115,000 Active 55 DOM
-
2026-06-02days on market $115,000 Active 54 DOM
-
2026-06-01days on market $115,000 Active 53 DOM
-
2026-05-31days on market $115,000 Active 52 DOM
-
2026-05-30days on market $115,000 Active 51 DOM
-
2026-04-09$115,000 Active
-
2026-04-08historical
-
2026-01-31price $115,000
-
2025-10-10$125,000 Active
-
2025-06-15historical
-
2025-01-02$125,000 Active
-
2025-01-01historical
-
2024-07-01$139,000 Active
-
2024-04-29soldstatus $60,000
-
2024-04-26soldstatus $60,000 Sold
-
2024-04-02status Pending
-
2024-03-18status Active
-
2024-03-14$80,000
-
2014-01-29price $39,000
-
2014-01-29soldstatus $35,000
-
2013-12-11$35,000
-
2013-03-04historical
-
2012-02-01$59,900
-
1996-03-05soldstatus $41,000
ⓘ Source: listings_history table (triggers on properties + properties_extension) + one-shot
backfill from property_details.listing_events for pre-trigger history.
Tax reassessment forecast FL · Resets to sale price
- Current annual tax
- $978 · $81/mo
- Projected year-2 tax
- $978 · $81/mo
- Expected delta
- $0/yr ($0/mo · 0.0%)
ⓘ Screening estimate from a state-policy table — verify with the county assessor before closing.
Climate risk First Street
- Flood 8/10 Severe FEMA zone AE · 98% chance over 30 yrs
- Wildfire 4/10 Moderate
- Heat 10/10 Extreme 7 d/yr ≥108°F today · 29 d/yr by 30 yrs out
- Wind 10/10 Extreme 99% chance of damaging wind over 30 yrs
- Air quality 3/10 Moderate 3 unhealthy d/yr today · 3 by 30 yrs out
Nearby sold comps map
Loading sold comps map…
Walkable amenities ~0.75 mi
Loading nearby amenities…
Taxation est. · year 1
- Rental income
- $25,591
- − Mortgage interest
- −$6,442
- − Property taxes
- −$978
- − Insurance
- −$5,694
- − Repairs & maintenance
- −$2,047
- − Management
- −$2,047
- − HOA
- −$3,588
- − Depreciation
- −$3,345
- Taxable income
- $1,450
- Est. tax owed @ 24.0%
- −$348
- After-tax cash flow
- $2,373/yr
For passive investors: Depreciation is non-cash, so a rental often shows a tax loss while cash-flowing — sheltering income. Rental losses are passive: they offset passive income freely, and up to $25,000/yr can offset ordinary (W-2) income if you actively participate and your MAGI is under $100k (phasing out to $0 by $150k); unused losses carry forward. On sale, claimed depreciation is recaptured at up to 25%, and gains may owe capital-gains tax (a 1031 exchange can defer both). Figures are a year-1 estimate at your 24.0% rate — not tax advice; consult a CPA.
Schools (NCES district)
- District
- Collier
- NCES district ID
- 1200330
- Math proficiency
- 60% ▼ -4.00%
- Reading proficiency
- 56% ▼ -2.00%
- Median HH income
- $58,275
- Composite
- 50.23/100
- National rank
- #1892
- State rank
- #16 of 73 in FL
Livability — Winding Cypress
No livability data for this city. (Only ~50 U.S. cities are tracked.)
Census & demographics
- County
- Collier County · 396,295 people
- Metro
- Naples-Marco Island, FL
- Population (ZIP)
- 23,559
- Household income
- $89,334
- Rent vs Own
- Severe rent burden
- 550.0
Population outlook (Collier County) Hauer SSP2
- Today (2025)
- 420,858 people
- By 2030
- 450,054 · +6.9%
- By 2040
- 502,232 · +19.3%
- By 2050
- 544,932 · +29.5%
- By 2075
- 627,203 · +49.0%
- By 2100
- 659,015 · +56.6%
Race, ethnicity, and origin ACS 2023
- Neighborhood character
- Predominantly White (72%)
- Race & ethnicity
- White 72% Hispanic / Latino 17% Two or more races 13% Black 7%
- Hispanic origin (detail)
- Mexican 7% Puerto Rican 1% Cuban 3%
- Common ancestry
- Hispanic 5% Romanian 4% Lithuanian 1%
- Foreign-born
- 21% · Canada, Jamaica
- Languages at home
- 75% English-only · Spanish 15% French/Haitian/Cajun 5% Other Indo-European 4%
Political lean MEDSL · Collier
- 2024 margin
- Solid R (+33.1) · D 33.1% · R 66.2%
- 2008→2024 swing
- -10.6pp toward R · 2008: -22.5pp · 2024: -33.1pp
- All cycles
- 2024: R+33.1 2020: R+24.7 2016: R+26.0 2012: R+30.1 2008: R+22.5
Not yet ingested
- Civics
- —
Market trends
- HPI YoY
- ▼ -1.48%
- Current HPI
- 266.5545
- Rent YoY
- ▲ 3.21%
- Metro
- Naples-Marco Island, FL
- State GDP YoY
- ▲ 3.28%
- F500 in state
- 36
Industry mix (Fortune 500 HQ in FL)
| Industry | F500 HQs | Revenue |
|---|---|---|
| Industrial Technology | 2 | $29B |
|
||
| Insurance | 2 | $17B |
|
||
| Retail | 1 | $60B |
|
||
| Technology Distribution | 1 | $58B |
|
||
| Homebuilding | 1 | $35B |
|
||
| Technology Manufacturing | 1 | $35B |
|
||
Price history
+180.5% since first listed19 events — show timeline
- 2026-04-09 Listed $115,000 NAPLESMLS
- 2026-04-08 Listing Removed — NAPLESMLS
- 2026-01-31 Price Changed $115,000 NAPLESMLS
- 2025-10-10 Listed $125,000 NAPLESMLS
- 2025-06-15 Listing Removed — NAPLESMLS
- 2025-01-02 Listed $125,000 NAPLESMLS
- 2025-01-01 Listing Removed — NAPLESMLS
- 2024-07-01 Listed $139,000 NAPLESMLS
- 2024-04-29 Sold (Public Records) $60,000 Public Records
- 2024-04-26 Sold (MLS) $60,000 NAPLESMLS
- 2024-04-02 Pending — NAPLESMLS
- 2024-03-18 Relisted — NAPLESMLS
- 2024-03-14 Listed $80,000 NAPLESMLS
- 2014-01-29 Sold (MLS) $35,000 NAPLESMLS
- 2014-01-29 Price Changed $39,000 NAPLESMLS
- 2013-12-11 Listed $35,000 NAPLESMLS
- 2013-03-04 Listing Removed — NAPLESMLS
- 2012-02-01 Listed $59,900 NAPLESMLS
- 1996-03-05 Sold (Public Records) $41,000 Public Records
Property tax history
+7.1%/yrLatest (2025): $978 · +15.7% YoY. Source: county tax records.
Cash-flow waterfall
monthlySold comps — $/sqft
last 12 mo · ≤1 miLoading sold comps…