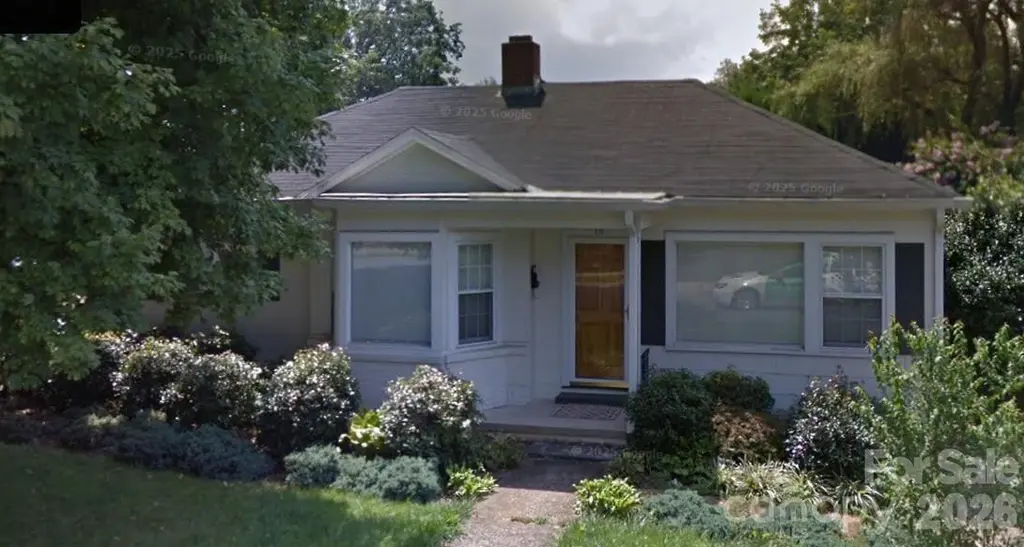
111 Greenbriar Ln · Morganton, NC
Flood risk 1/10 · Minimal
- FEMA flood zone
- X (unshaded)
- Chance of flooding over 30 yrs
- 0.0%
- Est. flood insurance / yr
- $473 – $860
Fire risk 3/10 · Minor
- Est. fire insurance / yr
- $906 – $1,684
Heat risk 5/10 · Moderate
- Hot days now (above 103°F)
- 7 days/yr
- Hot days in 30 yrs
- 18 days/yr
Wind risk 2/10 · Minimal
- Chance of severe wind over 30 yrs
- 1.0%
Air-quality risk 2/10 · Minimal
- Unhealthy air days now
- 2 days/yr
- Unhealthy air days in 30 yrs
- 2 days/yr
Risk factors via First Street. Map © Google.
Why this score? — see what drove the D+ grade
The composite is a weighted blend of 9 inputs, each scored 0–100. Each bar is that input's sub-score; the figure is the points it added to the 100-point composite (weight × sub-score).
- Cash flow +15.4/30.0
- ARV discount +12.6/15.0
- DSCR +4.7/10.0
- Schools +3.8/10.0
- Livability +3.5/5.0
- 1% rule +3.2/10.0
- Rent growth +2.5/5.0
- Condition / age +2.5/5.0
- Appreciation +0.0/10.0
$215,000
🖨 Deal sheet (PDF) 📄 Offer letter ✓ Due diligence
Listing remarks
A quaint ranch home located within minutes of I-40. The home is close to grocery stores, restaurants and shopping. This home is sold "AS IS". It needs someone to show some TLC. Three bedrooms, two bathrooms, with a basement area. Open kitchen space that flows into the living area. This is a must see and great value. New roof installed in August 2021.
Key facts
- Ranch home
- Open kitchen space
- Basement area
Tags
Property features AI
Finance
- HOA & community: No HOA
Exterior
- Parking: Attached carport (1 space); Driveway with 1 open parking space
- Utilities: City water; Public sewer; Electric service (electric appliances and heat pump)
- Home design: Single-family residential home; One story
- Construction: Site-built construction; Partial brick and asbestos exterior materials; Built with basement (unfinished)
- Exterior features: Gravel road access on a publicly maintained road; Lot approximately 0.2 acres (dimensions 80 x 105 x 80 x 105)
Interior
- Kitchen: Electric range; Refrigerator
- Bedrooms: Three bedrooms on the main level
- Flooring: Hardwood floors
- Bathrooms: Two full bathrooms on the main level
- Heating & cooling: Heat pump for heating and cooling
- Interior features: One main-level living area (1 room counted); Unfinished basement; Basement and crawl space foundation
- Laundry & utility: Laundry described as 'Other - See Remarks'; Electric water heater
Neighborhood map
What this means for you Summary
Snapshot
- This is a 3-bed/2.0-bath single-family listed at $215k.
Deal economics
- At list price, monthly cash flow is $82 ($989/yr) — positive.
- The deal already cash-flows at list — no discount required.
- To meet the 1% rule (rent ≥ 1% of price), the offer needs to be $176k (18.4% below list).
- Recommended offer: $176k (18.4% below list) — sets the bar for 1% rule.
- Cap rate 6.8% vs local median 3.5% in Morganton — top-decile yield for the area; either an underpriced asset or a hidden risk that comps aren't pricing in. Stress-test before assuming the spread holds.
Location & tenants
- Location reads 69/100 on livability (#149 in NC) — a middle-class / working-renter tenant base. Strengths: cost of living A+, health & safety A+, housing A; Watch: amenities D, crime D-, commute F.
- Burke County Schools (rural): math 43% / reading 47% proficiency, ranked #89 of 178 in NC (top 50%) — families likely to look elsewhere, expect single-tenant / working-renter base with shorter leases.
- Zoned schools: Forest Hill Elementary (math 32% / reading 37%, grade F, #835 of 1,410 statewide, top 62%, 269 students, 99% FRL); Walter R Johnson Middle (math 28% / reading 34%, grade F, #326 of 475 statewide, top 69%, 465 students, 90% FRL); Robert L. Patton High School (math 77% / reading 62%, grade B, #121 of 535 statewide, top 24%, 752 students, 55% FRL) — zoned schools average 81% FRL vs 52% district-wide (29 pts higher); higher-poverty schools than district average — tighter screening recommended.
- Market conditions: 436 active listings in the ZIP; 3 comparable units currently listed for rent nearby; rentals at typical pace (median 23d on market — plan ~3-4 weeks tenant-placement turnaround); 422 units permitted in Burke County in 2024 (94 in 5+ unit buildings).
- This rent runs 36% of the median local income ($58k/yr) — at the standard rent-burdened threshold; future hikes will face affordability resistance.
Forward outlook
- Local home prices are declining (-3.0%/yr); year-one equity from $1k of loan paydown is wiped out by about $6k of value loss. Plan a longer hold.
- Burke County population projected at -18% by 2050 — secular population decline; favor cash flow + early exit over multi-decade hold.
Negotiation context
- Only 13 days on market — expect competitive offers; lowballing is unlikely to land.
- Current owner paid $80k; list at $215k implies a 170% gain — meaningful room to come down on a strong offer.
Risks & watch-outs
- Watch-outs: built in 1950 — expect roof / HVAC / electrical / plumbing capex.
- Climate carrying-cost: extreme-heat days projected 7→18/yr by 2055 (HVAC capex compounding) — expect insurance premiums to compound above CPI over the hold.
Questions for the listing agent
- Built in 1950 — when were the roof, HVAC, electrical panel, plumbing, and water heater last replaced?
- Is there a deadline driving the sale (1031 exchange, divorce, estate, relocation)? That informs how much negotiation room exists.
- Schools are F-rated, which usually means shorter tenancies and higher turnover. Who's the typical renter profile here, and what's been the actual vacancy rate?
- Crime grade is D in this area — have there been break-ins, vandalism, or insurance claims at this property in the last 3 years? What carrier currently insures it and at what premium?
- The area grade is low — what's the realistic commute time and amenity access for the typical tenant pool here? Any planned neighborhood developments (good or bad) we should know about?
- What's the average days-on-market for RENTAL listings here right now (not sales)? A rising rental-DOM trend means longer vacancies and softer asking-rent achievability than the comps imply.
- What's the recent tenant-quality profile in this submarket — average credit score on applications, eviction rate, late-payment / NSF rate, and stable-employment percentage? A property-management company in the area should have these aggregated.
- How much new for-sale + rental construction is in the pipeline within 1–3 miles? Heavy new supply typically softens prices + rents 12–24 months out; constrained supply supports both.
Investment metrics
- 1% rule
- 0.82% ✗
- Cap rate
- 6.75%
- Cash-on-cash
- 1.64%
- DSCR
- 1.07
- GRM
- 10.2
CMA / ARV
- ARV (on-the-fly)
- $242,228
- Comps found
- 7
Show comp detail 7 sales within ~0.75 mi
| Address | Dist | Beds/Ba | Sqft | Sold | Price | $/sf | Match |
|---|---|---|---|---|---|---|---|
| 608 1/2 W Concord St | 0.32mi | 3/2.0 | 1,485 (+0%) | 2mo | $250,000 | $168 | 83 |
| 626 W Concord St | 0.31mi | 4/2.0 (+1) | 1,430 (-3%) | 1mo | $196,000 | $137 | 75 |
| 112 Starmount Cir | 0.56mi | 3/2.0 | 1,512 (+2%) | 18mo | $308,000 | $204 | 55 |
| 134 Starmount Cir | 0.45mi | 4/2.0 (+1) | 1,589 (+8%) | 10mo | $350,000 | $220 | 53 |
| 107 Burkemont Ave | 0.54mi | 2/2.5 (-1) | 1,321 (-11%) | 8mo | $216,000 | $164 | 43 |
| 110 Mimosa St | 0.48mi | 2/1.0 (-1) | 1,340 (-9%) | 16mo | $202,000 | $151 | 39 |
| 278 Asheville St | 0.64mi | 2/1.5 (-1) | 1,304 (-12%) | 23mo | $141,000 | $108 | 25 |
Match score weights: distance 35% · size 25% · config 20% · recency 20%. Top-matched comps best support the ARV.
Projected returns pro-forma
-3.0% appreciation · 3.0% rent growth · sell at horizon
- IRR
- -13.7%
- Equity multiple
- 0.51×
- Total profit
- $-29,677
- Equity at exit
- $32,057
- IRR
- -4.9%
- Equity multiple
- 0.68×
- Total profit
- $-19,430
- Equity at exit
- $18,589
Cash invested: $60,200 (down + closing). Projections, not guarantees.
Landlord ↔ Tenant lean methodology
- Overall (STATE)
- 85 Strongly Landlord-Friendly
- State North Carolina
- 85 Strongly Landlord-Friendly · R+3
- County
- — inherits STATE
- City
- — inherits STATE
ZIP-level market 28655
- Home prices YoY
- -13.2%
- Active inventory
- 436
- Price-to-rent
- 10.2×
Monthly cashflow live
- Estimated rent
- $1,755 medium interval (Pro) →
- Mortgage (P&I)
- −$1,127
- Tax from tax record
- −$87 /mo · $1,048/yr
- Insurance
- −$90
- HOA
- −$0
- Vacancy / Maint / Mgmt
- −$369
- Net cashflow
- $82
Break-even live
Sensitivity live
| Price | -10% $204 | -5% $143 | +0% $82 | +5% $22 | +10% $-39 |
|---|---|---|---|---|---|
| Rent | -10% $-56 | -5% $13 | +0% $82 | +5% $152 | +10% $221 |
| Rate | -1.0pp $191 | -0.5pp $137 | base $82 | +0.5pp $27 | +1.0pp $-30 |
UW: 25.0% down · 7.5% · 30yr · 1.5% tax · 5.0% vac · 8.0% maint · 8.0% mgmt
Financing live
Cash to close
- Down payment
- $53,750
- Closing costs
- $6,450
- Reserves months
- —
- Total cash needed
- —
Loan-product check · same deal, 3 products live
Conventional
25% down · 7.5% · 30yr
- Down + closing
- —
- Monthly P&I
- —
- Monthly cashflow
- —
- DSCR
- —
- Eligible?
- —
Personal DTI + credit; lowest rate.
DSCR
20% down · 8.5% · 30yr
- Down + closing
- —
- Monthly P&I
- —
- Monthly cashflow
- —
- DSCR
- —
- Eligible?
- —
No personal income docs; deal must DSCR.
Hard money
10% down · 12.0% · 12mo
- Down + closing
- —
- Monthly P&I
- —
- Monthly cashflow
- —
- DSCR
- —
- Eligible?
- —
Short-term bridge; refi at stabilization.
Rent comps 3 comps
| Address | Beds | Baths | Sqft | Rent | $/sqft | DOM | Units | Dist |
|---|---|---|---|---|---|---|---|---|
| 204 E McDowell St Unit B Morganton, NC | 4.0 | 1.0 | 1070 | $1,500 | $1.40 | 22d | 1 | 1.16mi |
| 142 Patrick Murphy Dr Morganton, NC | 1.0–2.0 | 1.0–2.0 | 966 | $1,899 | $1.97 | 15d | 13 | 1.22mi |
| 305 E Concord St Morganton, NC | 3.0 | 2.0 | 1488 | $2,000 | $1.34 | 22d | 1 | 1.35mi |
Listing history 12 events
-
2026-06-22days on market $215,000 Active 13 DOM
-
2026-06-19days on market $215,000 Active 11 DOM
-
2026-06-18days on market $215,000 Active 10 DOM
-
2026-06-17days on market $215,000 Active 9 DOM
-
2026-06-16days on market $215,000 Active 8 DOM
-
2026-06-15days on market $215,000 Active 7 DOM
-
2026-06-14days on market $215,000 Active 5 DOM
-
2026-06-13remarks 353-char remark
-
2026-06-13days on market $215,000 Active 4 DOM
-
2026-06-10days on market $215,000 Active 2 DOM
-
2026-06-08remarks 352-char remark
-
2026-06-08$215,000 Active 1 DOM
ⓘ Source: listings_history table (triggers on properties + properties_extension) + one-shot
backfill from property_details.listing_events for pre-trigger history.
Tax reassessment forecast NC · Resets to sale price
- Current annual tax
- $1,048 · $87/mo
- Projected year-2 tax
- $1,763 · $147/mo
- Expected delta
- +$715/yr (+$60/mo · 68.3%)
ⓘ Screening estimate from a state-policy table — verify with the county assessor before closing.
Climate risk First Street
- Flood 1/10 Low FEMA zone X (unshaded) · 0% chance over 30 yrs
- Wildfire 3/10 Moderate
- Heat 5/10 Major 7 d/yr ≥103°F today · 18 d/yr by 30 yrs out
- Wind 2/10 Low 100% chance of damaging wind over 30 yrs
- Air quality 2/10 Low 2 unhealthy d/yr today · 2 by 30 yrs out
Nearby sold comps map
Loading sold comps map…
Walkable amenities ~0.75 mi
Loading nearby amenities…
Taxation est. · year 1
- Rental income
- $21,065
- − Mortgage interest
- −$12,043
- − Property taxes
- −$1,048
- − Insurance
- −$1,075
- − Repairs & maintenance
- −$1,685
- − Management
- −$1,685
- − Depreciation
- −$6,255
- Taxable loss
- −$2,726
- Est. tax savings @ 24.0%
- +$654
- After-tax cash flow
- $1,643/yr
For passive investors: Depreciation is non-cash, so a rental often shows a tax loss while cash-flowing — sheltering income. Rental losses are passive: they offset passive income freely, and up to $25,000/yr can offset ordinary (W-2) income if you actively participate and your MAGI is under $100k (phasing out to $0 by $150k); unused losses carry forward. On sale, claimed depreciation is recaptured at up to 25%, and gains may owe capital-gains tax (a 1031 exchange can defer both). Figures are a year-1 estimate at your 24.0% rate — not tax advice; consult a CPA.
Schools (NCES district)
- District
- Burke County Schools
- NCES district ID
- 3700480
- Math proficiency
- 43% ▼ -2.00%
- Reading proficiency
- 47% ▬ 0.00%
- Median HH income
- $38,342
- Composite
- 37.51/100
- National rank
- #4400
- State rank
- #89 of 178 in NC
Livability — Morganton
- Score
- 69/100
- State rank
- #149
- US rank
- #8307
Category grades
Schools grade is shown separately in the Schools card above.
Census & demographics
- Census place
- Morganton, NC
- County
- Burke County · 55,100 people
- City population
- 55,100
- Metro
- Hickory-Lenoir-Morganton, NC
- Population (ZIP)
- 55,100
- Household income
- $57,713
- Rent vs Own
- Severe rent burden
- 1145.0
Population outlook (Burke County) Hauer SSP2
- Today (2025)
- 86,552 people
- By 2030
- 84,123 · -2.8%
- By 2040
- 78,165 · -9.7%
- By 2050
- 71,099 · -17.9%
- By 2075
- 56,264 · -35.0%
- By 2100
- 44,742 · -48.3%
Race, ethnicity, and origin ACS 2023
- Neighborhood character
- Predominantly White (75%)
- Race & ethnicity
- White 75% Hispanic / Latino 11% Black 8% Two or more races 5% Asian 3% Native American 2%
- Hispanic origin (detail)
- Mexican 3%
- Common ancestry
- Slovak 2% Italian 2% Serbian 2%
- Foreign-born
- 7% · Canada, China
- Languages at home
- 87% English-only · Spanish 8% Other Asian/Pacific 1% Arabic 1%
Political lean MEDSL · Burke
- 2024 margin
- Solid R (+41.2) · D 29.0% · R 70.3%
- 2008→2024 swing
- -22.0pp toward R · 2008: -19.2pp · 2024: -41.2pp
- All cycles
- 2024: R+41.2 2020: R+40.1 2016: R+39.4 2012: R+23.6 2008: R+19.2
Not yet ingested
- Civics
- —
Market trends
- HPI YoY
- ▼ -55.07%
- Current HPI
- 362.0732
- Rent YoY
- —
- Metro
- Hickory-Lenoir-Morganton, NC
- State GDP YoY
- ▲ 3.28%
- F500 in state
- 26
Industry mix (Fortune 500 HQ in NC)
| Industry | F500 HQs | Revenue |
|---|---|---|
| Financial Services | 2 | $213B |
|
||
| Retail | 2 | $95B |
|
||
| Industrial Conglomerate | 1 | $38B |
|
||
| Metals / Steel | 1 | $35B |
|
||
| Utilities | 1 | $30B |
|
||
| Industrial Machinery | 1 | $19B |
|
||
Price history
+170.4% since first listed2 events — show timeline
- 2026-06-07 Listed $215,000 CANOPYMLS as Distributed by MLS Grid
- 1998-08-28 Sold (Public Records) $79,500 Public Records
Property tax history
+2.8%/yrLatest (2025): $1,048 · -0.4% YoY. Source: county tax records.
Cash-flow waterfall
monthlySold comps — $/sqft
last 12 mo · ≤1 miLoading sold comps…