 Duplex
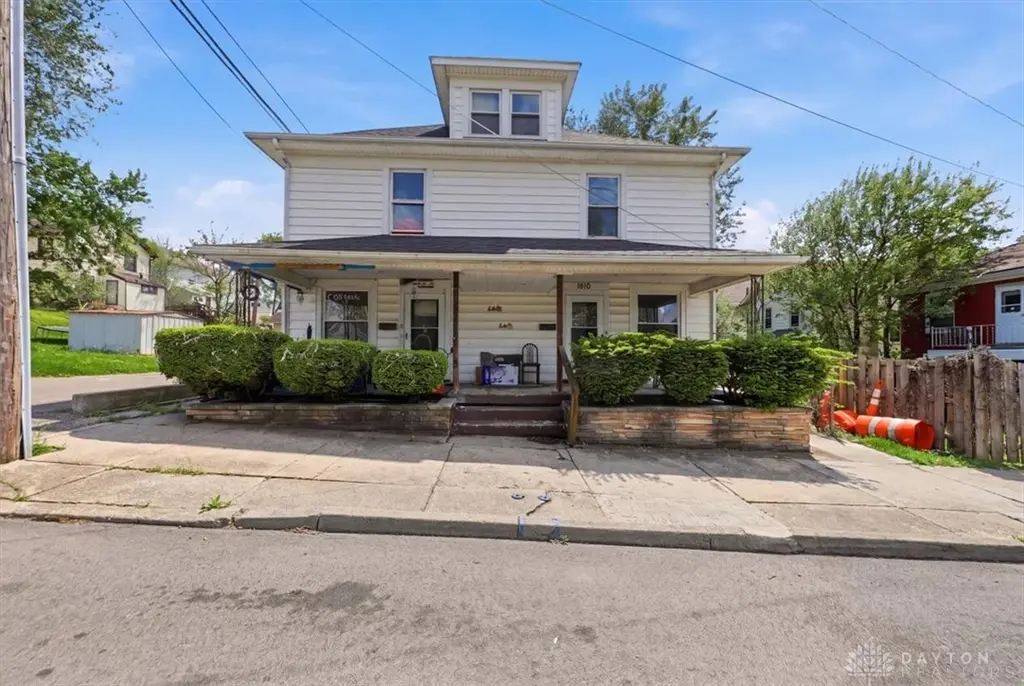
1012 Lorain Ave #1010 · Dayton, OH
Flood risk 7/10 · Major
- FEMA flood zone
- X (unshaded)
- Chance of flooding over 30 yrs
- 0.96%
- Est. flood insurance / yr
- $473 – $860
Fire risk 1/10 · Minimal
- Est. fire insurance / yr
- $713 – $1,323
Heat risk 4/10 · Minor
- Hot days now (above 101°F)
- 7 days/yr
- Hot days in 30 yrs
- 18 days/yr
Wind risk 2/10 · Minimal
- Chance of severe wind over 30 yrs
- 1.0%
Air-quality risk 3/10 · Minor
- Unhealthy air days now
- 2 days/yr
- Unhealthy air days in 30 yrs
- 4 days/yr
Risk factors via First Street. Map © Google.
Why this score? — see what drove the C grade
The composite is a weighted blend of 9 inputs, each scored 0–100. Each bar is that input's sub-score; the figure is the points it added to the 100-point composite (weight × sub-score).
- Cash flow +28.9/30.0
- DSCR +10.0/10.0
- 1% rule +8.0/10.0
- Rent growth +5.0/5.0
- Livability +3.2/5.0
- Condition / age +2.8/5.0
- Schools +1.3/10.0
- ARV discount +0.0/15.0
- Appreciation +0.0/10.0
$169,000
🖨 Deal sheet 📄 Offer letter ✓ Due diligence
Multi-family units
County records classify this as Multi-Family (2-4 Unit). Listing-text estimate: 2 units. confirmed
Listing remarks
Turnkey duplex in Dayton’s Linden Heights. Each unit offers 2 beds, 1 bath. Major updates include new roof, furnaces, water heaters, waterproofed basement with sump pump, and glass block windows. Unit 1010 features new upstairs flooring, fresh paint, updated kitchen counters/flooring, and new front/rear screen doors. Unit 1012 offers new flooring throughout, kitchen updates, and newer refrigerator. One unit leased at $750/month; other vacant. Tenants pay all utilities. Major capital improvements completed—minimal future maintenance expected and steady, reliable cash flow. Conveniently located near downtown, parks, and major roadways.
Key facts
- Sump pump
- New water heaters
- Glass block windows
Tags
Property features AI
Finance
- Financial info: Offered for sale; Lease amount listed at $750
Exterior
- Parking: 220-volt outlet in garage
- Utilities: 220 volts available in garage; Natural gas heating
- Home design: Two-story building; Aluminum siding construction
- Construction: Aluminum siding
- Exterior features: Multiple zoning designation; Assessor-listed lot dimensions
Interior
- Bedrooms: Four bedrooms or more; Property contains two units (multi-unit)
- Bathrooms: 2 full bathrooms
- Heating & cooling: Forced air heating (natural gas); Window air conditioning units
- Interior features: Finished partial basement
Neighborhood map
What this means for you Summary
Snapshot
- This is a 2 × 2-bed/1-bath units multifamily listed at $169k. Condition is rated average.
Deal economics
- At list price, monthly cash flow is $518 ($6k/yr) — positive. Per door: $259/mo.
- The deal already cash-flows at list — no discount required.
- Meets the 1% rule at list price ($2k rent vs $169k).
- Cap rate 10.4% vs local median 7.4% in Dayton — top-decile yield for the area; either an underpriced asset or a hidden risk that comps aren't pricing in. Stress-test before assuming the spread holds.
Location & tenants
- Location reads 65/100 on livability (#716 in OH) — a middle-class / working-renter tenant base. Strengths: cost of living A+, housing A+, health & safety A; Watch: schools C-, amenities C-, crime F.
- Dayton City (urban): math 12% / reading 21% proficiency, ranked #641 of 656 in OH (top 98%) — low school quality limits family demand, transient renter base, plan for 1-2y turnover; 74% free/reduced lunch — lower-income household profile, screen leases tightly.
- Market conditions: Rents rising fast (+11.4%/yr); 92 active listings in the ZIP; 21 comparable units currently listed for rent nearby; rentals at typical pace (median 14d on market — plan ~3-4 weeks tenant-placement turnaround); 907 units permitted in Montgomery County in 2024 (416 in 5+ unit buildings).
- At $2,204/mo this rent would consume 57% of the median local household income ($47k/yr) (locally 961% of renters already pay >50% of income on rent) — very limited rent-growth headroom before tenants either downsize or default.
Forward outlook
- Local home prices are declining (-3.0%/yr); year-one equity from $1k of loan paydown is wiped out by about $5k of value loss. Plan a longer hold.
- Montgomery County population projected at -10% by 2050 — secular population decline; favor cash flow + early exit over multi-decade hold.
- At projected returns (-3.0% appreciation + 8.0% rent growth), your $47k cash investment doubles in ~7 years — after that, you're playing with house money.
Negotiation context
- Only 10 days on market — expect competitive offers; lowballing is unlikely to land.
Risks & watch-outs
- Watch-outs: flood insurance adds $56/mo; built in 1914 — expect roof / HVAC / electrical / plumbing capex.
- Climate carrying-cost: major flood risk — expect insurance premiums to compound above CPI over the hold.
Questions for the listing agent
- Can we see the unit-by-unit rent roll, current vacancy, and any below-market leases? What's the average tenancy length?
- What capital expenditures (roof, boiler, parking lot, exteriors) have been made in the last 5 years, and what's planned in the next 2?
- Built in 1914 — when were the roof, HVAC, electrical panel, plumbing, and water heater last replaced?
- What's the actual annual flood-insurance premium (NFIP or private), and is the property in a SFHA with mandatory coverage?
- Is there a deadline driving the sale (1031 exchange, divorce, estate, relocation)? That informs how much negotiation room exists.
- Crime grade is F in this area — have there been break-ins, vandalism, or insurance claims at this property in the last 3 years? What carrier currently insures it and at what premium?
- What's the average days-on-market for RENTAL listings here right now (not sales)? A rising rental-DOM trend means longer vacancies and softer asking-rent achievability than the comps imply.
- What's the recent tenant-quality profile in this submarket — average credit score on applications, eviction rate, late-payment / NSF rate, and stable-employment percentage? A property-management company in the area should have these aggregated.
- How much new apartment / multifamily construction is in the pipeline within 1–3 miles? Heavy new supply (>2% of stock underway) typically softens rents 12–24 months out; light construction supports rent growth.
Investment metrics
- 1% rule
- 1.30% ✓
- Cap rate
- 10.36%
- Cash-on-cash
- 14.54%
- DSCR
- 1.65
- GRM
- 6.4
CMA / ARV
- ARV (median comp)
- $141,209
- List price
- $169,000
- Delta
- 19.68%
- Verdict
- OVERPRICED
- Comps
- 20 within 1.0 mi
Show comp detail 11 sales within ~0.75 mi
| Address | Dist | Beds/Ba | Sqft | Sold | Price | $/sf | Match |
|---|---|---|---|---|---|---|---|
| 1012 Lorain Ave #1010 | 0.00mi | 4/2.0 | 2,112 (0%) | 16mo | $157,500 | $75 | 87 |
| 416 Pleasant Ave | 0.63mi | 4/2.0 | 2,184 (+3%) | 3mo | $125,000 | $57 | 62 |
| 2821 E 5th St #2819 | 0.69mi | 4/2.0 | 2,128 (+1%) | 7mo | $157,000 | $74 | 60 |
| 635 Pritz Ave #633 | 0.20mi | 4/2.0 | 2,356 (+12%) | 14mo | $125,000 | $53 | 60 |
| 533 Saint Joseph Ave | 0.33mi | 4/4.0 | 2,160 (+2%) | 19mo | $250,000 | $116 | 57 |
| 624-626 Pritz Ave | 0.17mi | 4/2.0 | 1,904 (-10%) | 23mo | $65,000 | $34 | 56 |
| 423 Hulbert St #421 | 0.47mi | 4/2.0 | 2,012 (-5%) | 20mo | $159,900 | $79 | 54 |
| 48 Indiana Ave | 0.59mi | 4/2.0 | 1,924 (-9%) | 11mo | $145,000 | $75 | 48 |
| 1104 Huffman Ave | 0.47mi | 3/2.0 (-1) | 1,964 (-7%) | 23mo | $138,000 | $70 | 42 |
| 1314 Phillips Ave #1312 | 0.70mi | 4/2.0 | 2,352 (+11%) | 15mo | $189,900 | $81 | 35 |
| 424-426 Boltin St | 0.52mi | 5/— (+1) | 1,806 (-14%) | 19mo | $120,000 | $66 | 31 |
Match score weights: distance 35% · size 25% · config 20% · recency 20%. Top-matched comps best support the ARV.
Projected returns pro-forma
-3.0% appreciation · 8.0% rent growth · sell at horizon
- IRR
- 8.8%
- Equity multiple
- 1.37×
- Total profit
- $17,302
- Equity at exit
- $25,198
- IRR
- 22.0%
- Equity multiple
- 3.34×
- Total profit
- $110,811
- Equity at exit
- $14,612
Cash invested: $47,320 (down + closing). Projections, not guarantees.
Landlord ↔ Tenant lean methodology
- Overall (STATE)
- 73 Landlord-Friendly
- State Ohio
- 73 Landlord-Friendly · R+6
- County
- — inherits STATE
- City
- — inherits STATE
ZIP-level market 45410
- Home prices YoY
- -21.4%
- Rents YoY
- 11.4%
- Active inventory
- 92
- Price-to-rent
- 12.8×
Monthly cashflow live
- Estimated rent
- $2,204 high interval (Pro) →
- Mortgage (P&I)
- −$886
- Tax est. 1.5%
- −$211 /mo · $2,535/yr
- Insurance
- −$70
- Flood insurance flood zone
- −$56 /mo · $666/yr
- HOA
- −$0
- Vacancy / Maint / Mgmt
- −$463
- Net cashflow
- $518
Break-even live
2-unit breakdown (identical units grouped — click to expand)
| Units | Beds | Baths | Est. rent |
|---|---|---|---|
| 2× units | 2 | 1 | $2,204 |
| #1 | 2 | 1 | $1,102 |
| #2 | 2 | 1 | $1,102 |
| Total (2 units) | $2,204 | ||
UW: 25.0% down · 7.5% · 30yr · 1.5% tax · 5.0% vac · 8.0% maint · 8.0% mgmt
Financing live
Cash to close
- Down payment
- $42,250
- Closing costs
- $5,070
- Reserves months
- —
- Total cash needed
- —
Loan-product check · same deal, 3 products live
Conventional
25% down · 7.5% · 30yr
- Down + closing
- —
- Monthly P&I
- —
- Monthly cashflow
- —
- DSCR
- —
- Eligible?
- —
Personal DTI + credit; lowest rate.
DSCR
20% down · 8.5% · 30yr
- Down + closing
- —
- Monthly P&I
- —
- Monthly cashflow
- —
- DSCR
- —
- Eligible?
- —
No personal income docs; deal must DSCR.
Hard money
10% down · 12.0% · 12mo
- Down + closing
- —
- Monthly P&I
- —
- Monthly cashflow
- —
- DSCR
- —
- Eligible?
- —
Short-term bridge; refi at stabilization.
Rent comps 21 comps
| Address | Beds | Baths | Sqft | Rent | $/sqft | DOM | Units | Dist |
|---|---|---|---|---|---|---|---|---|
| 511 Parrot St Dayton, OH | 3.0 | 1.5 | 1618 | $1,100 | $0.68 | 14d | 1 | 0.37mi |
| 836 Wellmeier Ave Dayton, OH | 4.0 | 1.0 | 2148 | $1,500 | $0.70 | 3d | 1 | 0.39mi |
| 115 Livingston Ave Dayton, OH | 3.0 | 1.0 | 1624 | $1,450 | $0.89 | 44d | 1 | 0.41mi |
| 1515 Wyoming St Dayton, OH | 3.0 | 1.0 | 1400 | $1,000 | $0.71 | 43d | 1 | 0.44mi |
| 438 Clover St Dayton, OH | 3.0 | 2.0 | 2156 | $1,025 | $0.48 | 43d | 1 | 0.82mi |
| 1520 S Smithville Rd Dayton, OH | 3.0 | 2.0 | 1481 | $1,345 | $0.91 | 2d | 1 | 0.88mi |
| 32 Gebhart St Dayton, OH | 4.0 | 1.0 | 1800 | $1,400 | $0.78 | 14d | 1 | 0.88mi |
| 2114 Wayne Ave Dayton, OH | 4.0 | 2.0 | 1723 | $1,595 | $0.93 | 43d | 1 | 0.94mi |
| 2132 Wayne Ave Dayton, OH | 3.0 | 2.0 | 1484 | $1,350 | $0.91 | 2d | 1 | 0.94mi |
| 1603 Manette Pl Dayton, OH | 4.0 | 2.0 | 2000 | $1,695 | $0.85 | 14d | 1 | 1.03mi |
| 244 Quitman St Unit A Dayton, OH | 3.0 | 1.0 | 1987 | $1,325 | $0.67 | 23d | 1 | 1.07mi |
| 534 Beckman St Dayton, OH | 3.0 | 2.0 | 1452 | $1,400 | $0.96 | 2d | 1 | 1.13mi |
| 3707 E 3rd St Unit 3705 Dayton, OH | 3.0 | 1.0 | 1410 | $1,045 | $0.74 | 23d | 1 | 1.16mi |
| 320 Park Dr Dayton, OH | 4.0 | 3.0 | 2100 | $2,400 | $1.14 | 14d | 1 | 1.17mi |
| 228 James St Dayton, OH | 3.0 | 1.0 | 1700 | $1,200 | $0.71 | 43d | 1 | 1.26mi |
| 227 James St Unit 1 Dayton, OH | 3.0 | 1.0 | 1700 | $1,200 | $0.71 | 3d | 1 | 1.27mi |
| 229 James St Unit 228 Dayton, OH | 3.0 | 1.0 | 1700 | $1,200 | $0.71 | 23d | 1 | 1.27mi |
| 4249 Pleasant View Ave Dayton, OH | 3.0 | 2.0 | 1440 | $1,695 | $1.18 | 43d | 1 | 1.35mi |
| 4253 Pleasant View Ave Dayton, OH | 3.0 | 2.0 | 1440 | $1,695 | $1.18 | 43d | 1 | 1.36mi |
| 319 Wyoming St Dayton, OH | 4.0 | 2.5 | 2064 | $2,000 | $0.97 | 2d | 1 | 1.44mi |
| 1112 Irving Ave Dayton, OH | 3.0 | 4.0 | 2041 | $4,500 | $2.20 | 3d | 1 | 1.45mi |
Listing history 2 events
-
2026-05-14status Pending 653-char remark
-
2026-05-04$169,000 Active 653-char remark
ⓘ Source: listings_history table (triggers on properties + properties_extension) + one-shot
backfill from property_details.listing_events for pre-trigger history.
Climate risk First Street
- Flood 7/10 Severe FEMA zone X (unshaded) · 96% chance over 30 yrs
- Wildfire 1/10 Low
- Heat 4/10 Moderate 7 d/yr ≥101°F today · 18 d/yr by 30 yrs out
- Wind 2/10 Low 100% chance of damaging wind over 30 yrs
- Air quality 3/10 Moderate 2 unhealthy d/yr today · 4 by 30 yrs out
Nearby sold comps map
Loading sold comps map…
Walkable amenities ~0.75 mi
Loading nearby amenities…
Taxation est. · year 1
- Rental income
- $26,448
- − Mortgage interest
- −$9,467
- − Property taxes
- −$2,535
- − Insurance
- −$1,512
- − Repairs & maintenance
- −$2,116
- − Management
- −$2,116
- − Depreciation
- −$4,916
- Taxable income
- $3,787
- Est. tax owed @ 24.0%
- −$909
- After-tax cash flow
- $5,304/yr
For passive investors: Depreciation is non-cash, so a rental often shows a tax loss while cash-flowing — sheltering income. Rental losses are passive: they offset passive income freely, and up to $25,000/yr can offset ordinary (W-2) income if you actively participate and your MAGI is under $100k (phasing out to $0 by $150k); unused losses carry forward. On sale, claimed depreciation is recaptured at up to 25%, and gains may owe capital-gains tax (a 1031 exchange can defer both). Figures are a year-1 estimate at your 24.0% rate — not tax advice; consult a CPA.
Condition & rehab AI · 30 photos
This two-unit property requires moderate renovations to its kitchens and bathrooms, as well as exterior updates. The property is currently turnkey and has steady cash flow, making it a good investment opportunity.
Repairs flagged
- Major Kitchen cabinets — Worn and outdated, need replacement.
- Major Kitchen countertops — Old and outdated, need replacement.
- Major Kitchen appliances — Old and outdated, need replacement.
- Major Bathroom fixtures — Old and outdated, need replacement.
- Major Bathroom decor — Dated and worn, needs updating.
- Moderate Exterior siding — Weathered and some discoloration, needs repainting.
- Moderate Exterior paint — Old and some wear, needs repainting.
- Minor Landscaping — Some overgrown areas, needs trimming and planting.
- Minor Front/rear screen doors — Old and worn, needs replacement or repair.
Value-add opportunities
- Both Kitchen renovation — Modernizing the kitchen will increase both resale and rental value.
- Both Bathroom renovation — Updating the bathrooms will increase both resale and rental value.
- Both Exterior painting and landscaping — A fresh coat of paint and landscaping will improve curb appeal and increase both resale and rental value.
- Rental HVAC maintenance — A well-maintained HVAC system will attract tenants and increase rental value.
Renovation cost estimate screening
| Repair item | Severity | Est. cost |
|---|---|---|
| Kitchen cabinets · Worn and outdated, need replacement. | Major | $15,000–50,000 |
| Kitchen countertops · Old and outdated, need replacement. | Major | $15,000–50,000 |
| Kitchen appliances · Old and outdated, need replacement. | Major | $15,000–50,000 |
| Bathroom fixtures · Old and outdated, need replacement. | Major | $15,000–50,000 |
| Bathroom decor · Dated and worn, needs updating. | Major | $15,000–50,000 |
| Exterior siding · Weathered and some discoloration, needs repainting. | Moderate | $3,000–15,000 |
| Exterior paint · Old and some wear, needs repainting. | Moderate | $3,000–15,000 |
| Landscaping · Some overgrown areas, needs trimming and planting. | Minor | $500–3,000 |
| Front/rear screen doors · Old and worn, needs replacement or repair. | Minor | $500–3,000 |
| Total estimated repair cost · 9 items | $82,000–286,000 |
Value-add ROI direction
- Both Kitchen renovation — Modernizing the kitchen will increase both resale and rental value. ↑
- Both Bathroom renovation — Updating the bathrooms will increase both resale and rental value. ↑
- Both Exterior painting and landscaping — A fresh coat of paint and landscaping will improve curb appeal and increase both resale and rental value. ↑
- Rental HVAC maintenance — A well-maintained HVAC system will attract tenants and increase rental value. ↑
ⓘ Cost ranges are severity-bucket heuristics (US national rule-of-thumb). Get contractor quotes + a written scope before underwriting a rehab budget.
Schools (NCES district)
- District
- Dayton City
- NCES district ID
- 3904384
- Math proficiency
- 12% ▼ -12.00%
- Reading proficiency
- 21% ▼ -11.00%
- Median HH income
- $28,688
- Composite
- 12.94/100
- National rank
- #9579
- State rank
- #641 of 656 in OH
Livability — Dayton
- Score
- 65/100
- State rank
- #716
- US rank
- #12895
Category grades
Schools grade is shown separately in the Schools card above.
Census & demographics
- Census place
- Dayton, OH
- County
- Montgomery County · 459,541 people
- City population
- 164,387
- Metro
- Dayton-Kettering, OH
- Population (ZIP)
- 14,694
- Household income
- $46,651
- Rent vs Own
- Severe rent burden
- 961.0
Population outlook (Montgomery County) Hauer SSP2
- Today (2025)
- 523,241 people
- By 2030
- 514,948 · -1.6%
- By 2040
- 493,378 · -5.7%
- By 2050
- 469,639 · -10.2%
- By 2075
- 418,360 · -20.0%
- By 2100
- 353,315 · -32.5%
Race, ethnicity, and origin ACS 2023
- Neighborhood character
- Predominantly White (71%)
- Race & ethnicity
- White 71% Black 15% Hispanic / Latino 7% Two or more races 6% Asian 1%
- Hispanic origin (detail)
- Mexican 3%
- Common ancestry
- Lithuanian 2% Iranian 2% Slovak 2%
- Foreign-born
- 5% · Canada, United Kingdom
- Languages at home
- 91% English-only · Spanish 6% Tagalog/Filipino 1% Other Asian/Pacific 1%
Political lean MEDSL · Montgomery
- 2024 margin
- Toss-up / Even · D 49.8% · R 49.3%
- 2008→2024 swing
- -5.8pp toward R · 2008: 6.2pp · 2024: 0.5pp
- All cycles
- 2024: D+0.5 2020: D+2.2 2016: R+1.2 2012: D+3.1 2008: D+6.2
Not yet ingested
- Civics
- —
Market trends
- HPI YoY
- ▼ -100.61%
- Current HPI
- 369.3938
- Rent YoY
- ▲ 11.37%
- Metro
- Dayton-Kettering, OH
- State GDP YoY
- ▲ 1.98%
- F500 in state
- 48
Industry mix (Fortune 500 HQ in OH)
| Industry | F500 HQs | Revenue |
|---|---|---|
| Insurance | 3 | $145B |
|
||
| Industrial Machinery | 3 | $49B |
|
||
| Financial Services | 3 | $24B |
|
||
| Consumer Goods | 2 | $93B |
|
||
| Aerospace / Defense | 2 | $47B |
|
||
| Utilities | 2 | $33B |
|
||
Price history
2 events — show timeline
- 2026-05-14 Pending — Dayton MLS
- 2026-05-04 Listed $169,000 Dayton MLS
Cash-flow waterfall
monthlySold comps — $/sqft
last 12 mo · ≤1 miLoading sold comps…