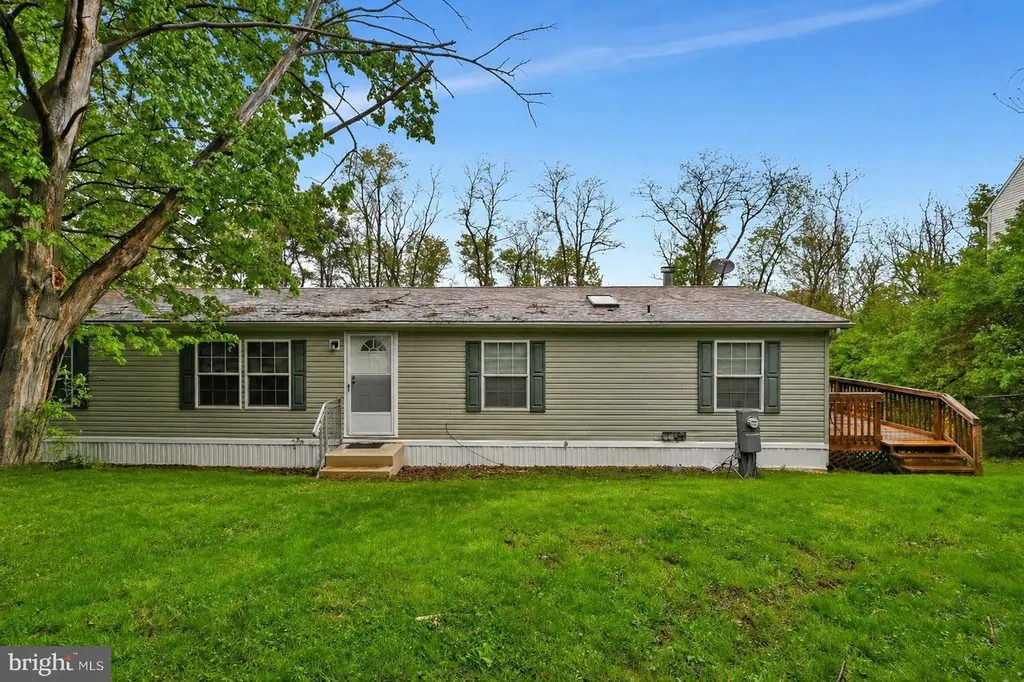
902 Ivy Ln · Ephrata, PA
Flood risk 1/10 · Minimal
- FEMA flood zone
- X (unshaded)
- Chance of flooding over 30 yrs
- 0.0%
- Est. flood insurance / yr
- $507 – $1,088
Fire risk 1/10 · Minimal
- Est. fire insurance / yr
- $511 – $949
Heat risk 5/10 · Moderate
- Hot days now (above 100°F)
- 7 days/yr
- Hot days in 30 yrs
- 15 days/yr
Wind risk 4/10 · Minor
- Chance of severe wind over 30 yrs
- 17.0%
Air-quality risk 4/10 · Minor
- Unhealthy air days now
- 6 days/yr
- Unhealthy air days in 30 yrs
- 7 days/yr
Risk factors via First Street. Map © Google.
Why this score? — see what drove the B grade
The composite is a weighted blend of 9 inputs, each scored 0–100. Each bar is that input's sub-score; the figure is the points it added to the 100-point composite (weight × sub-score).
- Cash flow +30.0/30.0
- DSCR +10.0/10.0
- 1% rule +9.5/10.0
- ARV discount +7.5/15.0
- Schools +4.3/10.0
- Livability +4.0/5.0
- Rent growth +3.0/5.0
- Condition / age +2.5/5.0
- Appreciation +0.0/10.0
$130,000
🖨 Deal sheet 📄 Offer letter ✓ Due diligence
Listing remarks
Welcome to 902 Ivy Lane in Ephrata - offering easy, low-maintenance living in a convenient location. Step inside to find a bright and comfortable living space that flows into the kitchen and dining area, creating a layout that feels both functional and welcoming. The kitchen offers ample cabinetry and workspace, making everyday living and entertaining simple and efficient. This home features 3 bedrooms and 2 full bathrooms, providing flexibility for guests, a home office, or additional living space. Each room is filled with natural light and designed for comfort. Enjoy your morning coffee or unwind in the evening outdoors, with space to relax and take in the peaceful surroundings. Located
Key facts
- Bright living space
- Ample cabinetry
- Natural light
Tags
Property features AI
Finance
- Financial info: Annual ground rent (listed as an income/expense item)
Exterior
- Parking: Off-street parking via driveway
- Utilities: Public water; Public sewer; Cable available; Electric service available; Propane available
- Home design: Manufactured structure; Above-grade finished living area recorded by assessor
- Construction: Frame construction with vinyl siding; Other structures above and below grade
- Exterior features: Ground rent exists (paid annually); Not in a federal flood zone; Property managed by a property manager; Directions: From 272, right on Parkview, left on Wisteria, right on Primrose, left on Ivy
Interior
- Bedrooms: 3 bedrooms on the main level
- Bathrooms: 2 full bathrooms (both on the main level)
- Heating & cooling: Forced air heating; Propane (leased) heating fuel; Central air conditioning (electric); Electric hot water
- Interior features: Assessor provided living area information; Has fireplace (1)
Neighborhood map
What this means for you Summary
Snapshot
- This is a 3-bed/2.0-bath manufactured listed at $130k.
Deal economics
- At list price, monthly cash flow is $649 ($8k/yr) — positive.
- The deal already cash-flows at list — no discount required.
- Meets the 1% rule at list price ($2k rent vs $130k).
- Recommended offer: $126k (3.0% below list) — sets the bar for market timing.
- Cap rate 12.3% vs local median 2.5% in Ephrata — top-decile yield for the area; either an underpriced asset or a hidden risk that comps aren't pricing in. Stress-test before assuming the spread holds.
Location & tenants
- Location reads 81/100 on livability (#175 in PA, #1,451 nationally) — a professional / high-income tenant draw. Strengths: crime A+, cost of living A+, housing A+; Watch: commute F.
- Ephrata Area SD (suburban): math 43% / reading 57% proficiency, ranked #173 of 539 in PA (top 32%) — acceptable for families but not a draw, mixed tenant base, ~2y average lease.
- Market conditions: Rents rising (+1.8%/yr); 115 active listings in the ZIP; 3 comparable units currently listed for rent nearby; rentals leasing fast (median 14d on market — plan ~1-2 weeks tenant-placement turnaround); 1,093 units permitted in Lancaster County in 2024 (201 in 5+ unit buildings).
- This rent runs 30% of the median local income ($75k/yr) — at the standard rent-burdened threshold; future hikes will face affordability resistance.
Forward outlook
- Local home prices are declining (-3.0%/yr); year-one equity from $899 of loan paydown is wiped out by about $4k of value loss. Plan a longer hold.
- Lancaster County population projected at +5% by 2050 — modest demand growth; plan on rents tracking national, not racing it.
- At projected returns (-3.0% appreciation + 1.8% rent growth), your $36k cash investment doubles in ~7 years — after that, you're playing with house money.
Negotiation context
- It's been on market 51 days — a 3% lower offer ($126k) is reasonable based on typical stale-listing flexibility.
Risks & watch-outs
- Climate carrying-cost: extreme-heat days projected 7→15/yr by 2055 (HVAC capex compounding) — expect insurance premiums to compound above CPI over the hold.
Questions for the listing agent
- It's been on market 51 days. Have you received any prior offers? Is the seller open to a 3% concession, seller financing, or rate buy-down credit?
- Is there a deadline driving the sale (1031 exchange, divorce, estate, relocation)? That informs how much negotiation room exists.
- Schools are B-rated — typically a magnet for longer-tenancy family renters. What's the average tenant stay here, and is there a school-zone premium baked into asking?
- What's the average days-on-market for RENTAL listings here right now (not sales)? A rising rental-DOM trend means longer vacancies and softer asking-rent achievability than the comps imply.
- What's the recent tenant-quality profile in this submarket — average credit score on applications, eviction rate, late-payment / NSF rate, and stable-employment percentage? A property-management company in the area should have these aggregated.
- How much new for-sale + rental construction is in the pipeline within 1–3 miles? Heavy new supply typically softens prices + rents 12–24 months out; constrained supply supports both.
Investment metrics
- 1% rule
- 1.45% ✓
- Cap rate
- 12.29%
- Cash-on-cash
- 21.41%
- DSCR
- 1.95
- GRM
- 5.8
CMA / ARV
- ARV (median comp)
- $324,878
- List price
- $130,000
- Delta
- -59.99%
- Verdict
- UNDERPRICED
- Comps
- 20 within 1.0 mi
Projected returns pro-forma
-3.0% appreciation · 1.83% rent growth · sell at horizon
- IRR
- 12.7%
- Equity multiple
- 1.50×
- Total profit
- $18,095
- Equity at exit
- $19,383
- IRR
- 20.7%
- Equity multiple
- 2.65×
- Total profit
- $60,197
- Equity at exit
- $11,240
Cash invested: $36,400 (down + closing). Projections, not guarantees.
Landlord ↔ Tenant lean methodology
- Overall (STATE)
- 62 Landlord-Friendly
- State Pennsylvania
- 62 Landlord-Friendly · EVEN
- County
- — inherits STATE
- City
- — inherits STATE
ZIP-level market 17522
- Rents YoY
- 1.8%
- Active inventory
- 115
- Price-to-rent
- 5.8×
Monthly cashflow live
- Estimated rent
- $1,884 medium interval (Pro) →
- Mortgage (P&I)
- −$682
- Tax from tax record
- −$103 /mo · $1,236/yr
- Insurance
- −$54
- HOA
- −$0
- Vacancy / Maint / Mgmt
- −$396
- Net cashflow
- $649
Break-even live
UW: 25.0% down · 7.5% · 30yr · 1.5% tax · 5.0% vac · 8.0% maint · 8.0% mgmt
Financing live
Cash to close
- Down payment
- $32,500
- Closing costs
- $3,900
- Reserves months
- —
- Total cash needed
- —
Loan-product check · same deal, 3 products live
Conventional
25% down · 7.5% · 30yr
- Down + closing
- —
- Monthly P&I
- —
- Monthly cashflow
- —
- DSCR
- —
- Eligible?
- —
Personal DTI + credit; lowest rate.
DSCR
20% down · 8.5% · 30yr
- Down + closing
- —
- Monthly P&I
- —
- Monthly cashflow
- —
- DSCR
- —
- Eligible?
- —
No personal income docs; deal must DSCR.
Hard money
10% down · 12.0% · 12mo
- Down + closing
- —
- Monthly P&I
- —
- Monthly cashflow
- —
- DSCR
- —
- Eligible?
- —
Short-term bridge; refi at stabilization.
Rent comps 3 comps
| Address | Beds | Baths | Sqft | Rent | $/sqft | DOM | Units | Dist |
|---|---|---|---|---|---|---|---|---|
| 46 E Main St Apt 4 Ephrata, PA | 2.0 | 1.0 | 1100 | $1,150 | $1.05 | 43d | 1 | 0.89mi |
| 17 N 5th St Akron, PA | 3.0 | 2.5 | 1890 | $3,150 | $1.67 | 13d | 1 | 1.25mi |
| 217 S 9th St Akron, PA | 3.0 | 1.5 | 1176 | $1,495 | $1.27 | 13d | 1 | 1.43mi |
Listing history 15 events
-
2026-06-18days on market $130,000 Active 51 DOM
-
2026-06-17days on market $130,000 Active 50 DOM
-
2026-06-16days on market $130,000 Active 49 DOM
-
2026-06-15days on market $130,000 Active 48 DOM
-
2026-06-14days on market $130,000 Active 46 DOM
-
2026-06-10days on market $130,000 Active 43 DOM
-
2026-06-09days on market $130,000 Active 42 DOM
-
2026-06-08days on market $130,000 Active 41 DOM
-
2026-06-07days on market $130,000 Active 40 DOM
-
2026-06-03days on market $130,000 Active 36 DOM
-
2026-06-02days on market $130,000 Active 35 DOM
-
2026-06-01days on market $130,000 Active 34 DOM
-
2026-05-31days on market $130,000 Active 33 DOM
-
2026-05-30days on market $130,000 Active 32 DOM
-
2026-04-28$150,000 Active 907-char remark
ⓘ Source: listings_history table (triggers on properties + properties_extension) + one-shot
backfill from property_details.listing_events for pre-trigger history.
Tax reassessment forecast PA · Partial reset (capped growth)
- Current annual tax
- $1,236 · $103/mo
- Projected year-2 tax
- $1,645 · $137/mo
- Expected delta
- +$409/yr (+$34/mo · 33.1%)
ⓘ Screening estimate from a state-policy table — verify with the county assessor before closing.
Climate risk First Street
- Flood 1/10 Low FEMA zone X (unshaded) · 0% chance over 30 yrs
- Wildfire 1/10 Low
- Heat 5/10 Major 7 d/yr ≥100°F today · 15 d/yr by 30 yrs out
- Wind 4/10 Moderate 17% chance of damaging wind over 30 yrs
- Air quality 4/10 Moderate 6 unhealthy d/yr today · 7 by 30 yrs out
Nearby sold comps map
Loading sold comps map…
Walkable amenities ~0.75 mi
Loading nearby amenities…
Taxation est. · year 1
- Rental income
- $22,607
- − Mortgage interest
- −$7,282
- − Property taxes
- −$1,236
- − Insurance
- −$650
- − Repairs & maintenance
- −$1,809
- − Management
- −$1,809
- − Depreciation
- −$3,782
- Taxable income
- $6,040
- Est. tax owed @ 24.0%
- −$1,450
- After-tax cash flow
- $6,343/yr
For passive investors: Depreciation is non-cash, so a rental often shows a tax loss while cash-flowing — sheltering income. Rental losses are passive: they offset passive income freely, and up to $25,000/yr can offset ordinary (W-2) income if you actively participate and your MAGI is under $100k (phasing out to $0 by $150k); unused losses carry forward. On sale, claimed depreciation is recaptured at up to 25%, and gains may owe capital-gains tax (a 1031 exchange can defer both). Figures are a year-1 estimate at your 24.0% rate — not tax advice; consult a CPA.
Schools (NCES district)
- District
- Ephrata Area SD
- NCES district ID
- 4209270
- Math proficiency
- 43% ▼ -10.00%
- Reading proficiency
- 57% ▼ -9.00%
- Median HH income
- $54,320
- Composite
- 43.14/100
- National rank
- #3078
- State rank
- #173 of 539 in PA
Livability — Ephrata
- Score
- 81/100
- State rank
- #175
- US rank
- #1451
Category grades
Schools grade is shown separately in the Schools card above.
Census & demographics
- County
- Lancaster County · 390,309 people
- City population
- 33,852
- Metro
- Lancaster, PA
- Population (ZIP)
- 33,852
- Household income
- $74,828
- Rent vs Own
- Severe rent burden
- 856.0
Population outlook (Lancaster County) Hauer SSP2
- Today (2025)
- 561,011 people
- By 2030
- 570,969 · +1.8%
- By 2040
- 585,929 · +4.4%
- By 2050
- 591,056 · +5.4%
- By 2075
- 594,747 · +6.0%
- By 2100
- 558,850 · -0.4%
Race, ethnicity, and origin ACS 2023
- Neighborhood character
- Predominantly White (87%)
- Race & ethnicity
- White 87% Hispanic / Latino 7% Two or more races 5% Black 2%
- Hispanic origin (detail)
- Puerto Rican 3%
- Common ancestry
- Romanian 2% Scotch-Irish 2% Slovak 2%
- Foreign-born
- 4% · Canada, Jamaica
- Languages at home
- 88% English-only · German/W. Germanic 4% Spanish 4% Russian/Polish/Slavic 2%
Political lean MEDSL · Lancaster
- 2024 margin
- R (+15.9) · D 41.5% · R 57.5%
- 2008→2024 swing
- -4.1pp toward R · 2008: -11.8pp · 2024: -15.9pp
- All cycles
- 2024: R+15.9 2020: R+15.8 2016: R+19.7 2012: R+19.2 2008: R+11.8
Not yet ingested
- Civics
- —
Market trends
- HPI YoY
- ▼ -199.30%
- Current HPI
- 269.6157
- Rent YoY
- ▲ 1.83%
- Metro
- Lancaster, PA
- State GDP YoY
- ▲ 1.68%
- F500 in state
- 34
Industry mix (Fortune 500 HQ in PA)
| Industry | F500 HQs | Revenue |
|---|---|---|
| Healthcare | 2 | $309B |
|
||
| Insurance | 2 | $27B |
|
||
| Telecommunications / Media | 1 | $124B |
|
||
| Industrial Distribution | 1 | $22B |
|
||
| Financial Services | 1 | $20B |
|
||
| Chemicals / Materials | 1 | $18B |
|
||
Price history
-13.3% since first listed2 events — show timeline
- 2026-05-20 Price Changed $130,000 BRIGHT MLS
- 2026-04-28 Listed $150,000 BRIGHT MLS
Property tax history
-0.7%/yrLatest (2026): $1,236 · +3.9% YoY. Source: county tax records.
Cash-flow waterfall
monthlySold comps — $/sqft
last 12 mo · ≤1 miLoading sold comps…