6960 W Peoria Ave #185 · Peoria, AZ
Flood risk 1/10 · Minimal
- FEMA flood zone
- X (shaded)
- Chance of flooding over 30 yrs
- 0.0%
- Est. flood insurance / yr
- $507 – $1,088
Fire risk 1/10 · Minimal
- Est. fire insurance / yr
- $610 – $1,132
Heat risk 9/10 · Severe
- Hot days now (above 112°F)
- 6 days/yr
- Hot days in 30 yrs
- 16 days/yr
Wind risk 1/10 · Minimal
- Chance of severe wind over 30 yrs
- —
Air-quality risk 3/10 · Minor
- Unhealthy air days now
- 3 days/yr
- Unhealthy air days in 30 yrs
- 3 days/yr
Risk factors via First Street. Map © Google.
Why this score? — see what drove the C- grade
The composite is a weighted blend of 9 inputs, each scored 0–100. Each bar is that input's sub-score; the figure is the points it added to the 100-point composite (weight × sub-score).
- Cash flow +15.0/30.0
- ARV discount +15.0/15.0
- 1% rule +5.0/10.0
- DSCR +5.0/10.0
- Livability +3.8/5.0
- Schools +3.5/10.0
- Rent growth +2.7/5.0
- Condition / age +2.5/5.0
- Appreciation +0.0/10.0
$38,000
🖨 Deal sheet (PDF) 📄 Offer letter ✓ Due diligence
Listing remarks MLS
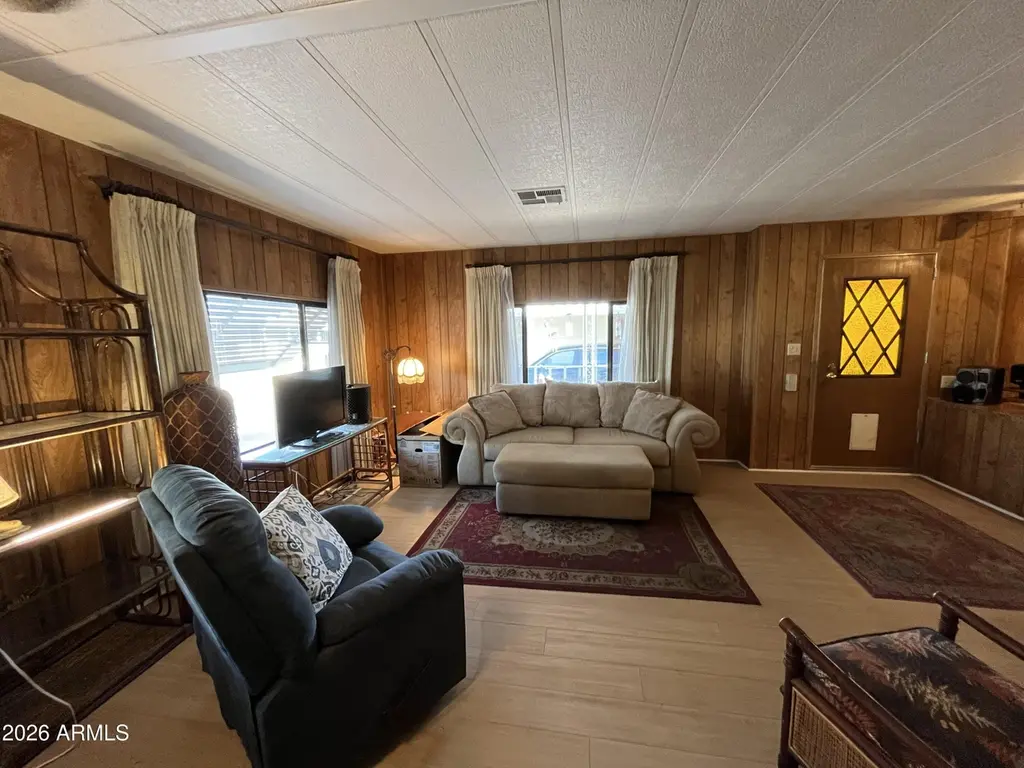
PRICED TO SELL!!! This Cozy 2B/2B home Is located In a 55+Community with pool, Fitness Center, Clubhouse,Game Room, Library and many activities! With NEW FLOORING,Screened In Patio,Large Storage Shed and Spacious Family room for entertaining, as well as Accessibility thoughtfully designed with a full entry ramp from the carport. DON'T MISS OUT ON THIS GREAT OPPORTUNITY!
Key facts
- Fitness center
- Clubhouse
- New flooring
Tags
Neighborhood map
What this means for you Summary
Snapshot
- This is a 2-bed/2.0-bath manufactured listed at $38k.
Deal economics
- At list price, monthly cash flow is $1k ($15k/yr) — positive.
- The deal already cash-flows at list — no discount required.
- Meets the 1% rule at list price ($2k rent vs $38k).
- Recommended offer: $37k (3.0% below list) — sets the bar for market timing.
- Cap rate 45.9% vs local median 3.3% in Peoria — top-decile yield for the area; either an underpriced asset or a hidden risk that comps aren't pricing in. Stress-test before assuming the spread holds.
Location & tenants
- Location reads 76/100 on livability (#14 in AZ, #3,603 nationally) — a middle-class / working-renter tenant base. Strengths: housing A+, commute A, employment A; Watch: cost of living C-, amenities D, health & safety F.
- Peoria Unified School District (4237) (suburban): math 36% / reading 42% proficiency, ranked #64 of 249 in AZ (top 26%) — families likely to look elsewhere, expect single-tenant / working-renter base with shorter leases.
- Market conditions: Rents flat; 333 active listings in the ZIP; 40 comparable units currently listed for rent nearby; rentals at typical pace (median 25d on market — plan ~3-4 weeks tenant-placement turnaround); 36,011 units permitted in Maricopa County in 2024 (12,801 in 5+ unit buildings).
- This rent runs 34% of the median local income ($67k/yr) — at the standard rent-burdened threshold; future hikes will face affordability resistance.
Forward outlook
- Local home prices are declining (-3.0%/yr); year-one equity from $263 of loan paydown is wiped out by about $1k of value loss. Plan a longer hold.
- Maricopa County population projected at +38% by 2050 — long-run rental-demand tailwind backs the buy-and-hold thesis.
- At projected returns (-3.0% appreciation + 0.6% rent growth), your $11k cash investment doubles in ~1 year — after that, you're playing with house money.
Negotiation context
- It's been on market 60 days — a 3% lower offer ($37k) is reasonable based on typical stale-listing flexibility.
- 5 sale attempts since 4y ago; this cycle's ask has dropped $4k (10%) from the opening price — seller is motivated, your offer sets the floor, not the list.
Risks & watch-outs
- Climate carrying-cost: extreme-heat days projected 6→16/yr by 2055 (HVAC capex compounding) — expect insurance premiums to compound above CPI over the hold.
Questions for the listing agent
- It's been on market 60 days. Have you received any prior offers? Is the seller open to a 3% concession, seller financing, or rate buy-down credit?
- Is there a deadline driving the sale (1031 exchange, divorce, estate, relocation)? That informs how much negotiation room exists.
- Schools are B-rated — typically a magnet for longer-tenancy family renters. What's the average tenant stay here, and is there a school-zone premium baked into asking?
- What's the average days-on-market for RENTAL listings here right now (not sales)? A rising rental-DOM trend means longer vacancies and softer asking-rent achievability than the comps imply.
- What's the recent tenant-quality profile in this submarket — average credit score on applications, eviction rate, late-payment / NSF rate, and stable-employment percentage? A property-management company in the area should have these aggregated.
- How much new for-sale + rental construction is in the pipeline within 1–3 miles? Heavy new supply typically softens prices + rents 12–24 months out; constrained supply supports both.
Investment metrics
- 1% rule
- 5.05% ✓
- Cap rate
- 45.86%
- Cash-on-cash
- 141.32%
- DSCR
- 7.29
- GRM
- 1.7
CMA / ARV
- ARV (median comp)
- $57,983
- List price
- $38,000
- Delta
- -34.46%
- Verdict
- UNDERPRICED
- Comps
- 20 within 1.0 mi
Show comp detail 12 sales within ~0.75 mi
| Address | Dist | Beds/Ba | Sqft | Sold | Price | $/sf | Match |
|---|---|---|---|---|---|---|---|
| 10960 N 67th Ave #39 | 0.31mi | 2/2.0 | 1,344 (0%) | 6mo | $95,000 | $71 | 81 |
| 10960 N 67th Ave #22 | 0.17mi | 2/2.0 | 1,388 (+3%) | 11mo | $95,300 | $69 | 78 |
| 6960 W Peoria Ave #183 | 0.12mi | 2/2.0 | 1,248 (-7%) | 7mo | $36,000 | $29 | 76 |
| 6960 W Peoria Ave #201 | 0.00mi | 2/2.0 | 1,512 (+12%) | 4mo | $63,000 | $42 | 76 |
| 6960 W Peoria Ave #59 | 0.00mi | 2/2.0 | 1,188 (-12%) | 7mo | $74,000 | $62 | 75 |
| 10960 N 67th Ave #56 | 0.30mi | 2/2.0 | 1,392 (+4%) | 8mo | $55,000 | $40 | 73 |
| 10960 N 67th Ave #155 | 0.17mi | 2/2.0 | 1,488 (+11%) | 2mo | $20,000 | $13 | 73 |
| 10960 N 67th Ave #213 | 0.17mi | 2/2.0 | 1,440 (+7%) | 9mo | $45,000 | $31 | 73 |
| 10960 N 67th Ave #81 | 0.31mi | 2/2.0 | 1,440 (+7%) | 2mo | $25,000 | $17 | 72 |
| 10960 N 67th Ave #202 | 0.31mi | 2/2.0 | 1,248 (-7%) | 4mo | $57,500 | $46 | 70 |
| 7344 W Peoria Ave #4 | 0.51mi | 2/2.0 | 1,344 (0%) | 11mo | $32,500 | $24 | 67 |
| 6960 W Peoria Ave #166 | 0.14mi | 2/2.0 | 1,152 (-14%) | 4mo | $72,000 | $63 | 66 |
Match score weights: distance 35% · size 25% · config 20% · recency 20%. Top-matched comps best support the ARV.
Projected returns pro-forma
-3.0% appreciation · 0.62% rent growth · sell at horizon
- IRR
- —
- Equity multiple
- 7.50×
- Total profit
- $69,192
- Equity at exit
- $5,666
- IRR
- —
- Equity multiple
- 14.68×
- Total profit
- $145,577
- Equity at exit
- $3,286
Cash invested: $10,640 (down + closing). Projections, not guarantees.
Landlord ↔ Tenant lean methodology
- Overall (STATE)
- 87 Strongly Landlord-Friendly
- State Arizona
- 87 Strongly Landlord-Friendly · R+3
- County
- — inherits STATE
- City
- — inherits STATE
ZIP-level market 85345
- Home prices YoY
- -19.8%
- Rents YoY
- 0.6%
- Active inventory
- 333
- Price-to-rent
- 1.7×
Monthly cashflow live
- Estimated rent
- $1,919 high interval (Pro) →
- Mortgage (P&I)
- −$199
- Tax est. 1.5%
- −$48 /mo · $570/yr
- Insurance
- −$16
- HOA
- −$0
- Vacancy / Maint / Mgmt
- −$403
- Net cashflow
- $1,253
Break-even live
Sensitivity live
| Price | -10% $1,279 | -5% $1,266 | +0% $1,253 | +5% $1,240 | +10% $1,227 |
|---|---|---|---|---|---|
| Rent | -10% $1,102 | -5% $1,177 | +0% $1,253 | +5% $1,329 | +10% $1,405 |
| Rate | -1.0pp $1,272 | -0.5pp $1,263 | base $1,253 | +0.5pp $1,243 | +1.0pp $1,233 |
UW: 25.0% down · 7.5% · 30yr · 1.5% tax · 5.0% vac · 8.0% maint · 8.0% mgmt
Financing live
Cash to close
- Down payment
- $9,500
- Closing costs
- $1,140
- Reserves months
- —
- Total cash needed
- —
Loan-product check · same deal, 3 products live
Conventional
25% down · 7.5% · 30yr
- Down + closing
- —
- Monthly P&I
- —
- Monthly cashflow
- —
- DSCR
- —
- Eligible?
- —
Personal DTI + credit; lowest rate.
DSCR
20% down · 8.5% · 30yr
- Down + closing
- —
- Monthly P&I
- —
- Monthly cashflow
- —
- DSCR
- —
- Eligible?
- —
No personal income docs; deal must DSCR.
Hard money
10% down · 12.0% · 12mo
- Down + closing
- —
- Monthly P&I
- —
- Monthly cashflow
- —
- DSCR
- —
- Eligible?
- —
Short-term bridge; refi at stabilization.
Rent comps 40 comps
| Address | Beds | Baths | Sqft | Rent | $/sqft | DOM | Units | Dist |
|---|---|---|---|---|---|---|---|---|
| 7034 W McMahon Way Peoria, AZ | 3.0 | 2.5 | 1606 | $1,895 | $1.18 | 21d | 1 | 0.16mi |
| 7022 W Cesar St Peoria, AZ | 3.0 | 2.5 | 1514 | $1,895 | $1.25 | 44d | 1 | 0.18mi |
| 6605 W Mescal St Glendale, AZ | 3.0 | 2.0 | 1369 | $1,895 | $1.38 | 5d | 1 | 0.46mi |
| 6525 W Mercer Ln Glendale, AZ | 3.0 | 2.0 | 1501 | $1,750 | $1.17 | 13d | 1 | 0.46mi |
| 10851 N 65th Ave Glendale, AZ | 3.0 | 2.0 | 1501 | $1,900 | $1.27 | 24d | 1 | 0.55mi |
| 10013 N 66th Ln Glendale, AZ | 3.0 | 2.0 | 1063 | $1,999 | $1.88 | 24d | 1 | 0.61mi |
| 7309 W Canterbury Dr Peoria, AZ | 3.0 | 2.0 | 1858 | $2,100 | $1.13 | 5d | 1 | 0.68mi |
| 9819 N 67th Dr Peoria, AZ | 3.0 | 2.0 | 1648 | $2,500 | $1.52 | 24d | 1 | 0.68mi |
| 9914 N 73rd Ave Peoria, AZ | 3.0 | 1.5 | 1312 | $1,716 | $1.31 | 44d | 1 | 0.73mi |
| 10615 N 63rd Dr Glendale, AZ | 3.0 | 2.5 | 1837 | $3,395 | $1.85 | 21d | 1 | 0.75mi |
| 6325 W Cheryl Dr Glendale, AZ | 2.0 | 2.0 | 1092 | $2,100 | $1.92 | 24d | 1 | 0.78mi |
| 7102 W Palo Verde Ave Peoria, AZ | 3.0 | 2.0 | 1360 | $2,000 | $1.47 | 44d | 1 | 0.79mi |
| 7027 W Palo Verde Ave Peoria, AZ | 3.0 | 2.0 | 1500 | $1,999 | $1.33 | 44d | 1 | 0.79mi |
| 6619 W Desert Hills Dr Glendale, AZ | 3.0 | 2.5 | 1650 | $1,750 | $1.06 | 24d | 1 | 0.83mi |
| 11740 N 74th Dr Peoria, AZ | 3.0 | 2.0 | 1622 | $2,000 | $1.23 | 24d | 1 | 0.86mi |
| 12083 N 66th Ave Glendale, AZ | 3.0 | 2.5 | 1620 | $2,100 | $1.30 | 44d | 1 | 0.86mi |
| 7102 W Carol Ave Peoria, AZ | 3.0 | 2.0 | 1288 | $1,970 | $1.53 | 5d | 1 | 0.89mi |
| 6219 W North Ln Glendale, AZ | 3.0 | 2.0 | 1662 | $1,939 | $1.17 | 17d | 1 | 0.89mi |
| 9459 N 64th Dr Glendale, AZ | 3.0 | 2.0 | 1531 | $2,600 | $1.70 | 15d | 1 | 0.93mi |
| 9350 N 67th Ave Unit B2 Glendale, AZ | 2.0 | 2.0 | 970 | $1,250 | $1.29 | 44d | 1 | 0.96mi |
| 9350 N 67th Ave Glendale, AZ | 2.0 | 2.0 | 970 | $1,429 | $1.47 | 44d | 1 | 0.97mi |
| 9350 N 67th Ave Glendale, AZ | 2.0 | 2.0 | 970 | $1,385 | $1.43 | 13d | 1 | 0.97mi |
| 7570 W Jenan Dr Peoria, AZ | 3.0 | 2.0 | 1656 | $2,395 | $1.45 | 24d | 1 | 0.98mi |
| 11807 N 76th Ave Peoria, AZ | 3.0 | 2.0 | 1228 | $1,995 | $1.62 | 44d | 1 | 1.01mi |
| 6421 W Carol Ave Glendale, AZ | 3.0 | 2.0 | 1243 | $1,799 | $1.45 | 19d | 1 | 1.02mi |
| 7040 W Olive Ave #12 Peoria, AZ | 2.0 | 2.0 | 900 | $1,445 | $1.61 | 24d | 1 | 1.04mi |
| 10654 N 60th Ave Glendale, AZ | 1.0–2.0 | 1.0–2.0 | 732 | $1,475 | $2.01 | 2d | 27 | 1.06mi |
| 9121 N 68th Ave Peoria, AZ | 2.0 | 2.0 | 1126 | $1,699 | $1.51 | 44d | 1 | 1.07mi |
| 9160 N 67th Ave Unit 212 Peoria, AZ | 2.0 | 2.0 | 992 | $1,680 | $1.69 | 24d | 1 | 1.07mi |
| 7655 W Sunnyside Dr Peoria, AZ | 3.0 | 2.0 | 1779 | $2,144 | $1.21 | 44d | 1 | 1.07mi |
| 9160 N 67th Ave Peoria, AZ | 2.0 | 2.0 | 1100 | $2,065 | $1.88 | 44d | 6 | 1.07mi |
| 11851 N 76th Dr Peoria, AZ | 3.0 | 2.0 | 1266 | $1,899 | $1.50 | 5d | 1 | 1.09mi |
| 9903 N 77th Ave Peoria, AZ | 3.0 | 2.0 | 1446 | $1,895 | $1.31 | 5d | 1 | 1.11mi |
| 7040 W Olive Ave Peoria, AZ | 2.0 | 2.0 | 953 | $1,465 | $1.54 | 5d | 1 | 1.14mi |
| 6353 W Mission Ln Glendale, AZ | 3.0 | 2.0 | 1780 | $2,200 | $1.24 | 44d | 1 | 1.17mi |
| 7914 W Mescal St Peoria, AZ | 3.0 | 2.0 | 1296 | $1,700 | $1.31 | 5d | 1 | 1.27mi |
| 7730 W Shaw Butte Dr Peoria, AZ | 3.0 | 2.0 | 1563 | $2,399 | $1.53 | 22d | 1 | 1.27mi |
| 9022 N 63rd Dr Glendale, AZ | 3.0 | 2.0 | 1401 | $2,195 | $1.57 | 13d | 1 | 1.29mi |
| 8938 N 64th Ln Glendale, AZ | 3.0 | 2.0 | 1256 | $2,095 | $1.67 | 1d | 1 | 1.34mi |
| 8772 N 67th Ave Glendale, AZ | 1.0–3.0 | 1.0–2.0 | 937 | $1,654 | $1.77 | 1d | 24 | 1.44mi |
Listing history 28 events
-
2026-06-18days on market $38,000 Active 60 DOM
-
2026-06-17days on market $38,000 Active 59 DOM
-
2026-06-16days on market $38,000 Active 58 DOM
-
2026-06-15days on market $38,000 Active 57 DOM
-
2026-06-13days on market $38,000 Active 55 DOM
-
2026-06-13days on market $38,000 Active 54 DOM
-
2026-06-09days on market $38,000 Active 51 DOM
-
2026-06-08days on market $38,000 Active 50 DOM
-
2026-06-07days on market $38,000 Active 49 DOM
-
2026-06-04days on market $38,000 Active 46 DOM
-
2026-06-03days on market $38,000 Active 45 DOM
-
2026-06-02days on market $38,000 Active 44 DOM
-
2026-06-01days on market $38,000 Active 43 DOM
-
2026-05-31days on market $38,000 Active 42 DOM
-
2026-04-17$42,000 Active 373-char remark
Show marketing remark (373 chars)
PRICED TO SELL!!! This Cozy 2B/2B home Is located In a 55+Community with pool, Fitness Center, Clubhouse,Game Room, Library and many activities! With NEW FLOORING,Screened In Patio,Large Storage Shed and Spacious Family room for entertaining, as well as Accessibility thoughtfully designed with a full entry ramp from the carport. DON'T MISS OUT ON THIS GREAT OPPORTUNITY!
-
2026-04-14historical
-
2026-04-03$50,000 Active
-
2026-04-03price $50,000
-
2023-09-06soldstatus $69,900 Closed
-
2023-09-05status Pending
-
2023-07-28historical Contract Contingent on Buyer Sale
-
2023-06-14price $69,900
-
2023-05-19$75,000 Active
-
2022-05-06soldstatus $89,999 Closed
-
2022-05-03historical Under Contract Accepting Backups
-
2022-03-31status Active
-
2022-03-04historical Under Contract Accepting Backups
-
2022-01-31$99,999 Active
ⓘ Source: listings_history table (triggers on properties + properties_extension) + one-shot
backfill from property_details.listing_events for pre-trigger history.
Climate risk First Street
- Flood 1/10 Low FEMA zone X (shaded) · 0% chance over 30 yrs
- Wildfire 1/10 Low
- Heat 9/10 Extreme 6 d/yr ≥112°F today · 16 d/yr by 30 yrs out
- Wind 1/10 Low
- Air quality 3/10 Moderate 3 unhealthy d/yr today · 3 by 30 yrs out
Nearby sold comps map
Loading sold comps map…
Walkable amenities ~0.75 mi
Loading nearby amenities…
Taxation est. · year 1
- Rental income
- $23,023
- − Mortgage interest
- −$2,129
- − Property taxes
- −$570
- − Insurance
- −$190
- − Repairs & maintenance
- −$1,842
- − Management
- −$1,842
- − Depreciation
- −$1,105
- Taxable income
- $15,345
- Est. tax owed @ 24.0%
- −$3,683
- After-tax cash flow
- $11,354/yr
For passive investors: Depreciation is non-cash, so a rental often shows a tax loss while cash-flowing — sheltering income. Rental losses are passive: they offset passive income freely, and up to $25,000/yr can offset ordinary (W-2) income if you actively participate and your MAGI is under $100k (phasing out to $0 by $150k); unused losses carry forward. On sale, claimed depreciation is recaptured at up to 25%, and gains may owe capital-gains tax (a 1031 exchange can defer both). Figures are a year-1 estimate at your 24.0% rate — not tax advice; consult a CPA.
Schools (NCES district)
- District
- Peoria Unified School District (4237)
- NCES district ID
- 0406250
- Math proficiency
- 36% ▼ -14.00%
- Reading proficiency
- 42% ▼ -8.00%
- Median HH income
- $60,171
- Composite
- 34.62/100
- National rank
- #5152
- State rank
- #64 of 249 in AZ
Livability — Peoria
- Score
- 76/100
- State rank
- #14
- US rank
- #3603
Category grades
Schools grade is shown separately in the Schools card above.
Census & demographics
- Census place
- Peoria, AZ
- County
- Maricopa County · 4,537,380 people
- City population
- 206,687
- Metro
- Phoenix-Mesa-Chandler, AZ
- Population (ZIP)
- 60,918
- Household income
- $67,380
- Rent vs Own
- Severe rent burden
- 1879.0
Population outlook (Maricopa County) Hauer SSP2
- Today (2025)
- 4,979,203 people
- By 2030
- 5,378,229 · +8.0%
- By 2040
- 6,156,598 · +23.6%
- By 2050
- 6,872,376 · +38.0%
- By 2075
- 8,401,270 · +68.7%
- By 2100
- 9,247,439 · +85.7%
Race, ethnicity, and origin ACS 2023
- Neighborhood character
- Diverse neighborhood (Simpson 0.62)
- Race & ethnicity
- White 51% Hispanic / Latino 34% Two or more races 14% Black 5% Asian 4% Native American 2%
- Hispanic origin (detail)
- Mexican 29%
- Common ancestry
- Romanian 2% Italian 2% Slovak 1%
- Foreign-born
- 13% · Canada, Vietnam
- Languages at home
- 76% English-only · Spanish 18% Other Indo-European 1% Vietnamese 1%
Political lean MEDSL · Maricopa
- 2024 margin
- Toss-up / Even · D 47.7% · R 51.2% · Other 1.1%
- 2008→2024 swing
- +7.1pp toward D · 2008: -10.6pp · 2024: -3.5pp
- All cycles
- 2024: R+3.5 2020: D+2.2 2016: R+3.5 2012: R+12.0 2008: R+10.6
Not yet ingested
- Civics
- —
Market trends
- HPI YoY
- ▼ -80.77%
- Current HPI
- 328.1069
- Rent YoY
- ▲ 0.62%
- Metro
- Phoenix-Mesa-Chandler, AZ
- State GDP YoY
- ▲ 4.54%
- F500 in state
- 20
Industry mix (Fortune 500 HQ in AZ)
| Industry | F500 HQs | Revenue |
|---|---|---|
| Technology | 2 | $13B |
|
||
| Mining / Metals | 1 | $23B |
|
||
| Environmental Services | 1 | $16B |
|
||
| Metals / Steel | 1 | $14B |
|
||
| Technology Distribution | 1 | $9B |
|
||
| Homebuilding | 1 | $8B |
|
||
Price history
-58.0% since first listed14 events — show timeline
- 2026-04-17 Listed $42,000 ARMLS
- 2026-04-14 Listing Removed — ARMLS
- 2026-04-03 Listed $50,000 ARMLS
- 2026-04-03 Price Changed $50,000 ARMLS
- 2023-09-06 Sold (MLS) $69,900 ARMLS
- 2023-09-05 Pending — ARMLS
- 2023-07-28 Contingent — ARMLS
- 2023-06-14 Price Changed $69,900 ARMLS
- 2023-05-19 Listed $75,000 ARMLS
- 2022-05-06 Sold (MLS) $89,999 ARMLS
- 2022-05-03 Contingent — ARMLS
- 2022-03-31 Relisted — ARMLS
- 2022-03-04 Contingent — ARMLS
- 2022-01-31 Listed $99,999 ARMLS
Cash-flow waterfall
monthlySold comps — $/sqft
last 12 mo · ≤1 miLoading sold comps…