1252 Pacific Ave Unit A · San Francisco, CA
Flood risk 1/10 · Minimal
- FEMA flood zone
- X (unshaded)
- Chance of flooding over 30 yrs
- 0.0%
- Est. flood insurance / yr
- $507 – $1,088
Fire risk 1/10 · Minimal
- Est. fire insurance / yr
- $659 – $1,223
Heat risk 2/10 · Minimal
- Hot days now (above 79°F)
- 7 days/yr
- Hot days in 30 yrs
- 16 days/yr
Wind risk 1/10 · Minimal
- Chance of severe wind over 30 yrs
- —
Air-quality risk 8/10 · Major
- Unhealthy air days now
- 15 days/yr
- Unhealthy air days in 30 yrs
- 15 days/yr
Risk factors via First Street. Map © Google.
Why this score? — see what drove the D grade
The composite is a weighted blend of 9 inputs, each scored 0–100. Each bar is that input's sub-score; the figure is the points it added to the 100-point composite (weight × sub-score).
- Cash flow +7.5/30.0
- ARV discount +7.5/15.0
- Appreciation +7.5/10.0
- Rent growth +5.0/5.0
- Schools +5.0/10.0
- Livability +3.8/5.0
- Condition / age +2.5/5.0
- 1% rule +2.4/10.0
- DSCR +1.7/10.0
$655,000
🖨 Deal sheet 📄 Offer letter ✓ Due diligence
Listing remarks
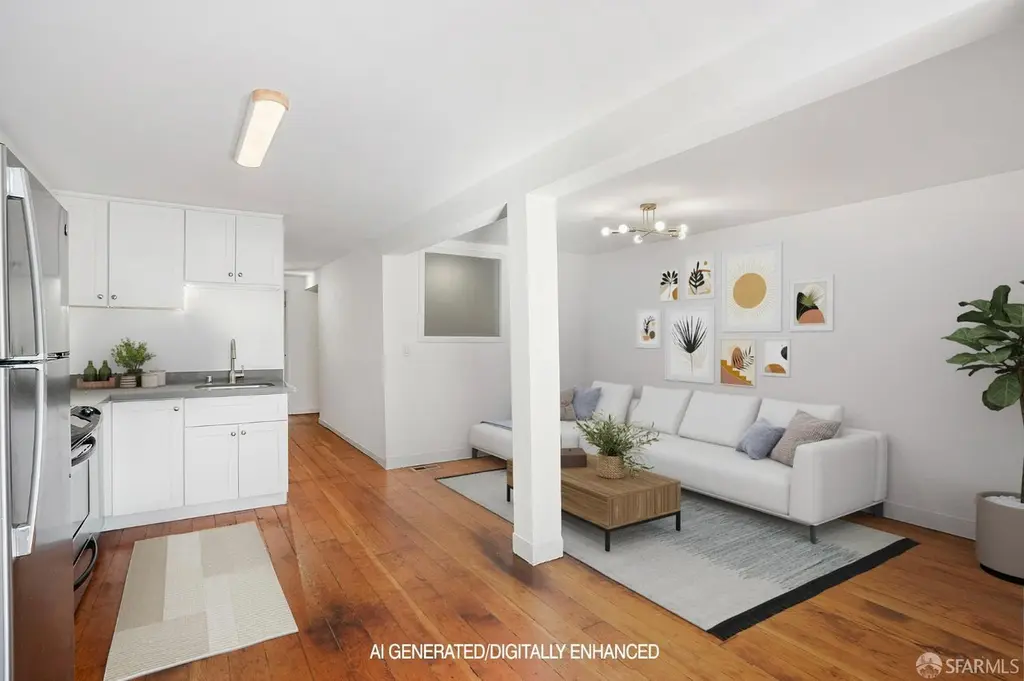
Nestled on the ground level of a distinguished Nob Hill residence, this beautifully updated one-bedroom plus bonus room sanctuary marries timeless San Francisco charm with contemporary comfort. Rich hardwood floors flow throughout. The chef-inspired kitchen features sleek quartz counters and stainless steel appliances, thoughtfully designed for seamless entertaining and everyday ease. The gracious primary bedroom offers direct access to a verdant, shared garden retreat, a rare treasure in the heart of the city's historic core. Every modern convenience is at your fingertips, including an in-unit washer and dryer and a well-appointed full bath. With a walk and transit score of over 90, and i
Key facts
- $128 HOA
- Built 1911
- Listed 127 days
Tags
Property features AI
Finance
- HOA & community: Monthly HOA fee of $128; Community of 3 units
Exterior
- Home design: Residential condominium; One story; Built in 1911
- Construction: Built in 1911
- Exterior features: Entry at ground level
Interior
- Kitchen: Dishwasher; Free-standing refrigerator
- Bedrooms: 1 bedroom
- Flooring: Wood
- Bathrooms: 1 full bathroom
- Heating & cooling: Central heating
- Interior features: Central heating; Wood floors
- Laundry & utility: Stacked washer/dryer
Neighborhood map
What this means for you Summary
Snapshot
- This is a 1-bed/1.0-bath condo listed at $655k.
Deal economics
- At list price, monthly cash flow is $-802 ($-10k/yr) — negative.
- To cash-flow at today's rent, offer at most $539k (17.7% below list).
- To meet the 1% rule (rent ≥ 1% of price), the offer needs to be $488k (25.5% below list).
- Recommended offer: $488k (25.5% below list) — sets the bar for 1% rule.
- Cap rate 4.8% vs local median 2.1% in San Francisco — top-decile yield for the area; either an underpriced asset or a hidden risk that comps aren't pricing in. Stress-test before assuming the spread holds.
Location & tenants
- Location reads 76/100 on livability (#90 in CA, #3,143 nationally) — a middle-class / working-renter tenant base. Strengths: amenities A+, commute A+, employment A+; Watch: crime F, cost of living F.
- San Francisco Unified (urban): math 50% / reading 56% proficiency, ranked #322 of 1,400 in CA (top 23%) — acceptable for families but not a draw, mixed tenant base, ~2y average lease.
- Market conditions: Rents rising fast (+15.6%/yr); 155 active listings in the ZIP; 40 comparable units currently listed for rent nearby; rentals at typical pace (median 15d on market — plan ~3-4 weeks tenant-placement turnaround); solid renter incomes; 750 units permitted in San Francisco County in 2024 (688 in 5+ unit buildings).
- At $4,877/mo this rent would consume 55% of the median local household income ($106k/yr) (locally 5272% of renters already pay >50% of income on rent) — very limited rent-growth headroom before tenants either downsize or default.
Forward outlook
- In year one you build about $37k of equity ($5k loan paydown + $33k appreciation (5.0% local appreciation)).
- San Francisco County population projected at +39% by 2050 — long-run rental-demand tailwind backs the buy-and-hold thesis.
- By year 2, paydown + projected appreciation supports a ~$60k cash-out refi (75% LTV) — recoverable capital for the next deal without selling this one.
Negotiation context
- It's been on market 128 days — a 12% lower offer ($576k) is reasonable based on typical stale-listing flexibility.
- 2 sale attempts; this cycle's ask has dropped $120k (15%) from the opening price — seller is motivated, your offer sets the floor, not the list.
Risks & watch-outs
- Watch-outs: built in 1911 — expect roof / HVAC / electrical / plumbing capex.
Questions for the listing agent
- What do current leases actually rent for vs. the listed asking? Can we see a recent rent roll and the last 12 months of T-12 income?
- It's been on market 128 days. Have you received any prior offers? Is the seller open to a 26% concession, seller financing, or rate buy-down credit?
- Built in 1911 — when were the roof, HVAC, electrical panel, plumbing, and water heater last replaced?
- What does the HOA fee cover, when was the last increase, and are there any pending special assessments or reserve-fund shortfalls?
- Any open or pending special assessments — roof, HVAC, plumbing, elevator, façade? What's the per-unit balance and payoff schedule, and is the seller paying it off at close or rolling it to the buyer?
- Why hasn't it sold? Are there any deal-killer items the seller is aware of (foundation, flood, title, zoning, code violations)?
- Is there a deadline driving the sale (1031 exchange, divorce, estate, relocation)? That informs how much negotiation room exists.
- Schools are B-rated — typically a magnet for longer-tenancy family renters. What's the average tenant stay here, and is there a school-zone premium baked into asking?
- Crime grade is F in this area — have there been break-ins, vandalism, or insurance claims at this property in the last 3 years? What carrier currently insures it and at what premium?
- The area grade is low — what's the realistic commute time and amenity access for the typical tenant pool here? Any planned neighborhood developments (good or bad) we should know about?
- What's the average days-on-market for RENTAL listings here right now (not sales)? A rising rental-DOM trend means longer vacancies and softer asking-rent achievability than the comps imply.
- What's the recent tenant-quality profile in this submarket — average credit score on applications, eviction rate, late-payment / NSF rate, and stable-employment percentage? A property-management company in the area should have these aggregated.
- How much new apartment / multifamily construction is in the pipeline within 1–3 miles? Heavy new supply (>2% of stock underway) typically softens rents 12–24 months out; light construction supports rent growth.
Investment metrics
- 1% rule
- 0.74% ✗
- Cap rate
- 4.82%
- Cash-on-cash
- -5.25%
- DSCR
- 0.77
- GRM
- 11.2
CMA / ARV
No comps found within radius.
Projected returns pro-forma
5.02% appreciation · 8.0% rent growth · sell at horizon
- IRR
- 10.5%
- Equity multiple
- 1.69×
- Total profit
- $126,618
- Equity at exit
- $372,028
- IRR
- 13.8%
- Equity multiple
- 3.67×
- Total profit
- $488,808
- Equity at exit
- $642,773
Cash invested: $183,400 (down + closing). Projections, not guarantees.
Landlord ↔ Tenant lean methodology
- Overall (CITY)
- 0 Strongly Tenant-Friendly
- State California
- 18 Strongly Tenant-Friendly · D+13
- County
- — inherits STATE
- City San Francisco
- 0 Strongly Tenant-Friendly · D+57
ZIP-level market 94109
- Home prices YoY
- 2.9%
- Rents YoY
- 15.6%
- Active inventory
- 155
- Price-to-rent
- 11.2×
Monthly cashflow live
- Estimated rent
- $4,877 high interval (Pro) →
- Mortgage (P&I)
- −$3,435
- Tax est. 1.5%
- −$819 /mo · $9,825/yr
- Insurance
- −$273
- HOA
- −$128
- Vacancy / Maint / Mgmt
- −$1,024
- Net cashflow
- $-802
Break-even live
UW: 25.0% down · 7.5% · 30yr · 1.5% tax · 5.0% vac · 8.0% maint · 8.0% mgmt
Financing live
Cash to close
- Down payment
- $163,750
- Closing costs
- $19,650
- Reserves months
- —
- Total cash needed
- —
Loan-product check · same deal, 3 products live
Conventional
25% down · 7.5% · 30yr
- Down + closing
- —
- Monthly P&I
- —
- Monthly cashflow
- —
- DSCR
- —
- Eligible?
- —
Personal DTI + credit; lowest rate.
DSCR
20% down · 8.5% · 30yr
- Down + closing
- —
- Monthly P&I
- —
- Monthly cashflow
- —
- DSCR
- —
- Eligible?
- —
No personal income docs; deal must DSCR.
Hard money
10% down · 12.0% · 12mo
- Down + closing
- —
- Monthly P&I
- —
- Monthly cashflow
- —
- DSCR
- —
- Eligible?
- —
Short-term bridge; refi at stabilization.
Rent comps 40 comps
| Address | Beds | Baths | Sqft | Rent | $/sqft | DOM | Units | Dist |
|---|---|---|---|---|---|---|---|---|
| 1401 Jones St San Francisco, CA | 1.0 | 1.0 | 550 | $5,500 | $10.00 | 7d | 1 | 0.13mi |
| 1425 Taylor St San Francisco, CA | 1.0 | 1.0 | 554 | $4,845 | $8.75 | 24d | 1 | 0.13mi |
| 1450 Washington St Unit 1450-07 San Francisco, CA | 2.0 | 1.0 | 818 | $6,500 | $7.95 | 10d | 1 | 0.15mi |
| 1310 Jones St San Francisco, CA | 2.0 | 2.0 | 1367 | $10,250 | $7.50 | 3d | 4 | 0.20mi |
| 1557 Washington St San Francisco, CA | 1.0 | 1.0 | 600 | $3,795 | $6.33 | 24d | 1 | 0.23mi |
| 1221 Jones St San Francisco, CA | 1.0 | 1.0 | 650 | $7,000 | $10.77 | 12d | 1 | 0.24mi |
| 959-961 Union St Unit 02 San Francisco, CA | 1.0 | 1.0 | 650 | $3,600 | $5.54 | 3d | 1 | 0.25mi |
| 1224 Sacramento St Unit 1569483P San Francisco, CA | 1.0 | 1.0 | 893 | $7,512 | $8.41 | 5d | 1 | 0.28mi |
| 2233 Larkin St San Francisco, CA | 2.0 | 1.0 | 1100 | $6,200 | $5.64 | 2d | 1 | 0.32mi |
| 1190 Pine St San Francisco, CA | — | 1.0 | 590 | $2,800 | $4.75 | 43d | 1 | 0.38mi |
| 1140 Greenwich St Unit 301 San Francisco, CA | 1.0 | 1.0 | 1100 | $3,500 | $3.18 | 43d | 1 | 0.40mi |
| 770 Filbert St Unit 3 San Francisco, CA | 2.0 | 1.0 | 1050 | $5,190 | $4.94 | 43d | 1 | 0.40mi |
| 950 Pine St San Francisco, CA | — | 1.0 | 750 | $2,650 | $3.53 | 16d | 1 | 0.42mi |
| 1426 Stockton St San Francisco, CA | — | 1.0 | 700 | $3,100 | $4.43 | 43d | 1 | 0.45mi |
| 903 Pine St San Francisco, CA | 1.0 | 1.0 | 757 | $4,495 | $5.94 | 43d | 1 | 0.47mi |
| 1755 Van Ness Ave San Francisco, CA | 1.0 | 1.0 | 884 | $5,095 | $5.76 | 3d | 1 | 0.48mi |
| 1755 Van Ness Ave San Francisco, CA | 1.0 | 1.0 | 947 | $5,195 | $5.49 | 13d | 1 | 0.48mi |
| 1735 Van Ness Ave San Francisco, CA | 2.0 | 1.0 | 1064 | $8,510 | $8.00 | 7d | 2 | 0.48mi |
| 1690 Broadway San Francisco, CA | 1.0–2.0 | 1.0 | 761 | $5,345 | $7.02 | 7d | 2 | 0.49mi |
| 1472 Filbert St San Francisco, CA | 2.0 | 1.0 | 941 | $7,895 | $8.39 | 11d | 1 | 0.49mi |
| 800 Bush St San Francisco, CA | 2.0 | 1.0 | 1020 | $4,650 | $4.56 | 43d | 1 | 0.50mi |
| 81 Frank Norris St San Francisco, CA | 1.0 | 1.0 | 620 | $1,700 | $2.74 | 13d | 1 | 0.52mi |
| 1305 Lombard St San Francisco, CA | 2.0 | 2.0 | 1050 | $8,995 | $8.57 | 12d | 1 | 0.54mi |
| 845 Sutter St San Francisco, CA | 1.0 | 1.0 | 700 | $2,895 | $4.14 | 14d | 1 | 0.54mi |
| 965 Sutter St San Francisco, CA | 2.0 | 1.0–2.0 | 618 | $3,377 | $5.46 | 2d | 1 | 0.54mi |
| 1080 Sutter St San Francisco, CA | 2.0 | 1.0 | 750 | $4,150 | $5.53 | 43d | 1 | 0.55mi |
| 1860 Jackson St San Francisco, CA | 1.0 | 1.0 | 1000 | $5,495 | $5.50 | 3d | 1 | 0.55mi |
| 650 Chestnut St #104 San Francisco, CA | 2.0 | 2.0 | 1080 | $6,500 | $6.02 | 7d | 1 | 0.55mi |
| 1750 Vallejo St Unit 402 San Francisco, CA | 1.0 | 1.0 | 1000 | $7,950 | $7.95 | 16d | 1 | 0.56mi |
| 737 Bush St San Francisco, CA | 1.0 | 1.0 | 750 | $2,595 | $3.46 | 14d | 1 | 0.56mi |
| 600 Chestnut St #301 San Francisco, CA | 2.0 | 2.0 | 1098 | $5,600 | $5.10 | 43d | 1 | 0.56mi |
| 725 Leavenworth St Unit 5 San Francisco, CA | 2.0 | 2.0 | 742 | $4,600 | $6.20 | 14d | 1 | 0.57mi |
| 71 Water St Unit 101 San Francisco, CA | 2.0 | 1.0 | 738 | $5,850 | $7.93 | 43d | 1 | 0.57mi |
| 71 Water St Unit 301 San Francisco, CA | 2.0 | 1.0 | 763 | $5,950 | $7.80 | 43d | 1 | 0.57mi |
| 71 Water St Unit 401 San Francisco, CA | 2.0 | 1.0 | 763 | $6,295 | $8.25 | 43d | 1 | 0.57mi |
| 2080 Gough St San Francisco, CA | 2.0 | 2.0 | 1000 | $7,495 | $7.50 | 24d | 1 | 0.59mi |
| 2550 Gough St #6 San Francisco, CA | 1.0 | 1.0 | 1009 | $3,269 | $3.24 | 43d | 1 | 0.59mi |
| 540 Stockton St Apt 8 San Francisco, CA | 2.0 | 1.0 | 725 | $5,370 | $7.41 | 2d | 1 | 0.60mi |
| 737 Post St San Francisco, CA | 2.0 | 1.0–2.0 | 515 | $3,882 | $7.53 | 1d | 11 | 0.60mi |
| 1201 Sutter St #208 San Francisco, CA | 1.0 | 1.0 | 531 | $2,150 | $4.05 | 43d | 1 | 0.62mi |
HOA detail condo
- Monthly dues
- $128 · $1,536/yr
- Assessments
- None detected in remarks — confirm with the listing agent.
Listing history 6 events
-
2026-05-31days on market $655,000 Active 128 DOM
-
2026-05-01status Active
-
2026-04-27historical Contingent - Show
-
2026-03-18price $655,000
-
2026-02-25price $770,000
-
2026-01-23$775,000 Active
ⓘ Source: listings_history table (triggers on properties + properties_extension) + one-shot
backfill from property_details.listing_events for pre-trigger history.
Climate risk First Street
- Flood 1/10 Low FEMA zone X (unshaded) · 0% chance over 30 yrs
- Wildfire 1/10 Low
- Heat 2/10 Low 7 d/yr ≥79°F today · 16 d/yr by 30 yrs out
- Wind 1/10 Low
- Air quality 8/10 Severe 15 unhealthy d/yr today · 15 by 30 yrs out
Nearby sold comps map
Loading sold comps map…
Walkable amenities ~0.75 mi
Loading nearby amenities…
Taxation est. · year 1
- Rental income
- $58,522
- − Mortgage interest
- −$36,690
- − Property taxes
- −$9,825
- − Insurance
- −$3,275
- − Repairs & maintenance
- −$4,682
- − Management
- −$4,682
- − HOA
- −$1,536
- − Depreciation
- −$19,055
- Taxable loss
- −$21,223
- Est. tax savings @ 24.0%
- +$5,093
- After-tax cash flow
- $-4,529/yr
For passive investors: Depreciation is non-cash, so a rental often shows a tax loss while cash-flowing — sheltering income. Rental losses are passive: they offset passive income freely, and up to $25,000/yr can offset ordinary (W-2) income if you actively participate and your MAGI is under $100k (phasing out to $0 by $150k); unused losses carry forward. On sale, claimed depreciation is recaptured at up to 25%, and gains may owe capital-gains tax (a 1031 exchange can defer both). Figures are a year-1 estimate at your 24.0% rate — not tax advice; consult a CPA.
Schools (NCES district)
- District
- San Francisco Unified
- NCES district ID
- 0634410
- Math proficiency
- 50% ▬ 0.00%
- Reading proficiency
- 56% ▲ 1.00%
- Median HH income
- $81,249
- Composite
- 50.14/100
- National rank
- #4088
- State rank
- #322 of 1400 in CA
Livability — San Francisco
- Score
- 76/100
- State rank
- #90
- US rank
- #3143
Category grades
Schools grade is shown separately in the Schools card above.
Census & demographics
- Census place
- San Francisco, CA
- County
- San Francisco County · 827,552 people
- City population
- 827,552
- Metro
- San Francisco-Oakland-Berkeley, CA
- Population (ZIP)
- 54,553
- Household income
- $106,018
- Rent vs Own
- Severe rent burden
- 5272.0
Population outlook (San Francisco County) Hauer SSP2
- Today (2025)
- 1,030,936 people
- By 2030
- 1,110,409 · +7.7%
- By 2040
- 1,270,010 · +23.2%
- By 2050
- 1,435,001 · +39.2%
- By 2075
- 1,779,074 · +72.6%
- By 2100
- 1,966,767 · +90.8%
Race, ethnicity, and origin ACS 2023
- Neighborhood character
- Diverse neighborhood (Simpson 0.66)
- Race & ethnicity
- White 50% Asian 27% Hispanic / Latino 13% Two or more races 10% Black 4%
- Hispanic origin (detail)
- Mexican 7% Puerto Rican 1%
- Common ancestry
- Lithuanian 3% Italian 3% Romanian 2%
- Foreign-born
- 31% · China, Canada, Vietnam
- Languages at home
- 64% English-only · Chinese 10% Spanish 7% Other Asian/Pacific 4%
Political lean MEDSL · San Francisco
- 2024 margin
- Solid D (+64.8) · D 80.3% · R 15.5% · Other 4.1%
- 2008→2024 swing
- -5.7pp toward R · 2008: 70.5pp · 2024: 64.8pp
- All cycles
- 2024: D+64.8 2020: D+72.5 2016: D+76.1 2012: D+70.2 2008: D+70.5
Not yet ingested
- Civics
- —
Market trends
- HPI YoY
- ▲ 5.02%
- Current HPI
- 175.8886
- Rent YoY
- ▲ 15.60%
- Metro
- San Francisco-Oakland-Berkeley, CA
- State GDP YoY
- ▲ 3.21%
- F500 in state
- 116
Industry mix (Fortune 500 HQ in CA)
| Industry | F500 HQs | Revenue |
|---|---|---|
| Technology | 27 | $1,492B |
|
||
| Financial Services | 3 | $174B |
|
||
| Retail | 3 | $44B |
|
||
| Insurance | 3 | $26B |
|
||
| Media / Entertainment | 2 | $115B |
|
||
| Pharmaceuticals / Biotech | 2 | $62B |
|
||
Price history
-15.5% since first listed5 events — show timeline
- 2026-05-01 Relisted — San Francisco MLS
- 2026-04-27 Contingent — San Francisco MLS
- 2026-03-18 Price Changed $655,000 San Francisco MLS
- 2026-02-25 Price Changed $770,000 San Francisco MLS
- 2026-01-23 Listed $775,000 San Francisco MLS
Cash-flow waterfall
monthlySold comps — $/sqft
last 12 mo · ≤1 miLoading sold comps…